Skip to content

Inference for Categorical Data: Proportions

AP Statistics · Topic 6

Video lesson for this topic Open the video page
7:52

Inference for Categorical Data: Proportions

A city wants to know how many people support a new policy. We cannot ask everyone, so we ask two hundred at random. A hundred and twenty say yes — sixty…

English narration · English + 中文 subtitles burned in

6.1

Why Be Normal?

Syllabus
Enduring UnderstandingLearning ObjectiveEssential Knowledge

VAR-1
Given that variation may be random or not, conclusions are uncertain.

VAR-1.H
Identify questions suggested by variation in the shapes of distributions of samples taken from the same population. [Skill 1.A]

  • VAR-1.H.1 Variation in shapes of data distributions may be random or not.

Source: College Board AP Course and Exam Description

A poll says $52\%$ of voters back a candidate, "with a margin of error of $3$ points". Is the candidate really ahead? A company claims $90\%$ of customers are satisfied, and your sample finds $84\%$. Is the claim false, or was your sample unlucky? This unit gives the two tools that answer such questions: confidence intervals and significance tests.

Because a sample proportion 样本比例 $\hat{p}$ is approximately normally distributed 正态分布的 (when the conditions 条件 hold), we can measure how far a sample result is from a claimed value in standard errors 标准误, and turn that into a probability. This is what makes inference 推断 – drawing conclusions about a population 总体 from a sample – possible.

Vocabulary Train
English
sample proportion/ˈsæmpl prəˈpɔːʃn/
normally distributed
conditions/kənˈdɪʃnz/
standard errors
inference/ˈɪnfərəns/
population/ˌpɒpjʊˈleɪʃn/
6.2

Confidence Interval for a Proportion
Syllabus
Enduring UnderstandingLearning ObjectiveEssential Knowledge

UNC-4
An interval of values should be used to estimate parameters, in order to account for uncertainty.

UNC-4.A
Identify an appropriate confidence interval procedure for a population proportion. [Skill 1.D]

  • UNC-4.A.1 The appropriate confidence interval procedure for a one-sample proportion for one categorical variable is a one sample $z$-interval for a proportion.

UNC-4.B
Verify the conditions for calculating confidence intervals for a population proportion. [Skill 4.C]

  • UNC-4.B.1 In order to make assumptions necessary for inference on population proportions, means, and slopes, we must check for independence in data collection methods and for selection of the appropriate sampling distribution.
  • UNC-4.B.2 In order to calculate a confidence interval to estimate a population proportion, $p$, we must check for independence and that the sampling distribution is approximately normal.
    • a. To check for independence:
      • i. Data should be collected using a random sample or a randomized experiment.
      • ii. When sampling without replacement, check that $n \leq 10\%N$, where $N$ is the size of the population.
    • b. To check that the sampling distribution of $\hat{p}$ is approximately normal (shape):
      • i. For categorical variables, check that both the number of successes, $n\hat{p}$, and the number of failures, $n(1-\hat{p})$ are at least 10 so that the sample size is large enough to support an assumption of normality.

UNC-4.C
Determine the margin of error for a given sample size and an estimate for the sample size that will result in a given margin of error for a population proportion. [Skill 3.D]

  • UNC-4.C.1 Based on sample data, the standard error of a statistic is an estimate for the standard deviation for the statistic. The standard error of $\hat{p}$ is $SE_{\hat{p}} = \sqrt{\dfrac{\hat{p}(1-\hat{p})}{n}}$.
  • UNC-4.C.2 A margin of error gives how much a value of a sample statistic is likely to vary from the value of the corresponding population parameter.
  • UNC-4.C.3 For categorical variables, the margin of error is the critical value ($z^*$) times the standard error (SE) of the relevant statistic, which equals $z^* \sqrt{\dfrac{\hat{p}(1-\hat{p})}{n}}$ for a one sample proportion.
  • UNC-4.C.4 The formula for margin of error can be rearranged to solve for $n$, the minimum sample size needed to achieve a given margin of error. For this purpose, use a guess for $\hat{p}$ or use $\hat{p} = 0.5$ in order to find an upper bound for the sample size that will result in a given margin of error.

UNC-4.D
Calculate an appropriate confidence interval for a population proportion. [Skill 3.D]

  • UNC-4.D.1 In general, an interval estimate can be constructed as point estimate ± (margin of error). For a one-sample proportion, the interval estimate is $\hat{p} \pm z^* \sqrt{\dfrac{\hat{p}(1-\hat{p})}{n}}$.
    • Clarifying statement: Formulas for interval estimates do not appear explicitly on the AP Statistics Formula Sheet provided with the AP Statistics Exam. However, these formulas do not need to be memorized, as they can be constructed based on the general test statistic formula and the relevant standard error formulas that are provided on the formula sheet.
  • UNC-4.D.2 Critical values represent the boundaries encompassing the middle C% of the standard normal distribution, where C% is an approximate confidence level for a proportion.

UNC-4.E
Calculate an interval estimate based on a confidence interval for a population proportion. [Skill 3.D]

  • UNC-4.E.1 Confidence intervals for population proportions can be used to calculate interval estimates with specified units.

Source: College Board AP Course and Exam Description

What a confidence interval means

A confidence interval 置信区间 estimates the parameter 参数 as a range: statistic $\pm$ margin of error 误差幅度.

$$\hat{p}\pm z^{*}\sqrt{\frac{\hat{p}(1-\hat{p})}{n}}.$$
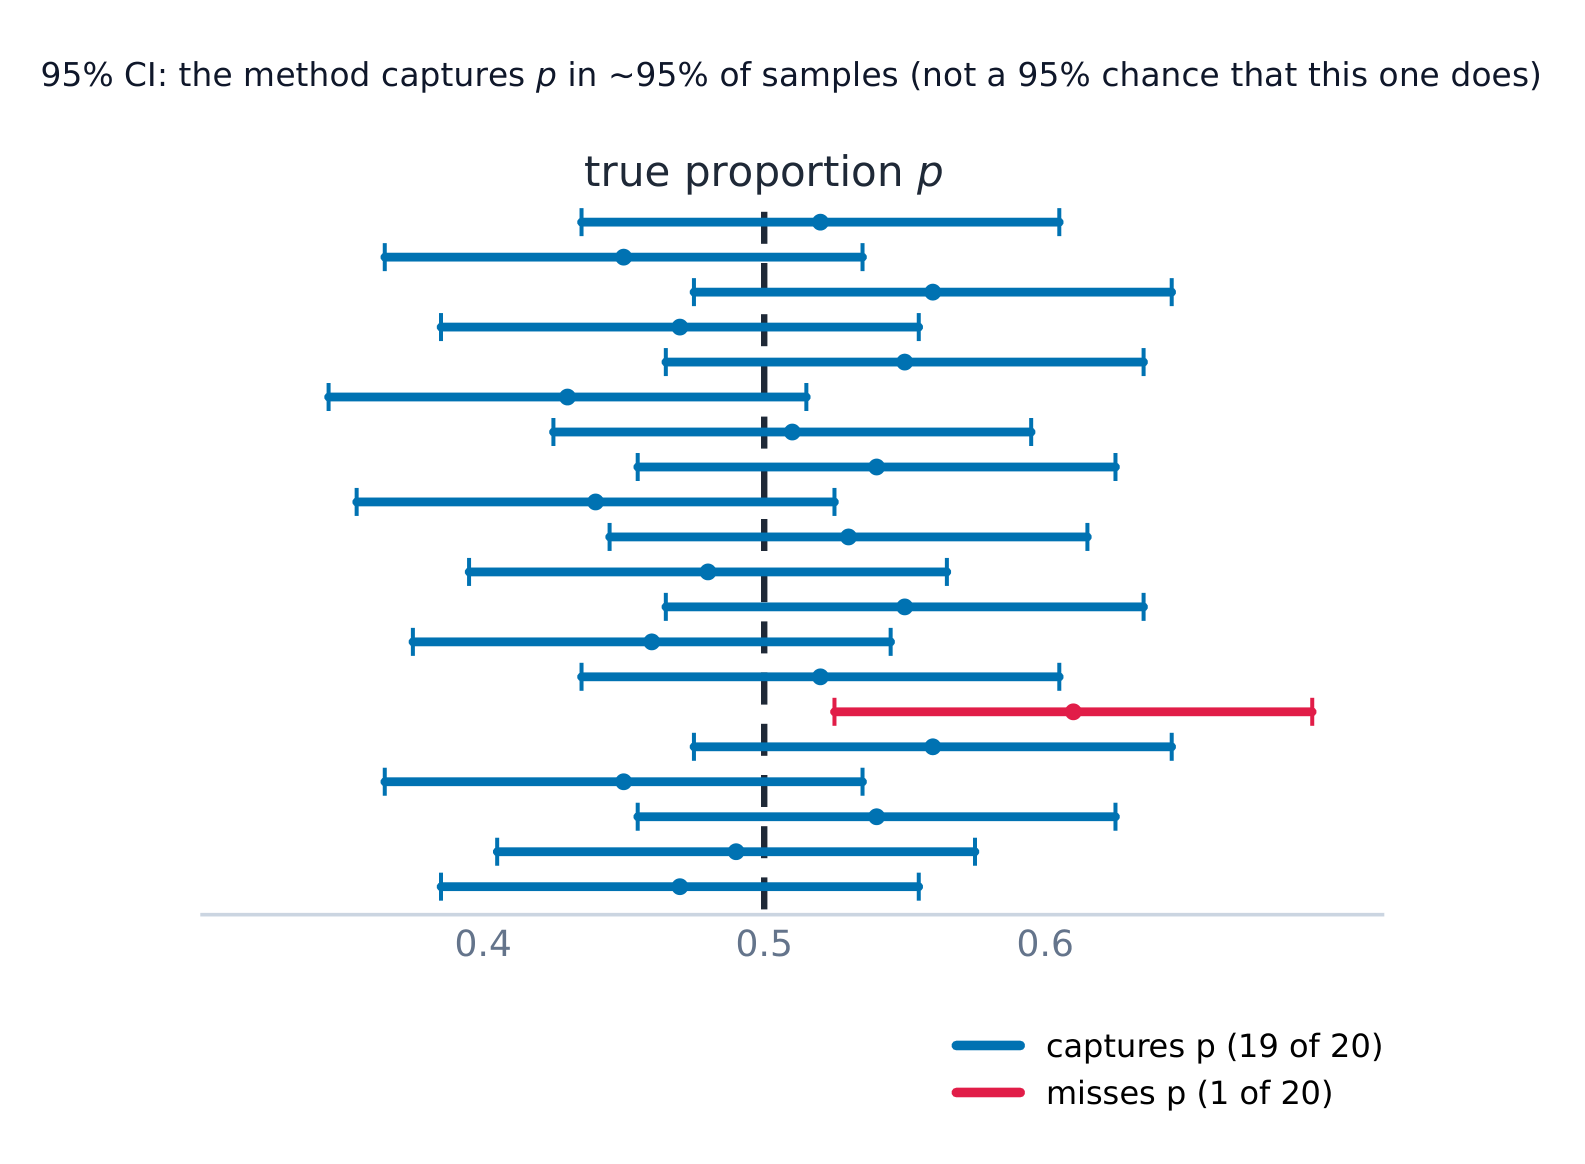
$z^{*}$ is the critical value 临界值 for the confidence level 置信水平 (e.g. $1.96$ for 95%). Conditions: random sample 随机样本, Large Counts condition 大计数条件 ($n\hat p\ge 10$ and $n(1-\hat p)\ge 10$), and the 10% condition. Interpret it: “We are 95% confident the true proportion of... is between... and...”. Interpret the level: “In 95% of samples, this method produces an interval that captures the true proportion.”

Why the conditions matter. The interval assumes the sampling distribution of $\hat p$ is approximately normal, which is what makes $z^*$ the right multiplier. With fewer than $10$ successes or failures, that distribution is skewed and the interval does not capture $p$ as often as claimed. The random condition lets you generalize to the population; the 10% condition keeps the observations close to independent, so the standard error formula is correct.

Over many samples, about 95% of 95% confidence intervals capture the true proportion

Worked example. In a random sample of $200$ people, $120$ support a policy, so $\hat{p}=0.60$. A $95\%$ interval uses $z^*=1.96$:

$$0.60\pm1.96\sqrt{\frac{0.60(0.40)}{200}}=0.60\pm0.068=(0.532,\ 0.668).$$
We are $95\%$ confident the true proportion of supporters is between $53.2\%$ and $66.8\%$.

Common mistakes. Saying “there is a $95\%$ chance that $p$ is between $0.532$ and $0.668$”: $p$ is fixed, and this interval either contains it or does not; the $95\%$ describes the method. Describing individuals or the sample instead of the population proportion. Skipping the Large Counts check: here $n\hat p=120$ and $n(1-\hat p)=80$, both at least $10$.
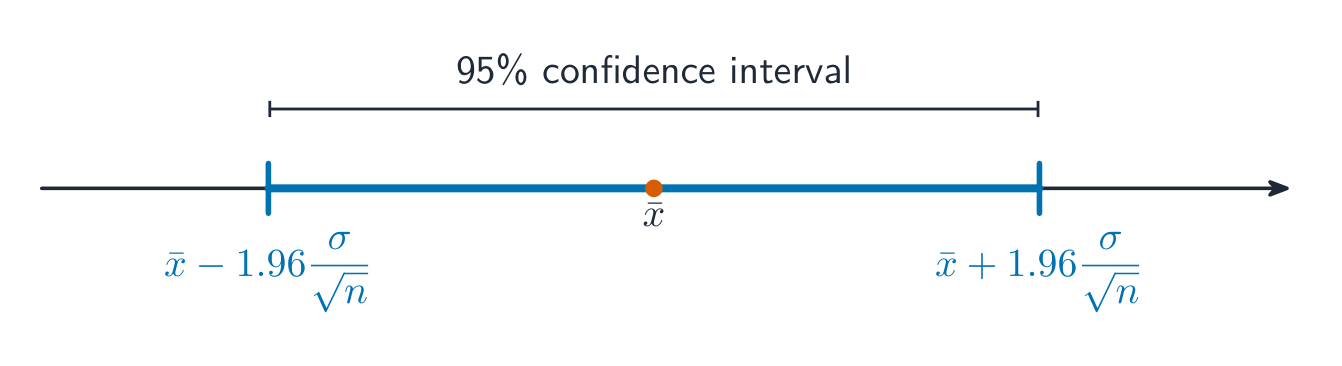
A 95% confidence interval reaches 1.96 standard errors each side of the estimate

Choosing the sample size. To keep the margin of error no larger than a target $m$, set $z^{*}\sqrt{\dfrac{\hat p(1-\hat p)}{n}}\le m$ and solve for $n$. When you have no estimate of $\hat p$, use $\hat p=0.5$: it makes $\hat p(1-\hat p)$ as large as possible, giving the safe (largest) required sample size. Always round the result up to the next whole person.

Worked example. How many people must you survey for a $95\%$ interval with margin of error at most $0.03$? Using $\hat p=0.5$ and $z^*=1.96$:

$$n=\frac{(z^*)^2\,\hat p(1-\hat p)}{m^2}=\frac{1.96^2(0.5)(0.5)}{0.03^2}=\frac{0.9604}{0.0009}\approx1067.1,$$
so you survey $1068$ people (always round up, since $1067$ would leave the margin a shade too big).

Width. The width of the interval is twice the margin of error. With everything else fixed, a larger sample gives a narrower interval (four times the sample halves the width), and a higher confidence level gives a wider one ($99\%$ uses $z^*=2.576$).

Vocabulary Train
English
confidence interval/ˈkɒnfɪdəns ˈɪntəvl/
parameter/pəˈræmɪtə/
margin of error/ˈmɑːdʒɪn ɒv ˈerə/
critical value/ˈkrɪtɪkl ˈvæljuː/
confidence level/ˈkɒnfɪdəns ˈlevl/
random sample/ˈrændəm ˈsæmpl/
Large Counts condition/lɑːdʒ kaʊnts kənˈdɪʃn/
6.3

Justifying a Claim from an Interval

Syllabus
Enduring UnderstandingLearning ObjectiveEssential Knowledge

UNC-4
An interval of values should be used to estimate parameters, in order to account for uncertainty.

UNC-4.F
Interpret a confidence interval for a population proportion. [Skill 4.B]

  • UNC-4.F.1 A confidence interval for a population proportion either contains the population proportion or it does not, because each interval is based on random sample data, which varies from sample to sample.
  • UNC-4.F.2 We are C% confident that the confidence interval for a population proportion captures the population proportion.
  • UNC-4.F.3 In repeated random sampling with the same sample size, approximately C% of confidence intervals created will capture the population proportion.
  • UNC-4.F.4 Interpreting a confidence interval for a one-sample proportion should include a reference to the sample taken and details about the population it represents.
    • Illustrative examples for UNC-4.F.4: For interpreting a 99% confidence interval of (0.268, 0.292), based on the proportion of a nationally representative sample of twelfth-grade students who answered a particular multiple choice question correctly: "We are 99 percent confident that the interval from 0.268 to 0.292 contains the population proportion of all United States twelfth-grade students who would answer this question correctly" (2011 FRQ 6(a)).

UNC-4.G
Justify a claim based on a confidence interval for a population proportion. [Skill 4.D]

  • UNC-4.G.1 A confidence interval for a population proportion provides an interval of values that may provide sufficient evidence to support a particular claim in context.

UNC-4.H
Identify the relationships between sample size, width of a confidence interval, confidence level, and margin of error for a population proportion. [Skill 4.A]

  • UNC-4.H.1 When all other things remain the same, the width of the confidence interval for a population proportion tends to decrease as the sample size increases. For a population proportion, the width of the interval is proportional to $\dfrac{1}{\sqrt{n}}$.
  • UNC-4.H.2 For a given sample, the width of the confidence interval for a population proportion increases as the confidence level increases.
  • UNC-4.H.3 The width of a confidence interval for a population proportion is exactly twice the margin of error.

Source: College Board AP Course and Exam Description

To judge a claimed value: if it lies inside the interval, the data are consistent with it; if it lies outside, the data give evidence against it. Base the conclusion on whether the plausible 可信 values include the claim, in context 结合情境.

Worked example (a discount program). A store's program should give a discount on $20\%$ of bills. A random sample gives the $95\%$ interval $0.15\pm0.06$, that is $(0.09,\ 0.21)$.

  • Is there convincing evidence the program is not working as intended? No: $0.20$ is inside the interval, so $20\%$ is a plausible value.
  • Is there convincing evidence that it does give the discount with probability $0.20$? Also no: many other values, such as $0.10$, are plausible too. An interval can never prove a single value.
  • A second sample four times as large also gives $\hat p=0.15$. Its margin of error is half as big, $0.03$, so the interval is $(0.12,\ 0.18)$. Now $0.20$ is outside: there is convincing evidence that the program gives fewer discounts than intended.

Worked example (an interval in other units). A $95\%$ interval for the proportion of water-cup customers who take soft drinks is $(0.24,\ 0.38)$. Each such customer costs $\$0.25$, and $3000$ customers ask for water cups in June. Multiply both ends: $3000\times0.25\times(0.24,\ 0.38)=(\$180,\ \$285)$. We are $95\%$ confident the June cost is between $\$180$ and $\$285$.

Vocabulary Train
English
plausible/ˈplɔːzɪbl/
in context
6.4

Setting Up a Test for a Proportion
Syllabus
Enduring UnderstandingLearning ObjectiveEssential Knowledge

VAR-6
The normal distribution may be used to model variation.

VAR-6.D
Identify the null and alternative hypotheses for a population proportion. [Skill 1.F]

  • VAR-6.D.1 The null hypothesis is the situation that is assumed to be correct unless evidence suggests otherwise, and the alternative hypothesis is the situation for which evidence is being collected.
  • VAR-6.D.2 For hypotheses about parameters, the null hypothesis contains an equality reference (=, ≥, or ≤), while the alternative hypothesis contains a strict inequality (<, >, or ≠). The type of inequality in the alternative hypothesis is based on the question of interest. Alternative hypotheses with < or > are called one-sided, and alternative hypotheses with ≠ are called two-sided. Although the null hypothesis for a one-sided test may include an inequality symbol, it is still tested at the boundary of equality.
  • VAR-6.D.3 The null hypothesis for a population proportion is: $H_0 : p = p_0$, where $p_0$ is the null hypothesized value for the population proportion.
  • VAR-6.D.4 A one-sided alternative hypothesis for a proportion is either $H_a : p < p_0$ or $H_a : p > p_0$. A two-sided alternate hypothesis is $H_a : p_1 \neq p_2$.
  • VAR-6.D.5 For a one-sample $z$-test for a population proportion, the null hypothesis specifies a value for the population proportion, usually one indicating no difference or effect.

VAR-6.E
Identify an appropriate testing method for a population proportion. [Skill 1.E]

  • VAR-6.E.1 For a single categorical variable, the appropriate testing method for a population proportion is a one-sample $z$-test for a population proportion.

VAR-6.F
Verify the conditions for making statistical inferences when testing a population proportion. [Skill 4.C]

  • VAR-6.F.1 In order to make statistical inferences when testing a population proportion, we must check for independence and that the sampling distribution is approximately normal:
    • a. To check for independence:
      • i. Data should be collected using a random sample or a randomized experiment.
      • ii. When sampling without replacement, check that $n \leq 10\%N$.
    • b. To check that the sampling distribution of $\hat{p}$ is approximately normal (shape):
      • i. Assuming that $H_0$ is true $(p = p_0)$, verify that both the number of successes, $np_0$, and the number of failures, $n(1-p_0)$ are at least 10 so that that the sample size is large enough to support an assumption of normality.

Source: College Board AP Course and Exam Description

A significance test 显著性检验 weighs evidence against a claim. State a null hypothesis 原假设 $H_0$ and an alternative hypothesis 备择假设 $H_a$ about the parameter $p$:

$$H_0: p=p_0 \qquad H_a: p\neq p_0 \ (\text{or } <,\, >).$$
Check the same conditions (random, Large Counts using $p_0$, 10%). The test statistic 检验统计量 counts standard errors from $p_0$:
$$z=\frac{\hat p-p_0}{\sqrt{p_0(1-p_0)/n}}.$$

Worked example. A company claims $90\%$ satisfaction ($p_0=0.90$); a sample of $100$ finds $84$ satisfied ($\hat{p}=0.84$). Test $H_0:p=0.90$ vs $H_a:p\neq0.90$ at $\alpha=0.05$:

$$z=\frac{0.84-0.90}{\sqrt{0.90(0.10)/100}}=\frac{-0.06}{0.03}=-2.0,$$
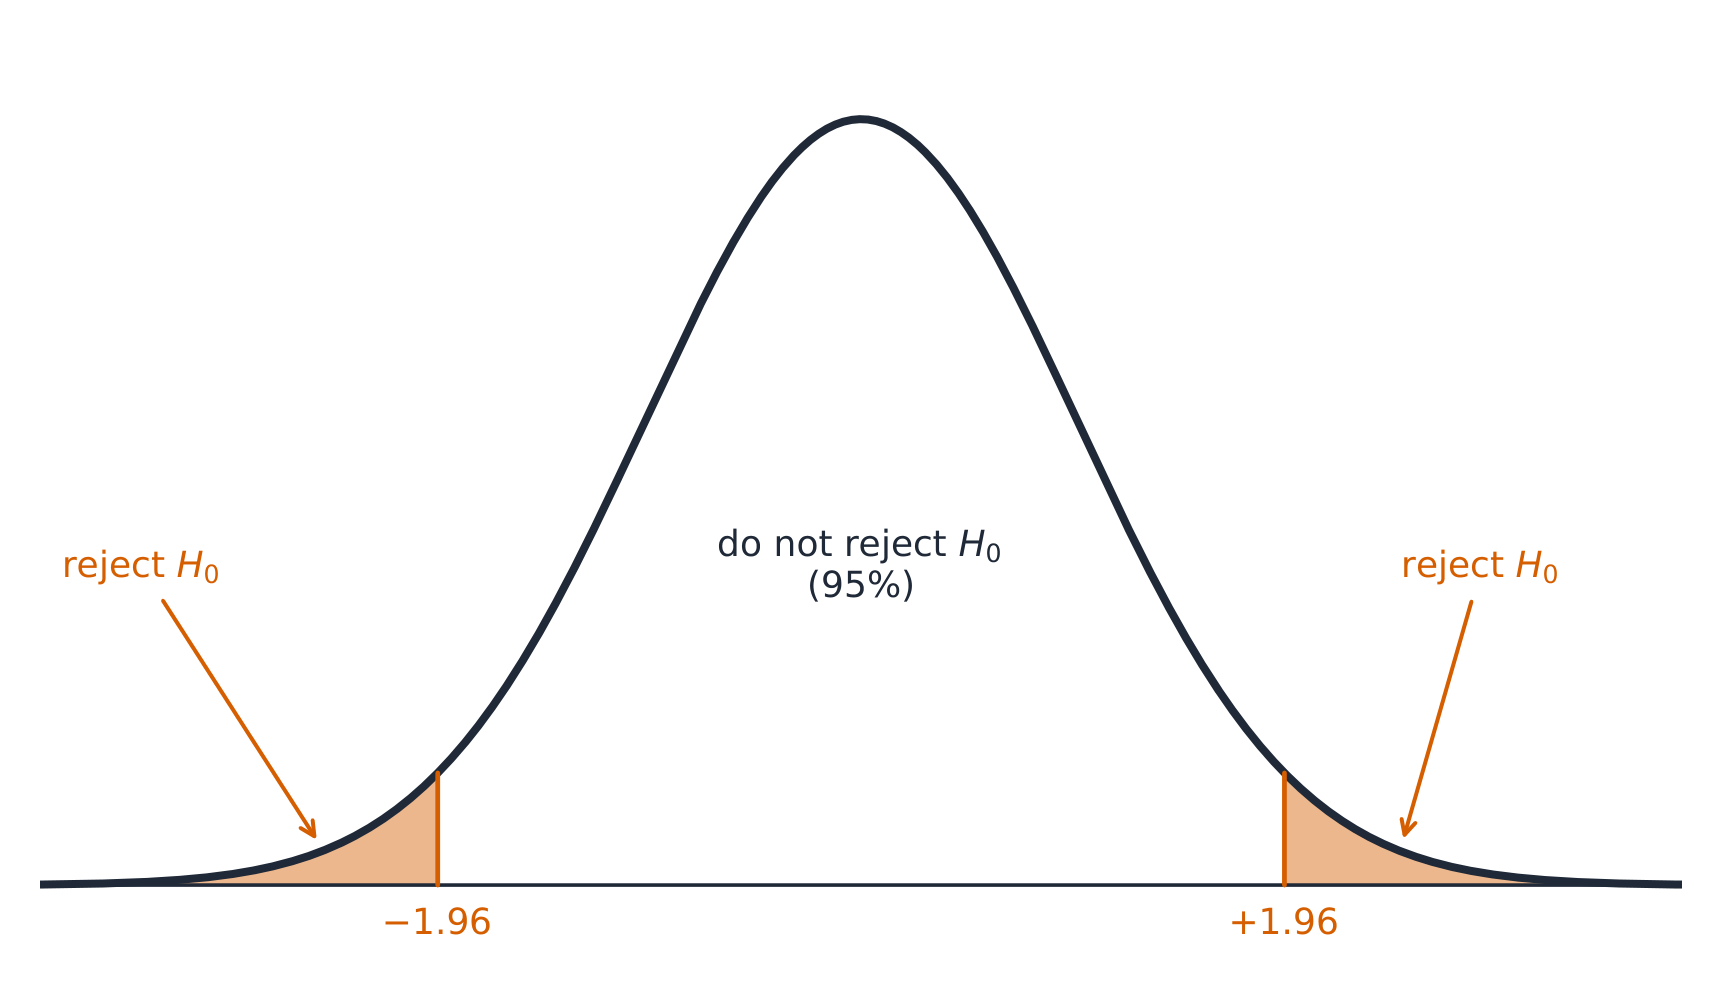
giving a two-tailed 双尾 $p$-value of about $2(0.023)=0.046$. Since $0.046<0.05$, we reject 拒绝 $H_0$ – there is evidence the true satisfaction rate differs from (is below) $90\%$.

A two-tailed 5% test rejects the null hypothesis in the shaded tails
Vocabulary Train
English
significance test/sɪɡˈnɪfɪkəns test/
null hypothesis/nʌl haɪˈpɒθəsɪs/
alternative hypothesis/ɔːlˈtɜːnətɪv haɪˈpɒθəsɪs/
test statistic/test stəˈtɪstɪk/
two-tailed/tuː teɪld/
reject/rɪˈdʒekt/
6.5

Interpreting p-Values

Syllabus
Enduring UnderstandingLearning ObjectiveEssential Knowledge

VAR-6
The normal distribution may be used to model variation.

VAR-6.G
Calculate an appropriate test statistic and $p$-value for a population proportion. [Skill 3.E]

  • VAR-6.G.1 The distribution of the test statistic assuming the null hypothesis is true (null distribution) can be either a randomization distribution or when a probability model is assumed to be true, a theoretical distribution ($z$).
  • VAR-6.G.2 When using a $z$-test, the standardized test statistic can be written: $\text{test statistic} = \dfrac{\text{sample statistic} - \text{null value of the parameter}}{\text{standard deviation of the statistic}}$. This is called a $z$-statistic for proportions.
  • VAR-6.G.3 The test statistic for a population proportion is: $z = \dfrac{\hat{p} - p_0}{\sqrt{\dfrac{p_0(1-p_0)}{n}}}$.
    • Clarifying statement: The formulas for test statistics do not appear explicitly on the AP Statistics Formula Sheet provided with the AP Statistics Exam. However, these formulas do not need to be memorized, as they can be constructed based on the general test statistic formula and the relevant standard error formulas that are provided on the formula sheet.
  • VAR-6.G.4 A $p$-value is the probability of obtaining a test statistic as extreme or more extreme than the observed test statistic when the null hypothesis and probability model are assumed to be true. The significance level may be given or determined by the researcher.

DAT-3
Significance testing allows us to make decisions about hypotheses within a particular context.

DAT-3.A
Interpret the $p$-value of a significance test for a population proportion. [Skill 4.B]

  • DAT-3.A.1 The $p$-value is the proportion of values for the null distribution that are as extreme or more extreme than the observed value of the test statistic. This is:
    • a. The proportion at or above the observed value of the test statistic, if the alternative is >.
    • b. The proportion at or below the observed value of the test statistic, if the alternative is <.
    • c. The proportion less than or equal to the negative of the absolute value of the test statistic plus the proportion greater than or equal to the absolute value of the test statistic, if the alternative is ≠.
  • DAT-3.A.2 An interpretation of the $p$-value of a significance test for a one-sample proportion should recognize that the $p$-value is computed by assuming that the probability model and null hypothesis are true, i.e., by assuming that the true population proportion is equal to the particular value stated in the null hypothesis.

Source: College Board AP Course and Exam Description

What a p-value means

The $p$-value P值 is the probability of getting a sample result as extreme or more extreme than the observed 观测到的 one, assuming $H_0$ is true. A small $p$-value means the data would be surprising if $H_0$ held – evidence against $H_0$. It is not the probability that $H_0$ is true.

A full interpretation has three parts: the assumption, the probability, and the observed result, in context. For the satisfaction test: "Assuming the true satisfaction rate is $90\%$, there is a $0.046$ probability of getting a sample proportion at least as far from $0.90$ as $0.84$ (in either direction) by chance in a random sample of $100$ customers." The distribution of the test statistic when $H_0$ is true is the null distribution; it may come from the normal model or from a simulation.

Common mistakes. Writing hypotheses about the statistic ($H_0:\hat p=0.90$): hypotheses are always about the parameter $p$. Using $\hat p$ in the test's standard error: the test assumes $H_0$, so it uses $p_0$ (the interval uses $\hat p$). Reading $p=0.046$ as “a $4.6\%$ chance that $H_0$ is true”.

Explore

A p-value as a tail area

A p-value is the probability, if the null hypothesis were true, of a result at least this extreme — the shaded tail area. Small p-values cast doubt on the null.

Vocabulary Train
English
observed/ɒbˈzɜːvd/
p-value/piː ˈvæljuː/
6.6

Concluding a Test

Syllabus
Enduring UnderstandingLearning ObjectiveEssential Knowledge

DAT-3
Significance testing allows us to make decisions about hypotheses within a particular context.

DAT-3.B
Justify a claim about the population based on the results of a significance test for a population proportion. [Skill 4.E]

  • DAT-3.B.1 The significance level, $\alpha$, is the predetermined probability of rejecting the null hypothesis given that it is true.
  • DAT-3.B.2 A formal decision explicitly compares the $p$-value to the significance level, $\alpha$. If the $p$-value $\leq \alpha$, reject the null hypothesis. If the $p$-value $> \alpha$, fail to reject the null hypothesis.
  • DAT-3.B.3 Rejecting the null hypothesis means there is sufficient statistical evidence to support the alternative hypothesis. Failing to reject the null means there is insufficient statistical evidence to support the alternative hypothesis.
  • DAT-3.B.4 The conclusion about the alternative hypothesis must be stated in context.
  • DAT-3.B.5 A significance test can lead to rejecting or not rejecting the null hypothesis, but can never lead to concluding or proving that the null hypothesis is true. Lack of statistical evidence for the alternative hypothesis is not the same as evidence for the null hypothesis.
  • DAT-3.B.6 Small $p$-values indicate that the observed value of the test statistic would be unusual if the null hypothesis and probability model were true, and so provide evidence for the alternative. The lower the $p$-value, the more convincing the statistical evidence for the alternative hypothesis.
  • DAT-3.B.7 $p$-values that are not small indicate that the observed value of the test statistic would not be unusual if the null hypothesis and probability model were true, so do not provide convincing statistical evidence for the alternative hypothesis nor do they provide evidence that the null hypothesis is true.
  • DAT-3.B.8 A formal decision explicitly compares the $p$-value to the significance $\alpha$. If the $p$-value $\leq \alpha$, then reject the null hypothesis, $H_0 : p = p_0$. If the $p$-value $> \alpha$, then fail to reject the null hypothesis.
  • DAT-3.B.9 The results of a significance test for a population proportion can serve as the statistical reasoning to support the answer to a research question about the population that was sampled.

Source: College Board AP Course and Exam Description

Compare the $p$-value to the significance level 显著性水平 $\alpha$ (often $0.05$):

  • $p\le\alpha$: reject $H_0$ – there is convincing evidence 有力证据 for $H_a$.
  • $p>\alpha$: fail to reject 不拒绝 $H_0$ – not enough evidence for $H_a$ (never “accept $H_0$”).

Always write the conclusion in context, linking back to the claim.

Common mistakes. Writing “accept $H_0$” or “this proves $p=0.90$” after a large $p$-value: failing to reject only means the evidence is not strong enough. Concluding without the comparison of the $p$-value with $\alpha$, or without context.

Explore

Lower-tail evidence for the worked test

The worked lower-sided test has z ≈ -1.67. The shaded left tail is approximately 0.0475 using this rounded statistic.

Vocabulary Train
English
significance level/sɪɡˈnɪfɪkəns ˈlevl/
convincing evidence
fail to reject/feɪl tə rɪˈdʒekt/
6.7

Type I and Type II Errors

Syllabus
Enduring UnderstandingLearning ObjectiveEssential Knowledge

UNC-5
Probabilities of Type I and Type II errors influence inference.

UNC-5.A
Identify Type I and Type II errors. [Skill 1.B]

  • UNC-5.A.1 A Type I error occurs when the null hypothesis is true and is rejected (false positive).
  • UNC-5.A.2 A Type II error occurs when the null hypothesis is false and is not rejected (false negative).
    • Table of Errors: With Actual Population Value across the top ($H_0$ true; $H_a$ true) and Decision down the side (Reject $H_0$; Fail to Reject $H_0$): Reject $H_0$ when $H_0$ true = Type I Error; Reject $H_0$ when $H_a$ true = Correct Decision; Fail to Reject $H_0$ when $H_0$ true = Correct Decision; Fail to Reject $H_0$ when $H_a$ true = Type II Error.

UNC-5.B
Calculate the probability of a Type I and Type II errors. [Skill 3.A]

  • UNC-5.B.1 The significance level, $\alpha$, is the probability of making a Type I error, if the null hypothesis is true.
  • UNC-5.B.2 The power of a test is the probability that a test will correctly reject a false null hypothesis.
  • UNC-5.B.3 The probability of making a Type II error $= 1 - power$.

UNC-5.C
Identify factors that affect the probability of errors in significance testing. [Skill 4.A]

  • UNC-5.C.1 The probability of a Type II error decreases when any of the following occurs, provided the others do not change:
    • i. Sample size(s) increases.
    • ii. Significance level ($\alpha$) of a test increases.
    • iii. Standard error decreases.
    • iv. True parameter value is farther from the null.

UNC-5.D
Interpret Type I and Type II errors. [Skill 4.B]

  • UNC-5.D.1 Whether a Type I or a Type II error is more consequential depends upon the situation.
  • UNC-5.D.2 Since the significance level, $\alpha$, is the probability of a Type I error, the consequences of a Type I error influence decisions about a significance level.

Source: College Board AP Course and Exam Description

Type I and Type II errors
  • A Type I error 第一类错误: rejecting a true $H_0$ (a false alarm 误报). Its probability is $\alpha$.
  • A Type II error 第二类错误: failing to reject a false $H_0$ (a missed detection 漏检). Its probability is $\beta$.
  • The power 检验效能 $=1-\beta$ is the chance of correctly detecting a real effect 效应. Power rises with a larger sample, a larger effect, or a larger $\alpha$.

Describe each error and its consequence 后果 in the problem's context. Which error is worse depends on the situation, and that decides $\alpha$. If a Type I error is very costly (approving a drug that does not work), choose a small $\alpha$, such as $0.01$. If a Type II error is worse (missing a dangerous fault), a larger $\alpha$ such as $0.10$ raises the power.

Worked example. In the satisfaction test above ($H_0:p=0.90$):

  • Type I error: concluding that the satisfaction rate is not $90\%$ when it really is $90\%$. Consequence: the company is wrongly accused of overstating its rate.
  • Type II error: failing to find evidence against $90\%$ when the true rate is different (say $85\%$). Consequence: customers keep trusting a rate that is too high.

A good answer names the error and says what happens because of it, in the words of the problem.

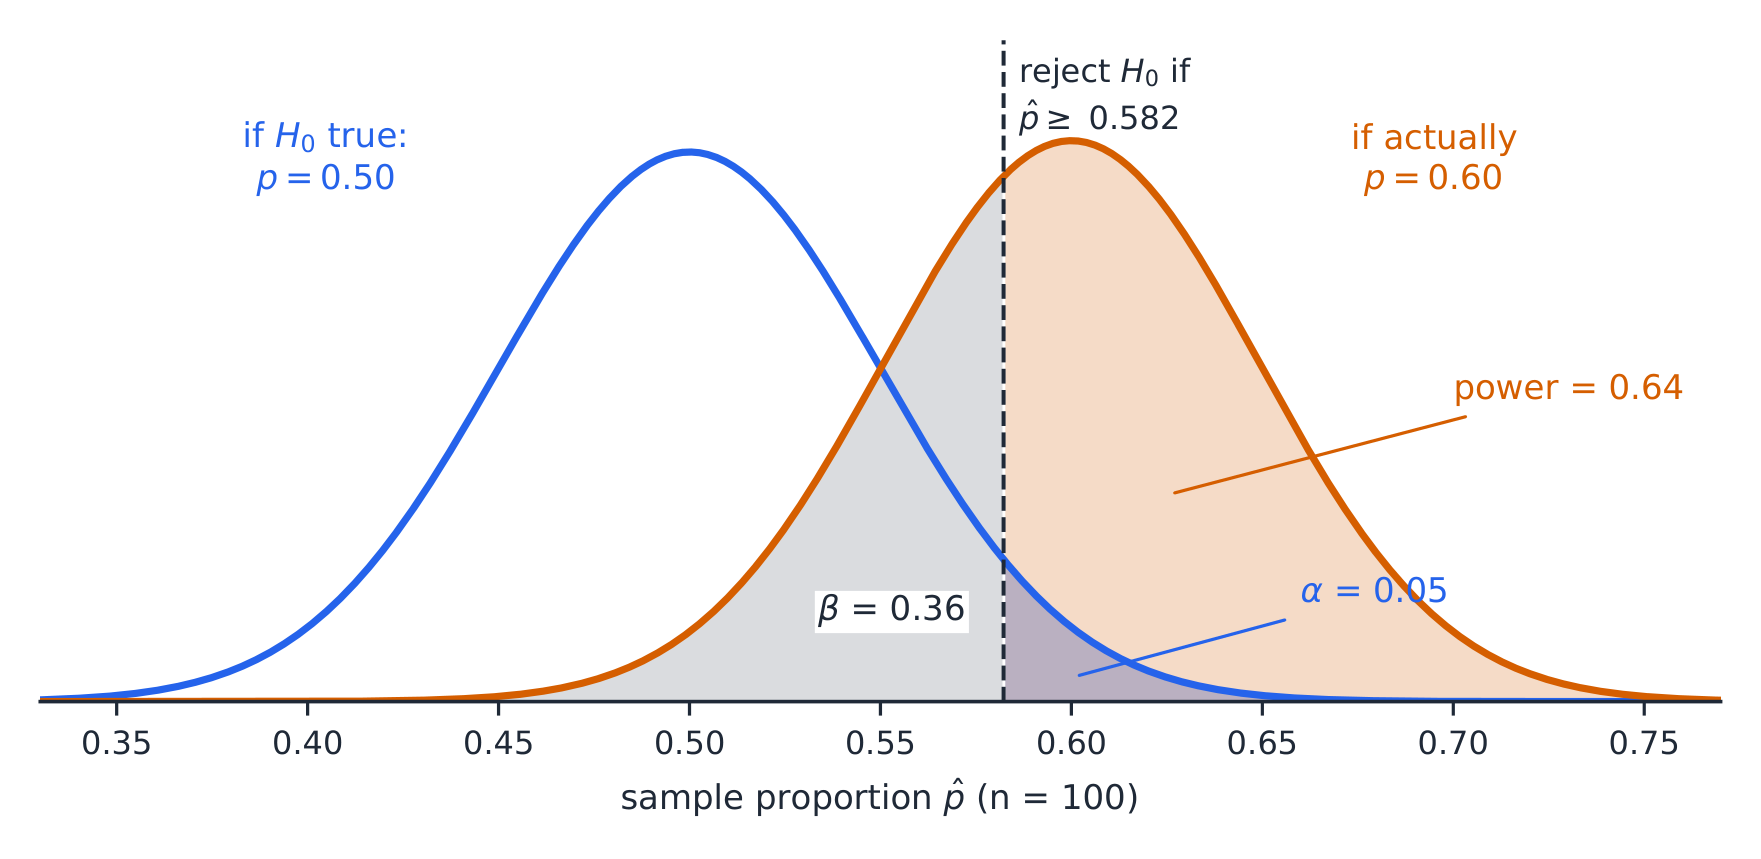
Power in a picture. Test $H_0:p=0.50$ against $H_a:p>0.50$ with $n=100$ and $\alpha=0.05$. The test rejects $H_0$ when $\hat p\ge0.582$. If the true proportion is really $0.60$, the chance of rejecting is the area of the orange curve beyond $0.582$: the power is $0.64$, so $\beta=0.36$.

Two normal curves for the sample proportion with n = 100: one centred at 0.50 (if the null hypothesis is true) and one at 0.60 (the true value). A dashed line at 0.582 marks the rejection cut-off. The blue tail beyond it is alpha = 0.05; the orange area beyond it is the power, 0.64; the hatched orange area below it is beta = 0.36
The cut-off is set by the null distribution; the power is the area of the true distribution beyond it

With a larger sample, both curves get narrower, so they overlap less: the power increases and $\beta$ falls. Power also increases with a larger $\alpha$ (the cut-off moves left) and with a true value farther from $p_0$.

Explore

Two ways a test can be wrong

A Type I error rejects a true null (false alarm); a Type II error keeps a false null (a miss). Lowering one usually raises the other.

Vocabulary Train
English
Type I error/taɪp aɪ ˈerə/
false alarm
Type II error/taɪp ˈtuː ˈerə/
missed detection
power/ˈpaʊə/
effect
consequence/ˈkɒnsɪkwəns/
6.8

Confidence Interval for a Difference of Proportions

Syllabus
Enduring UnderstandingLearning ObjectiveEssential Knowledge

UNC-4
An interval of values should be used to estimate parameters, in order to account for uncertainty.

UNC-4.I
Identify an appropriate confidence interval procedure for a comparison of population proportions. [Skill 1.D]

  • UNC-4.I.1 The appropriate confidence interval procedure for a two-sample comparison of proportions for one categorical variable is a two-sample $z$-interval for a difference between population proportions.

UNC-4.J
Verify the conditions for calculating confidence intervals for a difference between population proportions. [Skill 4.C]

  • UNC-4.J.1 In order to calculate confidence intervals to estimate a difference between proportions, we must check for independence and that the sampling distribution is approximately normal:
    • a. To check for independence:
      • i. Data should be collected using two independent, random samples or a randomized experiment.
      • ii. When sampling without replacement, check that $n_1 \leq 10\%N_1$ and $n_2 \leq 10\%N_2$.
    • b. To check that sampling distribution of $\hat{p}_1 - \hat{p}_2$ is approximately normal (shape).
      • i. For categorical variables, check that $n_1\hat{p}_1$, $n_1(1-\hat{p}_1)$, $n_2\hat{p}_2$, and $n_2\left(1-\hat{p}_2\right)$ are all greater than or equal to some predetermined value, typically either 5 or 10.

UNC-4.K
Calculate an appropriate confidence interval for a comparison of population proportions. [Skill 3.D]

  • UNC-4.K.1 For a comparison of proportions, the interval estimate is $(\hat{p}_1 - \hat{p}_2) \pm z^* \sqrt{\dfrac{\hat{p}_1(1-\hat{p}_1)}{n_1} + \dfrac{\hat{p}_2(1-\hat{p}_2)}{n_2}}$.
    • Clarifying statement: Formulas for interval estimates do not appear explicitly on the AP Statistics Formula Sheet provided with the AP Statistics Exam. However, these formulas do not need to be memorized, as they can be constructed based on the general test statistic formula and the relevant standard error formulas that are provided on the formula sheet.

UNC-4.L
Calculate an interval estimate based on a confidence interval for a difference of proportions. [Skill 3.D]

  • UNC-4.L.1 Confidence intervals for a difference in proportions can be used to calculate interval estimates with specified units.

Source: College Board AP Course and Exam Description

To compare two proportions, estimate $p_1-p_2$:

$$(\hat p_1-\hat p_2)\pm z^{*}\sqrt{\frac{\hat p_1(1-\hat p_1)}{n_1}+\frac{\hat p_2(1-\hat p_2)}{n_2}}.$$
Conditions must hold in both samples, and the samples must be independent.

Worked example. For the two teaching methods below ($\hat p_1=\tfrac{45}{75}=0.60$, $\hat p_2=\tfrac{32}{80}=0.40$), a $95\%$ interval for $p_1-p_2$ is

$$(0.60-0.40)\pm1.96\sqrt{\frac{0.60(0.40)}{75}+\frac{0.40(0.60)}{80}}=0.20\pm1.96(0.0787)=0.20\pm0.154,$$

which is $(0.046,\ 0.354)$. We are $95\%$ confident that method 1's true pass rate is between $4.6$ and $35.4$ percentage points 百分点 higher than method 2's. The interval uses the separate $\hat p$ values; the pooled $\hat p_c$ belongs only to the test.

Vocabulary Train
English
percentage points/pəˈsentɪdʒ pɔɪnts/
6.9

Justifying a Claim About Two Proportions

Syllabus
Enduring UnderstandingLearning ObjectiveEssential Knowledge

UNC-4
An interval of values should be used to estimate parameters, in order to account for uncertainty.

UNC-4.M
Interpret a confidence interval for a difference of proportions. [Skill 4.B]

  • UNC-4.M.1 In repeated random sampling with the same sample size, approximately C% of confidence intervals created will capture the difference in population proportions.
  • UNC-4.M.2 Interpreting a confidence interval for difference between population proportions should include a reference to the sample taken and details about the population it represents.

UNC-4.N
Justify a claim based on a confidence interval for a difference of proportions. [Skill 4.D]

  • UNC-4.N.1 A confidence interval for difference in population proportions provides an interval of values that may provide sufficient evidence to support a particular claim in context.

Source: College Board AP Course and Exam Description

If the interval for $p_1-p_2$ contains $0$, the data are consistent with no difference; if it lies entirely above or below $0$, there is evidence of a difference (in that direction). State the direction and context.

6.10

Setting Up a Test for a Difference

Syllabus
Enduring UnderstandingLearning ObjectiveEssential Knowledge

VAR-6
The normal distribution may be used to model variation.

VAR-6.H
Identify the null and alternative hypotheses for a difference of two population proportions. [Skill 1.F]

  • VAR-6.H.1 For a two-sample test for a difference of two proportions, the null hypothesis specifies a value of $0$ for the difference in population proportions, indicating no difference or effect.
  • VAR-6.H.2 The null hypothesis for a difference in proportions is: $H_0 : p_1 = p_2$, or $H_0 : p_1 - p_2 = 0$.
  • VAR-6.H.3 A one-sided alternative hypothesis for a difference in proportions is $H_a : p_1 < p_2$, or, $H_a : p_1 > p_2$. A two-sided alternative hypothesis for a difference of proportions is $H_a : p_1 \neq p_2$.

VAR-6.I
Identify an appropriate testing method for the difference of two population proportions. [Skill 1.E]

  • VAR-6.I.1 For a single categorical variable, the appropriate testing method for the difference of two population proportions is a two-sample $z$-test for a difference between two population proportions.

VAR-6.J
Verify the conditions for making statistical inferences when testing a difference of two population proportions. [Skill 4.C]

  • VAR-6.J.1 In order to make statistical inferences when testing a difference between population proportions, we must check for independence and that the sampling distribution is approximately normal:
    • a. To check for independence:
      • i. Data should be collected using two independent, random samples or a randomized experiment.
      • ii. When sampling without replacement, check that $n_1 \leq 10\%N_1$ and $n_2 \leq 10\%N_2$.
    • b. To check that the sampling distribution of $\hat{p}_1 - \hat{p}_2$ is approximately normal (shape):
      • i. For the combined sample, define the combined (or pooled) proportion, $\hat{p}_c = \dfrac{n_1\hat{p}_1 + n_2\hat{p}_2}{n_1 + n_2}$. Assuming that $H_0$ is true $(p_1 - p_2 = 0$ or $p_1 = p_2)$, check that $n_1\hat{p}_c$, $n_1\left(1-\hat{p}_c\right)$, $n_2\hat{p}_c$, and $n_2\left(1-\hat{p}_c\right)$ are all greater than or equal to some predetermined value, typically either 5 or 10.

Source: College Board AP Course and Exam Description

Hypotheses compare the two proportions: $H_0: p_1=p_2$ versus $H_a: p_1\neq p_2$ (or $<,>$). Because $H_0$ says the proportions are equal, use a combined (pooled) 合并 sample proportion $\hat p_c=\dfrac{\text{total successes}}{\text{total sample size}}$ to estimate the common $p$.

Vocabulary Train
English
combined (pooled)/kəmˈbaɪnd/
6.11

Carrying Out a Test for a Difference

Syllabus
Enduring UnderstandingLearning ObjectiveEssential Knowledge

VAR-6
The normal distribution may be used to model variation.

VAR-6.K
Calculate an appropriate test statistic for the difference of two population proportions. [Skill 3.E]

  • VAR-6.K.1 The test statistic for a difference in proportions is: $z = \dfrac{(\hat{p}_1 - \hat{p}_2) - 0}{\sqrt{\hat{p}_c(1-\hat{p}_c)}\sqrt{\dfrac{1}{n_1} + \dfrac{1}{n_2}}}$, where $\hat{p}_c = \dfrac{n_1\hat{p}_1 + n_2\hat{p}_2}{n_1 + n_2}$.
    • Clarifying statement: The formulas for test statistics do not appear explicitly on the AP Statistics Formula Sheet provided with the AP Statistics Exam. However, these formulas do not need to be memorized, as they can be constructed based on the general test statistic formula and the standard error formulas for each of the relevant test statistics that are provided on the formula sheet.

DAT-3
Significance testing allows us to make decisions about hypotheses within a particular context.

DAT-3.C
Interpret the $p$-value of a significance test for a difference of population proportions. [Skill 4.B]

  • DAT-3.C.1 An interpretation of the $p$-value of a significance test for a difference of two population proportions should recognize that the $p$-value is computed by assuming that the null hypothesis is true, i.e., by assuming that the true population proportions are equal to each other.

DAT-3.D
Justify a claim about the population based on the results of a significance test for a difference of population proportions. [Skill 4.E]

  • DAT-3.D.1 A formal decision explicitly compares the $p$-value to the significance $\alpha$. If the $p\text{-value} \leq \alpha$, then reject the null hypothesis, $H_0 : p_1 = p_2$, or $H_0 : p_1 - p_2 = 0$. If the $p$-value $> \alpha$, then fail to reject the null hypothesis.
  • DAT-3.D.2 The results of a significance test for a difference of two population proportions can serve as the statistical reasoning to support the answer to a research question about the two populations that were sampled.

Source: College Board AP Course and Exam Description

The pooled two-proportion $z$ statistic:

$$z=\frac{\hat p_1-\hat p_2}{\sqrt{\hat p_c(1-\hat p_c)\left(\frac{1}{n_1}+\frac{1}{n_2}\right)}}.$$
Find the $p$-value from the normal model, compare to $\alpha$, and conclude in context – the same four-step logic as the one-proportion test.

Worked example: a two-proportion test. Two teaching methods are compared with random samples of students. Method 1: 45 of 75 pass. Method 2: 32 of 80 pass. Is there convincing evidence, at $\alpha=0.05$, of a difference in pass rates?

  • State. $H_0:p_1=p_2$ and $H_a:p_1\neq p_2$, where $p_1,p_2$ are the true pass rates under each method.
  • Plan. Two-sample $z$-test for a difference of proportions. Independent random samples; each is less than 10% of its population; the counts $45,\ 30,\ 32,\ 48$ are all at least 10.
  • Do. $\hat p_1=0.60$, $\hat p_2=0.40$, pooled $\hat p_c=\dfrac{77}{155}=0.497$.
    $$z=\frac{0.60-0.40}{\sqrt{0.497(0.503)\left(\frac{1}{75}+\frac{1}{80}\right)}}=\frac{0.20}{0.0804}=2.49,\qquad p\approx0.013.$$
  • Conclude. Because $0.013<0.05$, reject $H_0$. There is convincing evidence that the true pass rates under the two methods differ; method 1's is higher.
6.11

Practice

Answer each before reading the answers below.

  1. In a random sample of 160 students, 64 walk to school. Construct a $95\%$ confidence interval for the true proportion who walk.

  2. How large a sample gives a $95\%$ margin of error of at most $0.04$, with no prior estimate of $p$?

  3. A coin is tossed 400 times and lands heads 220 times. Test $H_0:p=0.5$ against $H_a:p\neq0.5$.

  4. Which is the correct meaning of “$95\%$ confident” for the interval in question 1? (a) $95\%$ of students walk between $32\%$ and $48\%$ of the time. (b) The method used captures the true proportion in about $95\%$ of samples.

  5. A student says: “My interval $(0.532,\ 0.668)$ has a $95\%$ chance of containing $p$.” Correct the student.

  6. A $95\%$ interval for the proportion of a school's students who read daily is $(0.31,\ 0.43)$. The principal claims that $40\%$ read daily. Does the interval give convincing evidence against the claim? Does it prove the claim?

  7. In a test of $H_0:p=0.30$, describe a Type II error in context if $p$ is the proportion of a company's employees who work from home.

  8. How would increasing the sample size from $100$ to $400$ change the power of the test in the power figure? Explain.

6.11

Answers

  1. $\hat p=0.40$, $SE=\sqrt{0.40(0.60)/160}=0.0387$, so $0.40\pm1.96(0.0387)=0.40\pm0.076$, giving $(0.324,\ 0.476)$.

  2. $n=\dfrac{1.96^2(0.5)(0.5)}{0.04^2}=600.25$, so survey 601 people.

  3. $\hat p=0.55$, $z=\dfrac{0.55-0.50}{\sqrt{0.25/400}}=\dfrac{0.05}{0.025}=2.0$, two-sided $p\approx0.046$. At $\alpha=0.05$, reject $H_0$: convincing evidence that the coin is not fair.

  4. (b). The confidence level describes the method's long-run success rate.

  5. Once computed, the interval either contains $p$ or it does not. The $95\%$ describes the method: about $95\%$ of intervals made this way capture $p$. Say “we are $95\%$ confident”, not “a $95\%$ probability”.

  6. No: $0.40$ is inside the interval, so it is plausible. But the interval does not prove $p=0.40$, because values such as $0.35$ are plausible too.

  7. A Type II error would be failing to find convincing evidence that the proportion who work from home differs from $0.30$ when it really does differ.

  8. The power would increase. With $n=400$ the standard deviation of $\hat p$ halves, so the null and true sampling distributions overlap less, and a true value of $0.60$ is much more likely to give a $\hat p$ beyond the cut-off.

6.11

Exam tips

  • State the conditions (random, 10%, large counts $np,\,nq\ge10$) before any proportion inference.
  • A confidence interval = estimate $\pm$ margin of error; “95% confident” refers to the method's long-run capture rate.
  • For a test, write $H_0$ and $H_a$, compute the test statistic, find the p-value, and compare to $\alpha$.
  • A small p-value is evidence against $H_0$; failing to reject does not prove $H_0$.
  • Larger samples shrink the margin of error; a higher confidence level widens it.
  • A claimed value inside the interval is plausible, not proven; a value outside it is evidence against the claim.
  • Interpret a $p$-value with all three parts: "assuming $H_0$ is true", the probability, and "a result at least as extreme as the one observed", in context.

Interactive lessons on this topic

Work through it step by step, with instant-check exercises.

Past Papers

More topics in AP Statistics

Log in or create account

IGCSE, A-Level & AP