| Enduring Understanding | Learning Objective | Essential Knowledge |
|---|---|---|
VAR-1 | VAR-1.E |
|
Collecting Data
AP Statistics · Topic 3
 7:31
Collecting Data
An online poll collects thirty thousand replies. A careful survey asks only one thousand people. Which is closer to the truth? The small one, almost every…
English narration · English + 中文 subtitles burned in
3.1
Can We Trust the Data We Collected?
Syllabus
Source: College Board AP Course and Exam Description
A website asks visitors "Do you like this website?" and 92% click Yes. A survey at a gym finds that most people exercise daily. Both numbers are real, and both are nearly useless, because of who was asked. This unit is about the decisions made before any data exist, which decide what the data can ever tell you.
A conclusion is only as good as the data behind it. How data are collected decides what you may conclude – whether you can generalize to a population 总体, and whether you can claim cause and effect. Poorly collected data can be worse than none.
Vocabulary
Train
| English |
|---|
| population/ˌpɒpjʊˈleɪʃn/ |
3.2
Observational Studies and Experiments
Syllabus
| Enduring Understanding | Learning Objective | Essential Knowledge |
|---|---|---|
DAT-2 | DAT-2.A |
|
DAT-2.B |
|
Source: College Board AP Course and Exam Description
- In an observational study 观察性研究 you measure individuals without trying to influence them. It can show association, but not causation, because lurking variables may explain the link.
- In an experiment 实验 you deliberately impose a treatment 处理 and compare responses. A well-designed experiment can establish cause and effect.
An observational study can look back at data that already exist (retrospective, such as old medical records) or follow a group forward in time and collect data as things happen (prospective). Either way, nothing is imposed, so neither kind can show causation. Results can be generalized only to the population the sample was randomly chosen from: a random sample of one school's students says nothing about students at other schools.
Worked example (observational or experiment?). An article reports that adults who sleep at least $7$ hours a night have lower blood pressure. The researchers asked people how much they sleep and measured their blood pressure. The explanatory variable is hours of sleep; the response is blood pressure. It is an observational study: no one was told how much to sleep. Exercise status could be a confounding variable 混杂变量: people who exercise regularly may tend to sleep longer, and exercise lowers blood pressure, so the study cannot tell whether sleep or exercise causes the lower readings. A full answer always gives both links: to the explanatory variable and to the response.
Explore
Observational study or experiment?
In an experiment the researcher imposes a treatment (and can show cause); an observational study only records what already happens (and can show association, not cause).
Vocabulary
Train
| English |
|---|
| observational study/ɒbzəˈveɪʃənl ˈstʌdi/ |
| experiment/ekˈsperɪmənt/ |
| treatment/ˈtriːtmənt/ |
| confounding variable/kənˈfaʊndɪŋ ˈveərɪəbl/ |
3.3
Random Sampling

Syllabus
| Enduring Understanding | Learning Objective | Essential Knowledge |
|---|---|---|
DAT-2 | DAT-2.C |
|
DAT-2.D |
|
Source: College Board AP Course and Exam Description
To learn about a population you take a sample 样本. Random sampling 随机抽样 protects against selection bias 偏差 and lets you generalize (it cannot fix undercoverage, nonresponse, or response bias — see below). Common designs:
- Simple random sample (SRS) 简单随机样本: every group of the chosen size is equally likely.
- Stratified 分层: split the population into similar strata, then sample within each.
- Cluster 整群: split into clusters, randomly choose whole clusters.
- Systematic 系统: pick every $k$th individual from a random start.
A census 普查 measures every individual in the population, which is usually too slow or expensive. Most samples are drawn without replacement (no one can be chosen twice); drawing with replacement puts each chosen individual back, so it can be picked again.
Strengths and weaknesses. A stratified sample gives more precise estimates than an SRS of the same size when the strata really differ in the response (for example, juniors and seniors answer differently), and it guarantees every stratum is represented. A cluster sample is cheaper and quicker (survey whole classrooms or whole streets), but if the clusters differ from one another, the estimate is less precise. A systematic sample is easy to carry out, but it fails if the list has a repeating pattern. If a factory's two machines alternate on a conveyor belt, "every $10$th tortilla" always comes from the same machine, so the sample does not represent the day's production.
A convenience sample 方便样本 or voluntary response sample is not random and is biased.
Worked example. To survey a school, an administrator lists all students by grade and randomly selects $20$ from each grade. This is a stratified sample – the grades are the strata – which guarantees every grade is represented, unlike an SRS that might by chance draw few from one grade.
Common mistakes. Mixing up stratified and cluster samples. Stratified: split into groups of similar individuals and take a random sample from every group. Cluster: split into groups that each look like the whole population, randomly choose some groups, and survey everyone in them. Also, calling a sample random when it is only convenient (“the first $50$ students in the canteen”).
Vocabulary
Train
| English |
|---|
| sample/ˈsæmpl/ |
| Random sampling/ˈrændəm ˈsæmplɪŋ/ |
| bias/ˈbaɪəs/ |
| Simple random sample (SRS)/ˈsɪmpl ˈrændəm ˈsæmpl/ |
| Stratified/ˈstrætɪfaɪd/ |
| Cluster/ˈklʌstə/ |
| Systematic/ˌsɪstəˈmætɪk/ |
| census/ˈsensəs/ |
| convenience sample/kənˈviːnɪəns ˈsæmpl/ |
3.4
When Sampling Goes Wrong
Syllabus
| Enduring Understanding | Learning Objective | Essential Knowledge |
|---|---|---|
DAT-2 | DAT-2.E |
|
Source: College Board AP Course and Exam Description
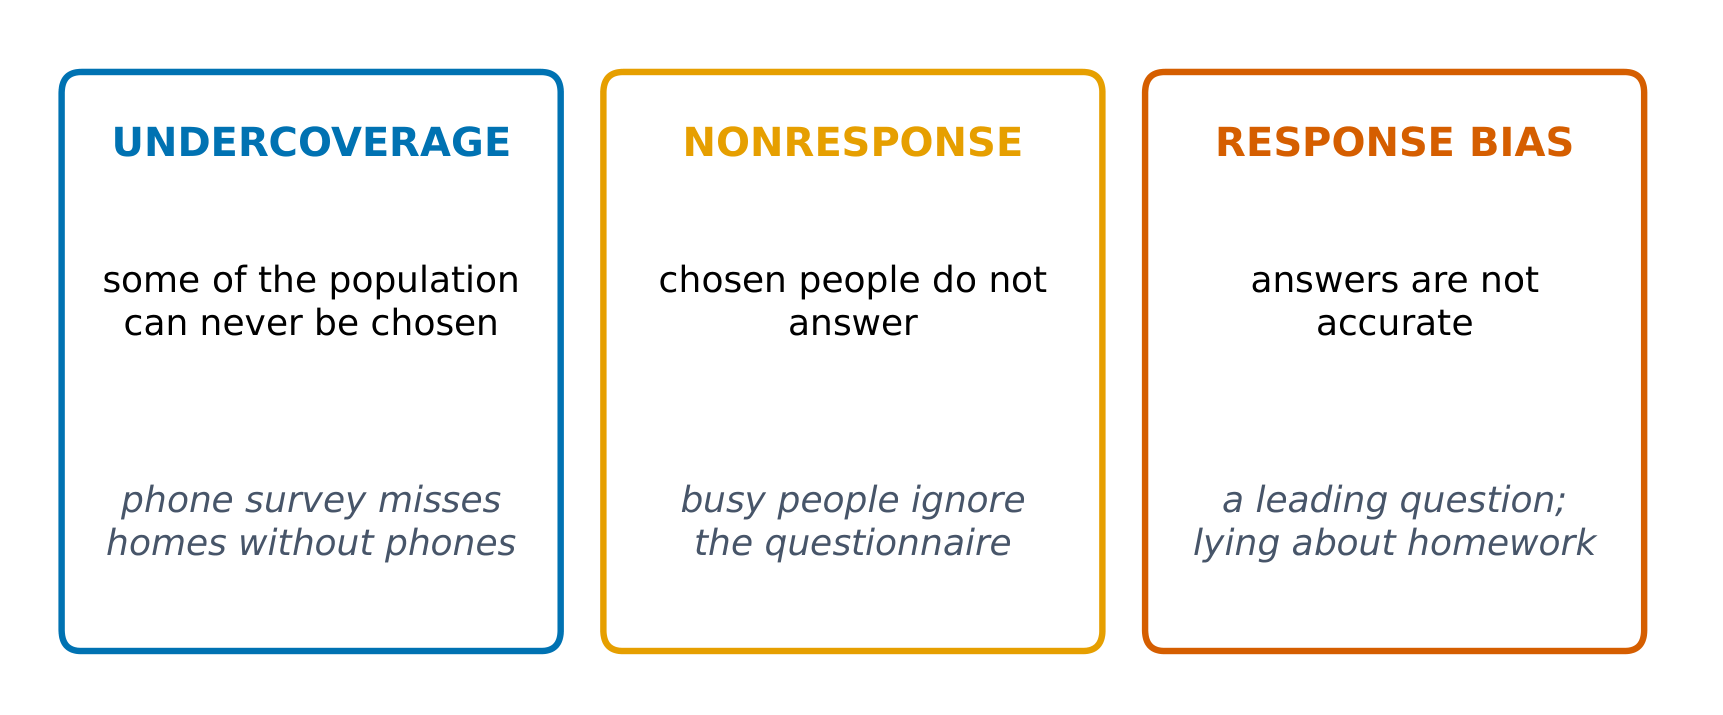
Bias makes estimates systematically miss the truth:
- Undercoverage 覆盖不足: some groups are left out of the sampling frame.
- Nonresponse 无回应: selected people do not answer.
- Response bias 回应偏差: people answer inaccurately (bad wording, sensitive topics).
Response bias has two common forms. Question wording bias 问题措辞偏差 comes from confusing or leading questions ("Don't you agree that the unfair new dress code should be dropped?"). Self-reporting is unreliable when people forget or want to look good: asked how many miles they walk, people tend to overstate it, so an activity tracker gives more accurate data than a journal.
Worked example (bias and its direction). An environmental science teacher asks only the students in her own classes whether the school should install solar panels. Her students have studied renewable energy and may be more likely to say yes than the school as a whole. The sample proportion who answer yes will probably overestimate the true proportion for all students.
Bias is about a consistent error in one direction – increasing the sample size does not fix it.
Common mistakes. Saying a larger sample reduces bias: it reduces variability only. Naming a bias without saying, in context, which way it pushes the estimate (too high or too low) and why.
Vocabulary
Train
| English |
|---|
| Undercoverage/ˌʌndəˈkʌvərɪdʒ/ |
| Nonresponse/ˌnɒnrɪˈspɒns/ |
| Response bias/rɪˈspɒns ˈbaɪəs/ |
| question wording bias/ˈkwestʃn ˈwɜːdɪŋ ˈbaɪəs/ |
3.5
Designing an Experiment

Syllabus
| Enduring Understanding | Learning Objective | Essential Knowledge |
|---|---|---|
VAR-3 | VAR-3.A |
|
VAR-3.B |
| |
VAR-3.C |
|
Source: College Board AP Course and Exam Description
Good experiments follow three principles:
- Comparison with a control group 对照组 (often a placebo 安慰剂).
- Random assignment 随机分配 of subjects to treatments, to balance out other variables.
- Replication 重复: enough subjects per treatment to see a real effect.
The vocabulary. The experimental units 实验单元 are the individuals that receive treatments (called subjects or participants when they are people). The explanatory variable in an experiment is a factor 因子, and its values are levels; each level or combination of levels is a treatment. The response variable is what is measured afterwards.
Worked example. A gardener tests three fertilisers on $30$ tomato plants and measures each plant's mass of fruit. Treatments: the three fertilisers. Experimental units: the $30$ plants. Response: mass of fruit. With two factors, such as fertiliser (3 levels) and watering (2 levels), there are $3\times2=6$ treatments.
Is there a control group? A control group gets no active treatment, or a placebo that looks like the real treatment, so that the treatment effect can be separated from everything else. The placebo effect is a real response to an inactive treatment, caused by expecting to improve. An experiment comparing two new drugs has no control group, but it can still compare the two drugs with each other.
Confounding 混杂 occurs when another variable is tied to the treatment so their effects cannot be separated; random assignment guards against it. Blinding 盲法 hides who is getting which treatment to prevent expectation effects: in a single-blind 单盲 study only one side is kept unaware (usually the subjects, or only the people assessing the result), while in a double-blind 双盲 study neither the subjects nor the researchers who interact with them know, blocking both the placebo effect and biased assessment. Blocking 区组 groups similar subjects and randomizes within each block to reduce variability.
Worked example: describing random assignment. Forty volunteers will test two study apps, A and B, 20 per app. A full-credit description names the method precisely enough that someone else could carry it out:
Number the volunteers 1 to 40. Use a random number generator to choose integers from 1 to 40, ignoring repeats, until 20 different numbers are chosen. Those 20 volunteers use app A; the remaining 20 use app B.
"Randomly put them into two groups" earns nothing: it does not say how. Drawing names from a hat also works, if you say the slips are the same size and well mixed.
Vocabulary
Train
| English |
|---|
| control group/kənˈtrəʊl ɡruːp/ |
| placebo/pləˈsiːbəʊ/ |
| Random assignment/ˈrændəm əˈsaɪnmənt/ |
| Replication/ˌreplɪˈkeɪʃn/ |
| experimental units/ekˌsperɪˈmentl ˈjuːnɪts/ |
| factor/ˈfæktə/ |
| Confounding/kənˈfaʊndɪŋ/ |
| Blinding/ˈblaɪndɪŋ/ |
| single-blind/ˈsɪŋɡl blaɪnd/ |
| double-blind/ˈdʌbl blaɪnd/ |
| Blocking/ˈblɒkɪŋ/ |
3.6
Choosing the Right Design
Syllabus
| Enduring Understanding | Learning Objective | Essential Knowledge |
|---|---|---|
VAR-3 | VAR-3.D |
|
Source: College Board AP Course and Exam Description
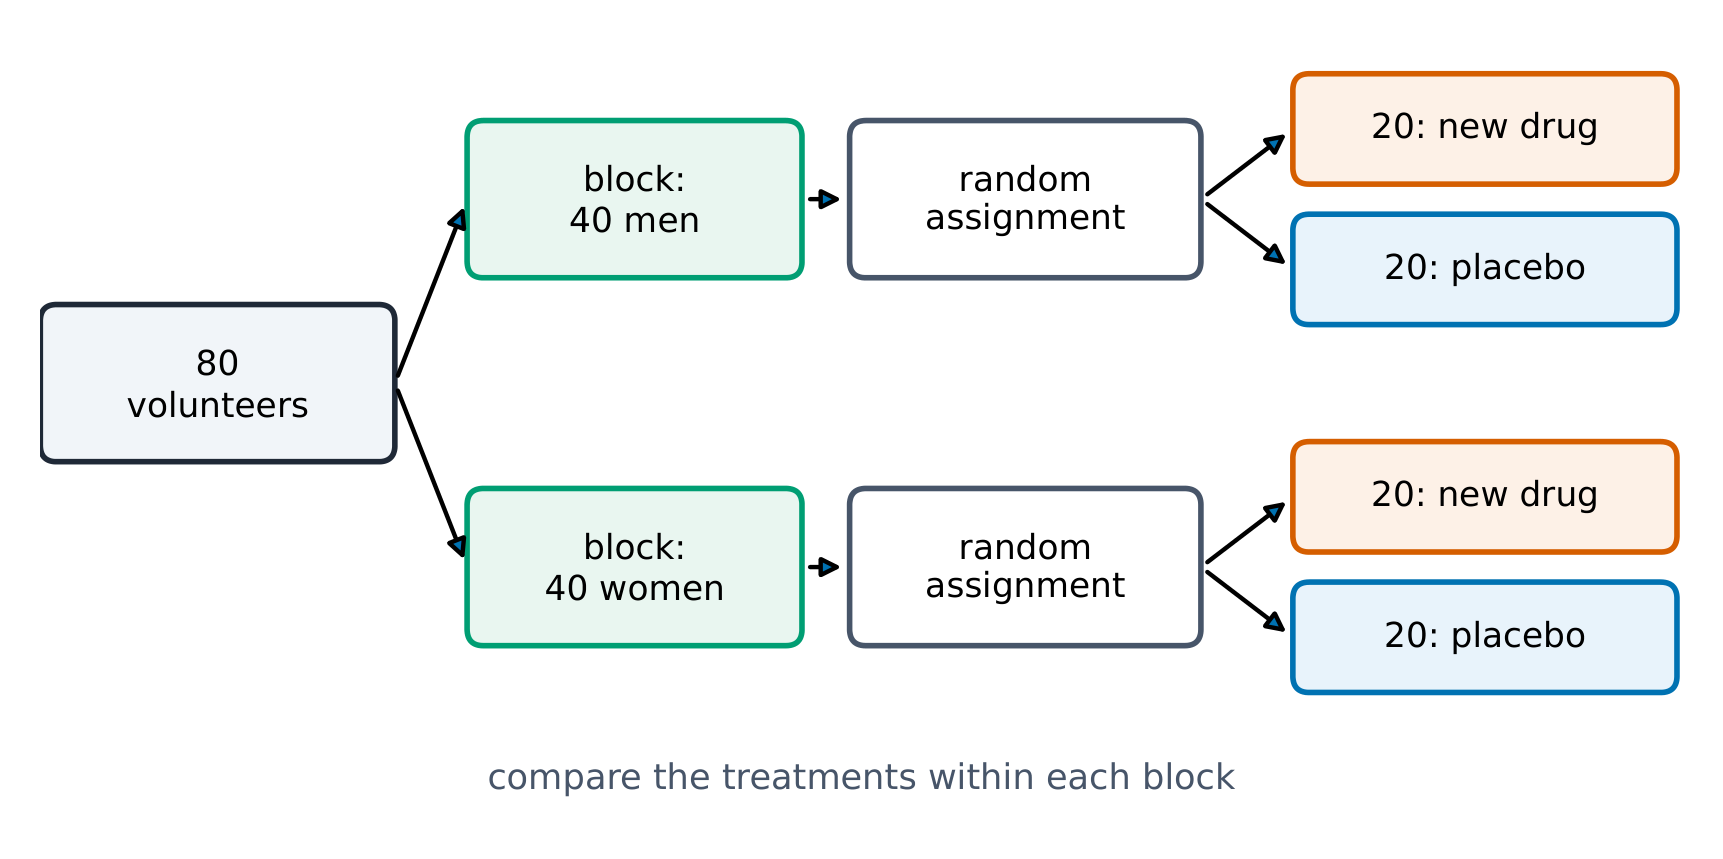
Match the design to the goal: use a completely randomized design for uniform subjects; a randomized block design when a known variable (sex, age) affects the response; a matched-pairs design when each subject can serve as its own control. State how you would carry out the randomization.
Worked example: blocking. The study-app volunteers are 24 Grade 10 and 16 Grade 11 students, and grade level surely affects test scores. A randomized block design 随机区组设计 separates the two grades first. Within each grade, randomly assign half to app A and half to app B: 12 and 12 in Grade 10, 8 and 8 in Grade 11. Then compare the apps within each grade. Grade differences can no longer hide, or exaggerate, the effect of the app.
Worked example (matched pairs with twins). A dermatologist tests two acne creams on $10$ pairs of twins. Each twin's acne is similar to the other twin's, but severity differs a lot between pairs. In a matched-pairs design 配对设计, for each pair, flip a coin: heads, the first-listed twin gets cream A and the other gets cream B; tails, the reverse. Then compare the two twins in each pair. Because twins start alike, a difference within a pair is mainly due to the cream, not to how severe the acne was to begin with. A single person can also be their own pair: each subject uses both treatments, in a random order.
Vocabulary
Train
| English |
|---|
| randomized block design/ˈrændəmaɪzd blɒk dɪˈzaɪn/ |
| matched-pairs design/mætʃt peəz dɪˈzaɪn/ |
3.7
What an Experiment Lets You Conclude
Syllabus
| Enduring Understanding | Learning Objective | Essential Knowledge |
|---|---|---|
VAR-3 | VAR-3.E |
|
Source: College Board AP Course and Exam Description
Two questions decide the scope of a conclusion:
- Random assignment used? Then a significant difference can be attributed to the treatment (causation) – for these subjects.
- Random sampling from a population? Then results generalize to that population.
Only an experiment with random assignment supports a cause-and-effect claim; only random sampling supports generalization. Say exactly which you have.
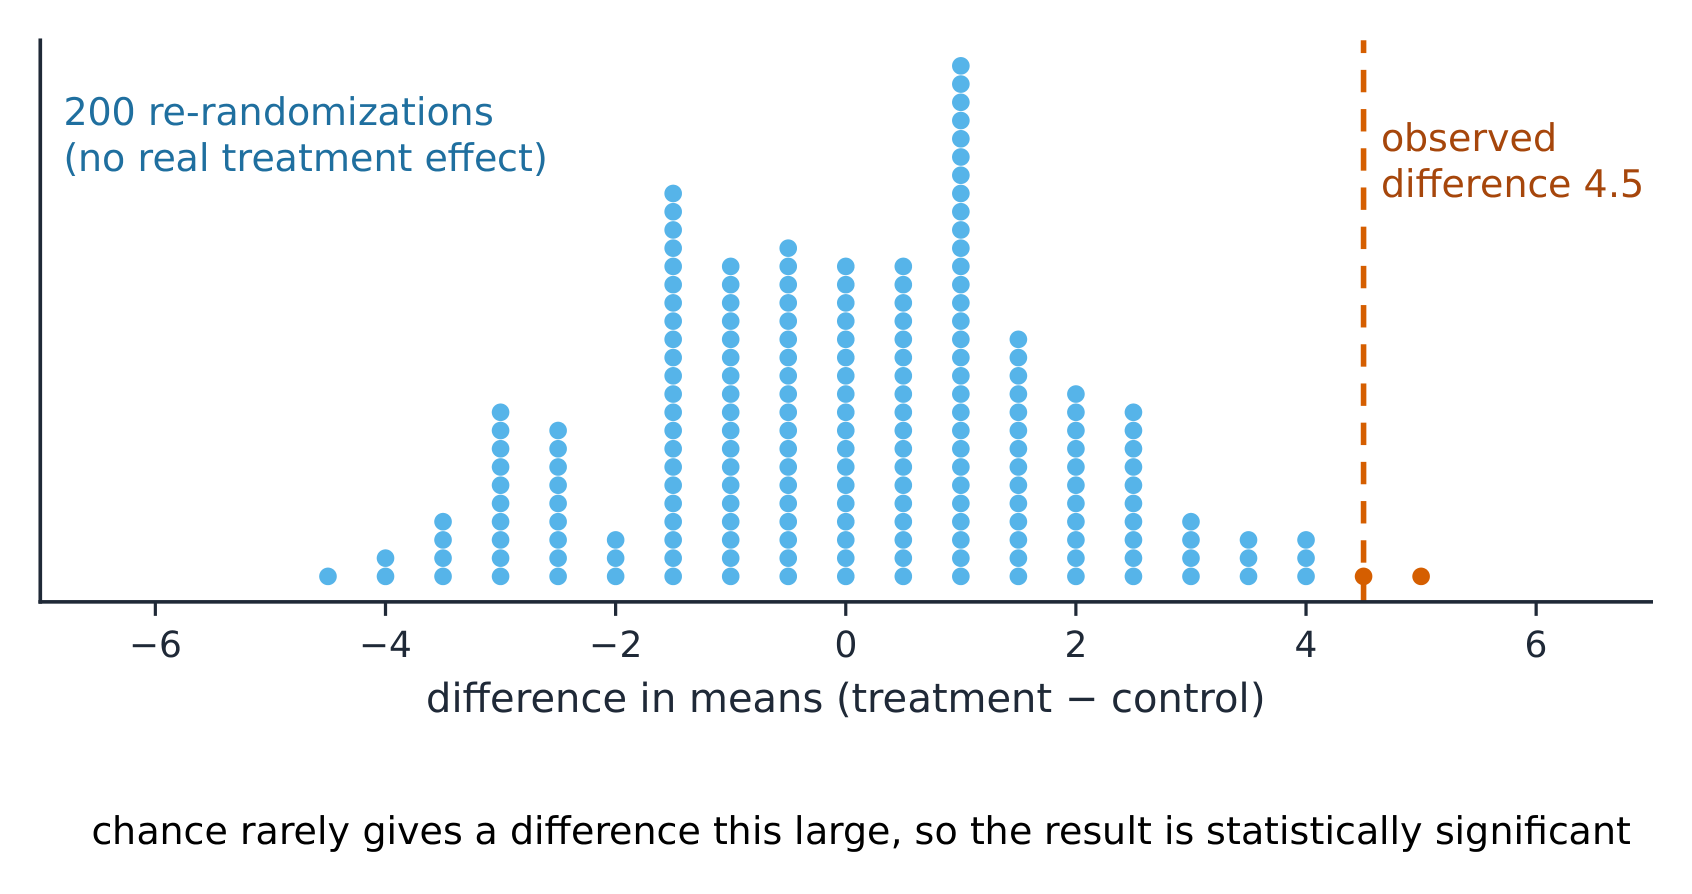
Statistically significant 统计显著 means the difference between the treatment groups is too large to be explained easily by the chance variation of random assignment alone. In a well-designed experiment, a statistically significant difference is evidence that the treatments caused the difference.
Worked example. Researchers randomly assign $100$ volunteers to a new drug or a placebo, and the drug group improves significantly more. Because of the random assignment, the improvement can be attributed to the drug (causation) – but because the subjects were not randomly sampled, the conclusion applies only to these volunteers and does not automatically generalize to everyone.
Vocabulary
Train
| English |
|---|
| statistically significant/stəˈtɪstɪkli sɪɡˈnɪfɪkənt/ |
3.7
The scope of a conclusion
| Random assignment | No random assignment | |
|---|---|---|
| Random sampling | cause and effect, for the whole population | association only, for the whole population |
| No random sampling | cause and effect, for these subjects only | association only, for these subjects only |
Read the design once for each question: was the sample chosen at random (generalize?), and were the treatments assigned at random (causation?).
Common mistakes. Claiming cause and effect from an observational study; generalizing an experiment on volunteers to a whole population; and confusing random sampling (who is in the study) with random assignment (who gets which treatment).
3.7
Practice
Answer each before reading the answers below.
-
A teacher surveys the first 30 students to arrive at school. Name the sampling method and one likely bias.
-
A school has 900 students in 30 homerooms. The principal randomly selects 3 homerooms and surveys every student in them. Name the design.
-
Describe how to randomly assign 30 tomato plants to two fertilisers, 15 each.
-
A study finds that people who drink more coffee live longer, from medical records. Can it conclude that coffee causes longer life? Explain.
-
A student says: "A sample of 10,000 people from a voluntary online poll is better than a random sample of 1,000." Correct the student.
-
A study records whether $500$ adults walk daily and their cholesterol level over five years. Is it an experiment? What could be a confounding variable, and why?
-
A researcher wants to estimate the mean height of students in a school with very different grade levels (Grades 7 to 12). Suggest a sampling method and explain why it is better than an SRS of the same size.
3.7
Answers
-
A convenience sample. Early arrivers may differ systematically, for example by living closer or by being more organised, so the results may be biased.
-
A cluster sample: the homerooms are clusters, and every member of each chosen cluster is surveyed.
-
Number the plants 1 to 30. Use a random number generator to choose 15 different numbers from 1 to 30; those plants get fertiliser A and the other 15 get fertiliser B.
-
No. This is an observational study. Coffee drinkers may differ in other ways, such as income or health, which could explain the longer lives. Only random assignment of coffee could support causation.
-
A voluntary response sample is biased: people with strong opinions are more likely to respond. A larger biased sample is still biased; it only makes the wrong answer look more precise. The random sample of 1,000 is better.
-
No, it is an observational study: nobody was assigned to walk. Diet could confound: adults who walk daily may also eat more healthily, and diet affects cholesterol, so the effect of walking cannot be separated from the effect of diet.
-
A stratified random sample by grade. Heights differ a lot between grades, so sampling within each grade (and combining) gives a more precise estimate than an SRS, which might by chance contain too many students from one grade.
3.7
Exam tips
- Distinguish an observational study (finds association) from an experiment (can show causation).
- Good sampling is random (SRS, stratified, cluster) — beware bias (voluntary response, undercoverage, nonresponse).
- Good experiments use control, randomization, and replication; blocking handles a known nuisance variable.
- Only a randomized experiment supports a cause-and-effect conclusion.
- Name the population, sample, and any confounding clearly.
- To explain confounding, link the variable to both the explanatory variable and the response, in context.
- Describe randomization so precisely that someone else could carry it out: label, random method, what to do with repeats, who gets which treatment.
Interactive lessons on this topic
Work through it step by step, with instant-check exercises.