| Enduring Understanding | Learning Objective | Essential Knowledge |
|---|---|---|
ERT-3 | ERT-3.A |
|
Populations
AP Environmental Science · Topic 3
 7:45
Populations
In 1944, twenty-nine reindeer were released onto a small island. There were no predators, and the ground was thick with moss. Within twenty years there were…
English narration · English + 中文 subtitles burned in
3.1
Generalist and Specialist Species

Syllabus
Source: College Board AP Course and Exam Description
In 1944 the US Coast Guard released 29 reindeer on St. Matthew Island in the Bering Sea. With rich lichen to eat and no predators, they reached about 6000 by 1963. They ate the lichen faster than it could grow back; in one hard winter almost all of them starved, and by 1966 only 42 were left. This unit asks why populations grow, what stops them, and what that means for the eight billion people on Earth.
Every species has a niche 生态位: the range of conditions and resources it can use and its role in the ecosystem.
A generalist 广适性物种 has a broad niche: it can live in many habitats 栖息地 and eat many foods. Examples are raccoons, rats, cockroaches and crows. A specialist 狭适性物种 has a narrow niche: it needs a particular food or habitat. Examples are the giant panda (bamboo), the koala (eucalyptus leaves) and many tropical frogs.
- In a stable habitat, specialists have the advantage: they use their resource very efficiently and face less competition for it.
- In a changing habitat, generalists have the advantage: if one food or habitat disappears, they switch to another.
So specialists are more vulnerable 脆弱的 to habitat loss, habitat fragmentation, climate change and invasive species. Generalists often become pests or invasive species themselves.
Explore
Generalist or specialist?
Sort each species by whether it uses a wide range of resources (generalist) or a narrow one (specialist).
Vocabulary
Train
| English |
|---|
| niche/niːʃ/ |
| generalist/ˈdʒenərəlɪst/ |
| habitats/ˈhæbɪtæts/ |
| specialist/ˈspeʃəlɪst/ |
| vulnerable |
3.2
K-Selected and r-Selected Species
Syllabus
| Enduring Understanding | Learning Objective | Essential Knowledge |
|---|---|---|
ERT-3 | ERT-3.B |
|
Source: College Board AP Course and Exam Description
Species have different reproductive strategies 繁殖对策:
| Feature | r-selected | K-selected |
|---|---|---|
| Body size | small | large |
| Number of offspring 后代 | many | few |
| Parental care | little or none | a lot |
| Age to mature 成熟 | early | late |
| Life span | short | long |
| Population | booms and crashes | stays near carrying capacity |
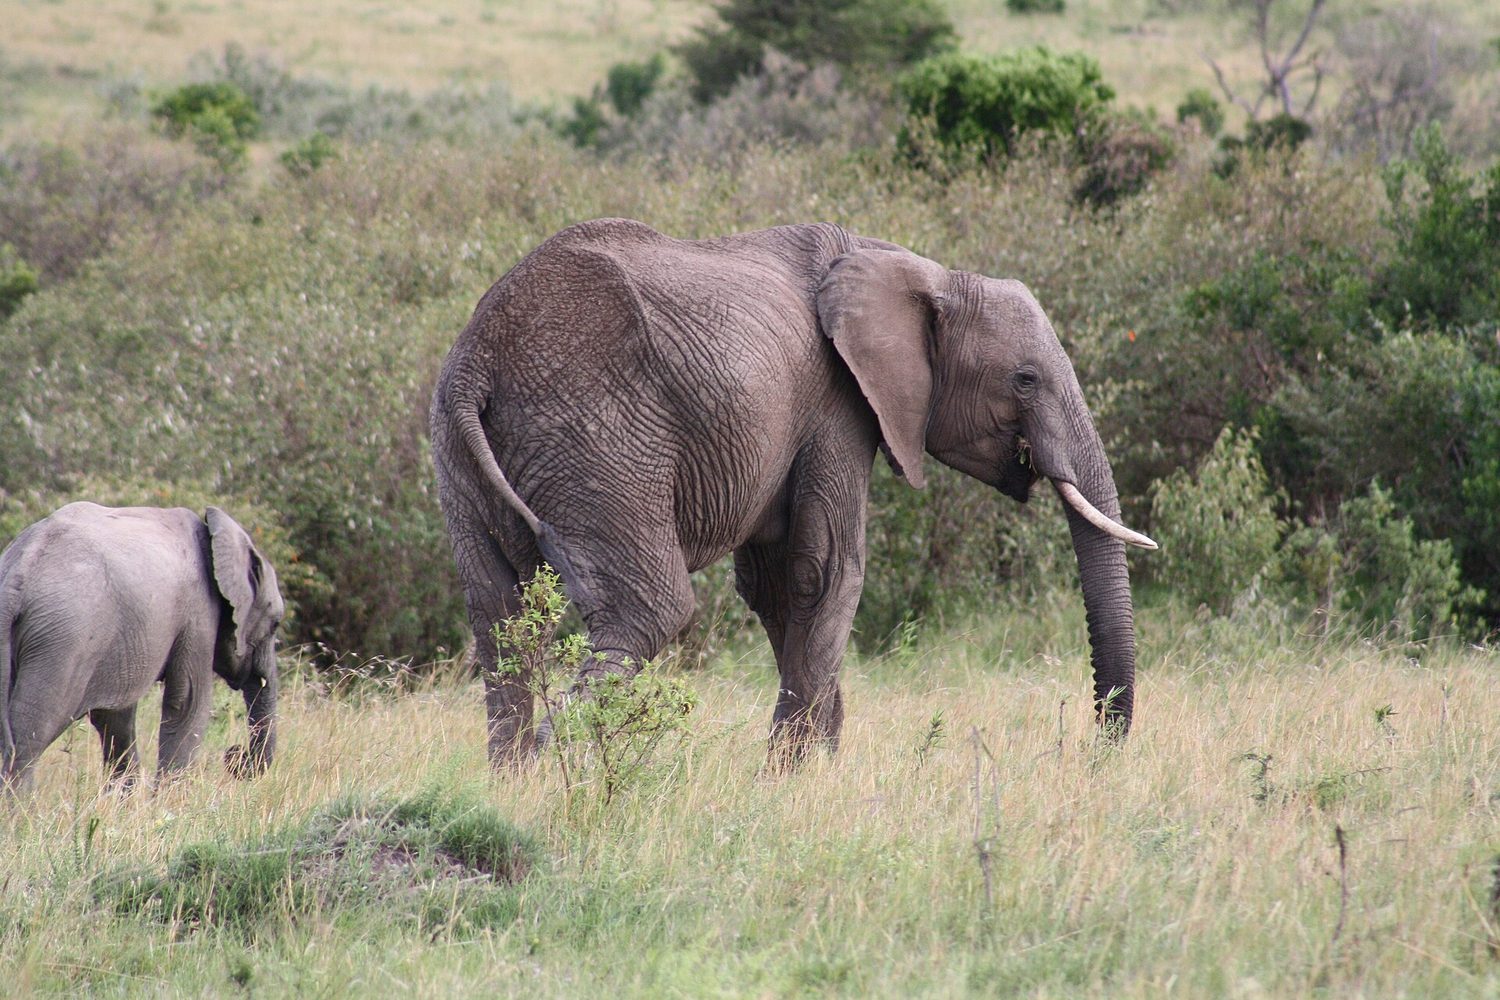
| Examples | insects, mice, weeds, most fish | elephants, whales, humans, oak trees |
Biotic potential 生物潜能 is the maximum rate at which a population can grow in ideal conditions. r-selected species have a high biotic potential, so they colonize 定殖 new or disturbed areas quickly. Most invasive species 入侵物种 are r-selected.
K-selected species are hurt more by disturbance and invasive species. Because they reproduce slowly, a population that falls (from hunting, habitat loss or disease) takes a long time to recover. This is why many endangered species are K-selected.
Many species are not purely one type. Sea turtles are large and long-lived (K) but lay hundreds of eggs with no care (r).

Explore
Many offspring or few?
Sort each species by its reproductive strategy - lots of offspring with little care (r), or few with heavy care (K).
Vocabulary
Train
| English |
|---|
| reproductive strategies |
| offspring/ˈɒfsprɪŋ/ |
| mature |
| biotic potential |
| colonize |
| invasive species/ɪnˈveɪsɪv ˈspiːsiːz/ |
3.3
Survivorship Curves

Syllabus
| Enduring Understanding | Learning Objective | Essential Knowledge |
|---|---|---|
ERT-3 | ERT-3.C |
|
Source: College Board AP Course and Exam Description
A survivorship curve 存活曲线 shows how many members of a cohort 同龄群 (a group born at the same time) are still alive at each age. The number of survivors is plotted on a log scale 对数刻度, so a constant death rate gives a straight line.
- Type I: most individuals survive to old age, then many die. The curve is flat and then drops steeply. Examples: humans, elephants, whales (K-selected).
- Type II: individuals die at a roughly constant rate at all ages, so the curve is a straight line. Examples: many birds, squirrels, some lizards.
- Type III: most individuals die very young; the few that survive live a long time. The curve drops steeply at first and then flattens. Examples: fish, insects, oysters, plants (r-selected).
K-selected species usually follow Type I or Type II curves; r-selected species usually follow Type III. To read a curve, look at when the steep drop happens: early (Type III), late (Type I) or steady (Type II).
Explore
Which survivorship type?
Sort each species by when in life most of its members die - late (I), steadily (II), or early (III).
Vocabulary
Train
| English |
|---|
| survivorship curve/səˈvaɪvəʃɪp kɜːv/ |
| cohort/ˈkəʊhɔːt/ |
| log scale |
3.4
Carrying Capacity

Syllabus
| Enduring Understanding | Learning Objective | Essential Knowledge |
|---|---|---|
ERT-3 | ERT-3.D |
|
ERT-3.E |
|
Source: College Board AP Course and Exam Description
The carrying capacity 环境容纳量 ($K$) is the largest population that an environment can support for a long time with its available food, water, space and other resources 资源.
A population can overshoot 超出 its carrying capacity for a short time, for example when resources were plentiful or because animals keep breeding before the shortage is felt. The extra individuals use resources faster than they are replaced, so the resource base is damaged (resource depletion). The result is dieback 种群骤减: a sharp, often catastrophic fall in population from famine, disease or conflict. After dieback the carrying capacity may be lower than before, because the habitat was damaged. The St. Matthew reindeer are a classic case.

Populations near $K$ tend to fluctuate 波动 around it. Predator and prey populations often rise and fall in cycles: more prey supports more predators, which then eat more prey, so prey numbers fall, followed by predator numbers.
Explore
Growth up to carrying capacity
A population grows toward the carrying capacity $K$ its resources can support, then levels off. Push the growth rate up and watch it overshoot and settle.
Vocabulary
Train
| English |
|---|
| carrying capacity/ˈkæriɪŋ kəˈpæsɪti/ |
| resources/rɪˈzɔːsɪz/ |
| overshoot/ˌəʊvəˈʃuːt/ |
| dieback |
| fluctuate/ˈflʌktʃueɪt/ |
3.5
Population Growth and Resource Availability
Syllabus
| Enduring Understanding | Learning Objective | Essential Knowledge |
|---|---|---|
ERT-3 | ERT-3.F |
|
Source: College Board AP Course and Exam Description
Population growth is limited by the environment, especially by available resources and space. The total resource base is finite at every scale, from a pond to the planet.
- When resources are abundant, a population grows faster and faster: exponential growth 指数增长, which makes a J-shaped curve.
- As the population gets bigger, resources per individual shrink. Competition increases, growth slows, and the population levels off at $K$: logistic growth 逻辑斯谛增长, which makes an S-shaped curve.
- When the resource base shrinks, resources are shared out more unequally. The result is more deaths, fewer births (lower fecundity 繁殖力), or both, so the population declines.
Limiting factors 限制因素 are the resources or conditions that keep a population from growing further. They are of two kinds:
| Density-dependent factors 密度制约因素 | Density-independent factors 非密度制约因素 |
|---|---|
| effect grows as the population gets denser | effect does not depend on population size |
| food, water and space; competition; predation; disease; clean air and water | storms, fires, floods, droughts, heat waves, cold snaps |
Worked example (area needed). A male wood thrush needs at least $800\ \text{m}^2$ of forest to breed. A planning goal is to keep 275 territories. The forest needed is $275 \times 800 = 220{,}000\ \text{m}^2$. If a housing plan has 1000 lots of $1100\ \text{m}^2$ each, the fraction of each lot that must stay forest is $\frac{220{,}000}{1000 \times 1100} \times 100 = 20\%$.
Explore
Exponential then logistic growth
J-curve, then S-curve at K
With unlimited resources growth is exponential (J); with limits it becomes logistic (S), leveling at K.
Vocabulary
Train
| English |
|---|
| exponential growth/ˌekspəˈnenʃl ɡrəʊθ/ |
| logistic growth/ləˈdʒɪstɪk ɡrəʊθ/ |
| fecundity |
| limiting factors/ˈlɪmɪtɪŋ ˈfæktəz/ |
| density-dependent factors |
| density-independent factors |
3.6
Age Structure Diagrams
Syllabus
| Enduring Understanding | Learning Objective | Essential Knowledge |
|---|---|---|
EIN-1 | EIN-1.A |
|
Source: College Board AP Course and Exam Description
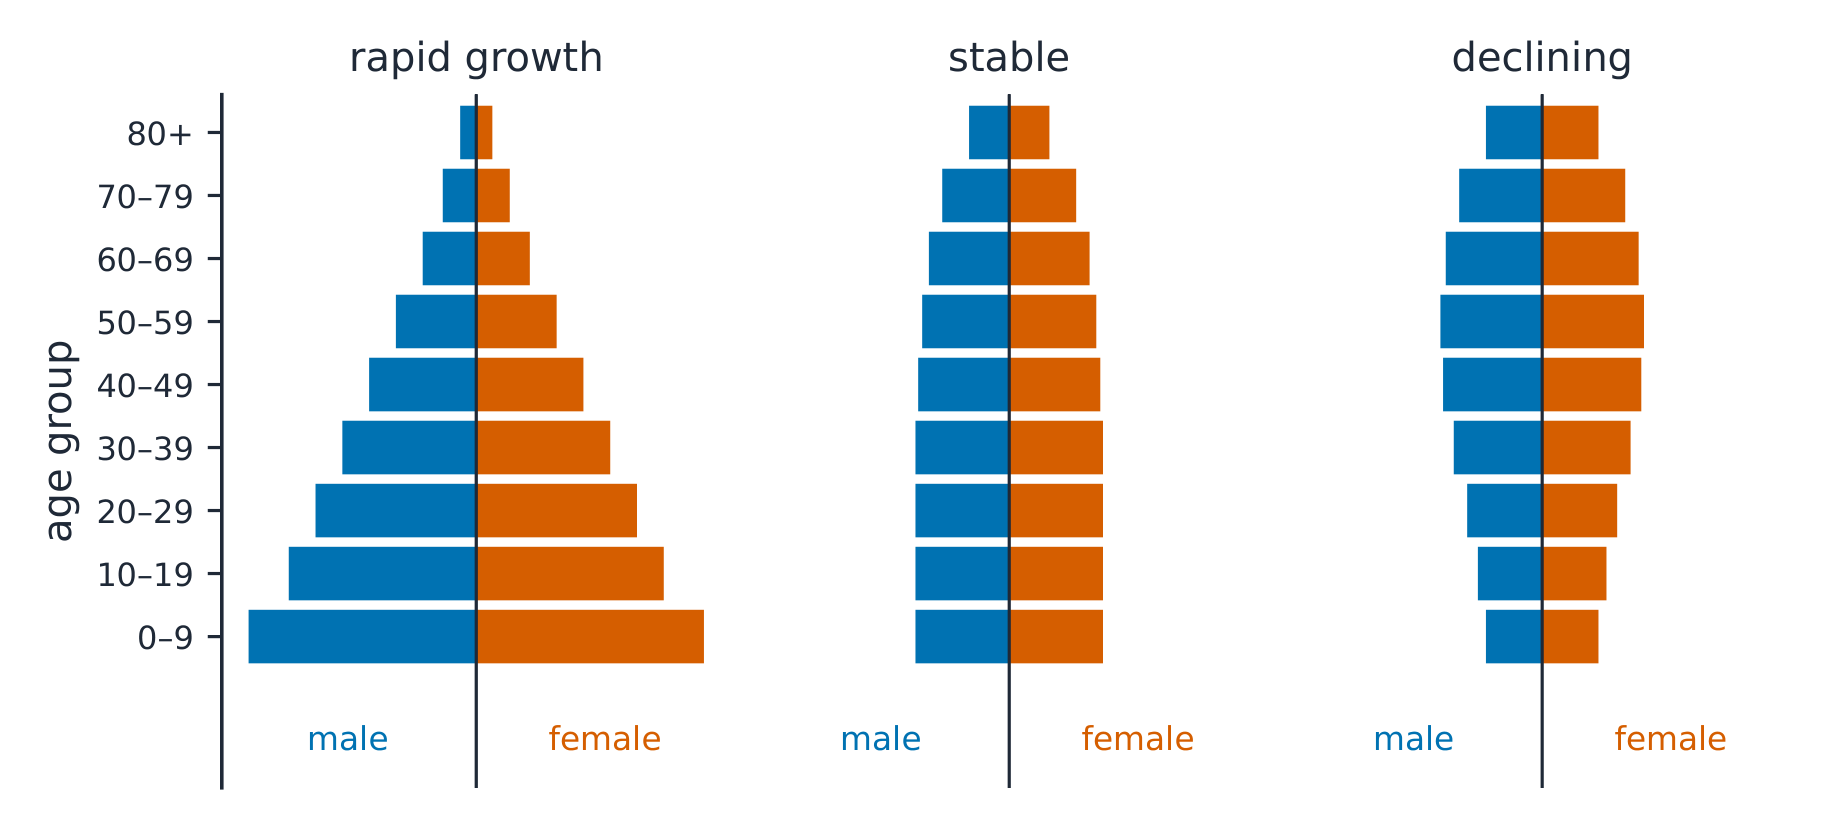
An age-structure diagram 年龄结构图 (population pyramid) shows the proportion 比例 of a population in each age group, with males on one side and females on the other. Its shape predicts how the population will change:
- Rapid growth: a wide base and narrow top (a pyramid). Many children will soon be parents, so growth continues. Typical of less developed countries such as Niger.
- Stable (slow growth): bars of similar width up to old age (a column). Typical of the USA or France.
- Declining: the base is narrower than the middle. Fewer young people than middle-aged, so the population will shrink. Typical of Japan, Italy and Germany.
A population with a wide base keeps growing for decades even if each woman has fewer children, because so many young people are entering their child-bearing years. This is called population momentum 人口惯性.
Explore
What does the shape predict?
Sort each age structure shape by whether the population will grow, stay stable, or shrink.
Vocabulary
Train
| English |
|---|
| age-structure diagram/eɪdʒ ˈstrʌktʃə ˈdaɪəɡræm/ |
| proportion/prəˈpɔːʃn/ |
| population momentum |
3.7
Total Fertility Rate

Syllabus
| Enduring Understanding | Learning Objective | Essential Knowledge |
|---|---|---|
EIN-1 | EIN-1.B |
|
Source: College Board AP Course and Exam Description
The total fertility rate 总和生育率 (TFR) is the average number of children a woman has in her lifetime. Replacement-level fertility 更替水平生育率 is the TFR at which each generation exactly replaces itself: about 2.1 in developed countries. It is higher than 2 because some children die before they grow up; in countries with high infant mortality it is closer to 2.5 or more.
- TFR above replacement level: the population grows.
- TFR at replacement level: the population becomes stable (after a lag, because of momentum).
- TFR below replacement level: the population eventually declines, unless people migrate in.
Factors that lower TFR:
- women having their first child at an older age;
- more education and job opportunities for girls and women;
- access to family planning 计划生育 and contraception;
- government policies, such as China's one-child policy (1980–2015) or tax benefits for small families;
- lower infant mortality (parents no longer need many births to make sure some children survive).
Infant mortality 婴儿死亡率 is the number of babies per 1000 live births who die before their first birthday. It falls when mothers have access to good healthcare and nutrition, clean water, and vaccines.
Explore
Growing, stable, or shrinking?
Sort each fertility rate by whether it is above, at, or below the replacement level of about 2.1.
Vocabulary
Train
| English |
|---|
| total fertility rate/ˈtəʊtl fɜːˈtɪlɪti reɪt/ |
| replacement-level fertility |
| family planning/ˈfæmɪli ˈplænɪŋ/ |
| infant mortality |
3.8
Human Population Dynamics

Syllabus
| Enduring Understanding | Learning Objective | Essential Knowledge |
|---|---|---|
EIN-1 | EIN-1.C.1 |
|
Source: College Board AP Course and Exam Description
A human population changes through births, deaths and migration 迁移:
$$\text{growth rate (\%)} = \frac{(\text{births} + \text{immigration}) - (\text{deaths} + \text{emigration})}{\text{population}} \times 100$$
Birth and death rates are usually given per 1000 people. The difference between them, without migration, is the rate of natural increase. To turn a rate per 1000 into a percent, divide by 10.
Birth rate 出生率, infant mortality and overall death rate, access to family planning, good nutrition and education, and getting married later all affect whether a population grows or declines.
Malthusian theory 马尔萨斯理论: in 1798 Thomas Malthus argued that population grows exponentially while food supply grows only steadily, so population would outrun food and be checked by famine and disease. Technology (the Green Revolution) has so far raised Earth's carrying capacity for humans, but finite land, water and energy still limit it.
The rule of 70 七十法则 estimates the doubling time 倍增时间 of anything growing at a constant percentage rate:
$$\text{doubling time (years)} \approx \frac{70}{\text{growth rate (\%)}}$$
Worked example. A country has a birth rate of 30 per 1000 and a death rate of 10 per 1000, with no migration. The growth rate is $\frac{30 - 10}{10} = 2.0\%$ per year. The doubling time is $\frac{70}{2.0} = 35$ years.
Worked example (FRQ style). A city grew at 1.88% in 2019. Doubling time $= \frac{70}{1.88} \approx 37$ years, so at a constant rate the population would double around $2019 + 37 = 2056$.
Worked example (resource use). A town of 26,250 people uses 90 gallons of water per person per day. Daily use is $26{,}250 \times 90 = 2{,}362{,}500$ gallons; yearly use is $2{,}362{,}500 \times 365 \approx 8.6 \times 10^{8}$ gallons.
Rapid growth increases demand for water, food, energy and land, and so increases the total ecological footprint 生态足迹. Development, urbanization 城市化 and economic development 经济发展 usually lower birth rates over time.
Explore
Human population growth
growth rate = births - deaths (+ migration)
Growth depends on the gap between birth rate and death rate; a small rate still doubles the population over time.
Vocabulary
Train
| English |
|---|
| migration/maɪˈɡreɪʃn/ |
| birth rate/bɜːθ reɪt/ |
| Malthusian theory |
| rule of 70 |
| doubling time/ˈdʌblɪŋ taɪm/ |
| ecological footprint/ˌekəˈlɒdʒɪkl ˈfʊtprɪnt/ |
| urbanization/ˌɜːbənaɪˈzeɪʃn/ |
| economic development/ˌiːkəˈnɒmɪk dɪˈveləpmənt/ |
3.9
Demographic Transition

Syllabus
| Enduring Understanding | Learning Objective | Essential Knowledge |
|---|---|---|
EIN-1 | EIN-1.D |
|
Source: College Board AP Course and Exam Description
The demographic transition 人口转变 is the change from high birth and death rates to low birth and death rates as a country develops from a pre-industrial to an industrial economy.
| Stage | Birth rate | Death rate | Growth | Why |
|---|---|---|---|---|
| 1 Pre-industrial | high | high | slow | poor food supply, disease, no medicine |
| 2 Transitional | high | falling fast | very rapid | better food, clean water, vaccines |
| 3 Industrial | falling | low | slowing | education, jobs for women, cities, contraception |
| 4 Post-industrial | low | low | stable or declining | high cost of raising children, women's careers |
Growth is fastest in stage 2 and early stage 3, where the gap between a still-high birth rate and an already-low death rate is widest. That lag is why a country's population keeps climbing long after its death rate falls.
Less developed countries tend to have higher infant mortality, younger populations and more children in the workforce. Children there help on farms and support parents in old age, which keeps birth rates high. Developed countries tend to be in stage 4.
Vocabulary
Train
| English |
|---|
| demographic transition/ˌdeməˈɡræfɪk trænˈsɪʃn/ |
3.9
Exam tips
- Use the rule of 70: doubling time ≈ 70 ÷ growth rate (%). Convert a rate per 1000 to a percent by dividing by 10.
- Generalists win in changing habitats; specialists win in stable habitats and are more vulnerable to habitat loss.
- Contrast r-selected (many offspring, little care, Type III) with K-selected (few offspring, much care, Type I or II) species. Most invasive species are r-selected.
- Overshoot leads to resource depletion and dieback; the carrying capacity may then be lower.
- Read age-structure diagrams from the base: wide base, rapid growth; even bars, stable; narrow base, declining.
- Replacement-level fertility is about 2.1; give specific reasons TFR falls (education of women, family planning, lower infant mortality).
- Classify limiting factors: density-dependent (disease, food, competition) or density-independent (storms, fires, drought).
- In the demographic transition, the death rate falls before the birth rate, which causes rapid growth in stage 2.
- A falling growth rate 增长率 still means growth: the population only shrinks when deaths and emigration exceed births and immigration.
Vocabulary
Train
| English |
|---|
| growth rate/ɡrəʊθ reɪt/ |
Interactive lessons on this topic
Work through it step by step, with instant-check exercises.