Source: College Board AP Course and Exam Description · 出典: College Board AP コースおよび試験説明書
English
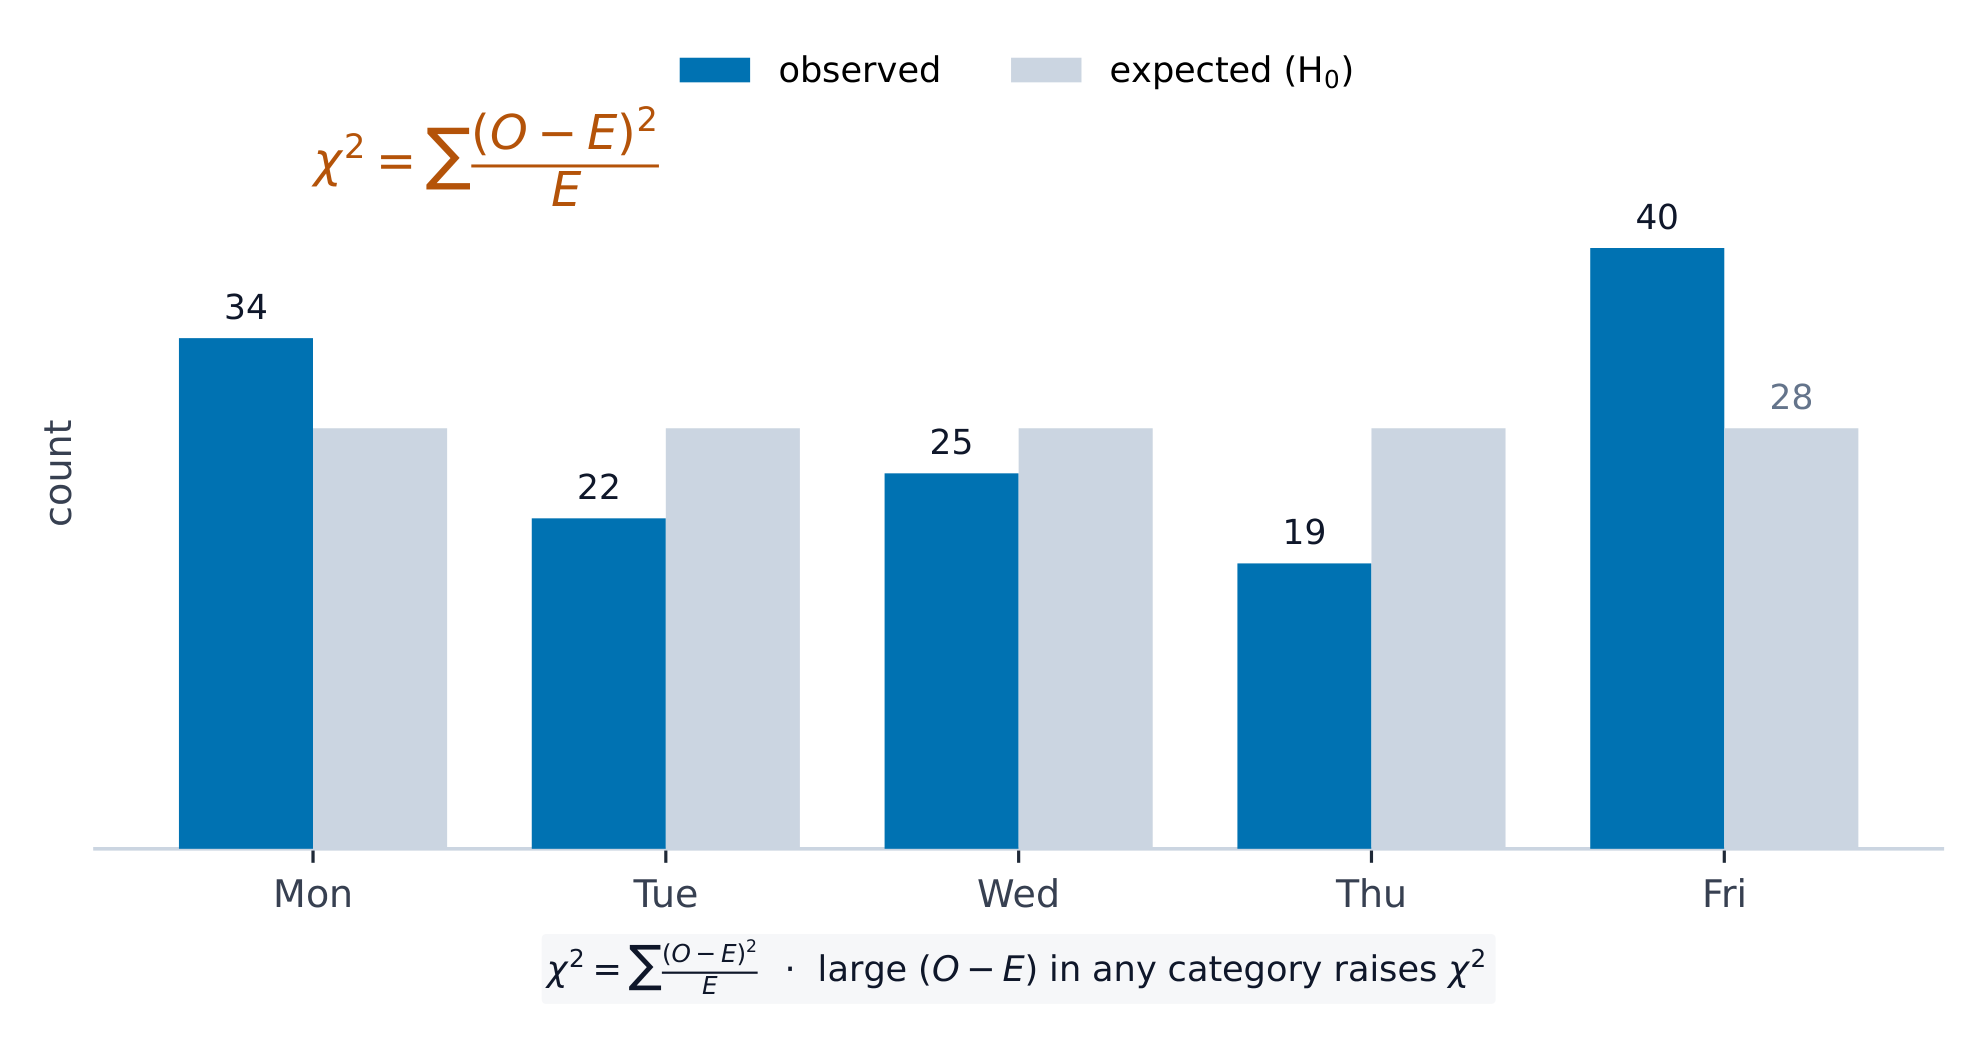
When data are counts spread across several categories, we test whether the observed counts differ from what a claim predicts. The tool is the chi-square 卡方 ($\chi^2$) statistic, which adds up the standardized gaps between observed and expected counts:
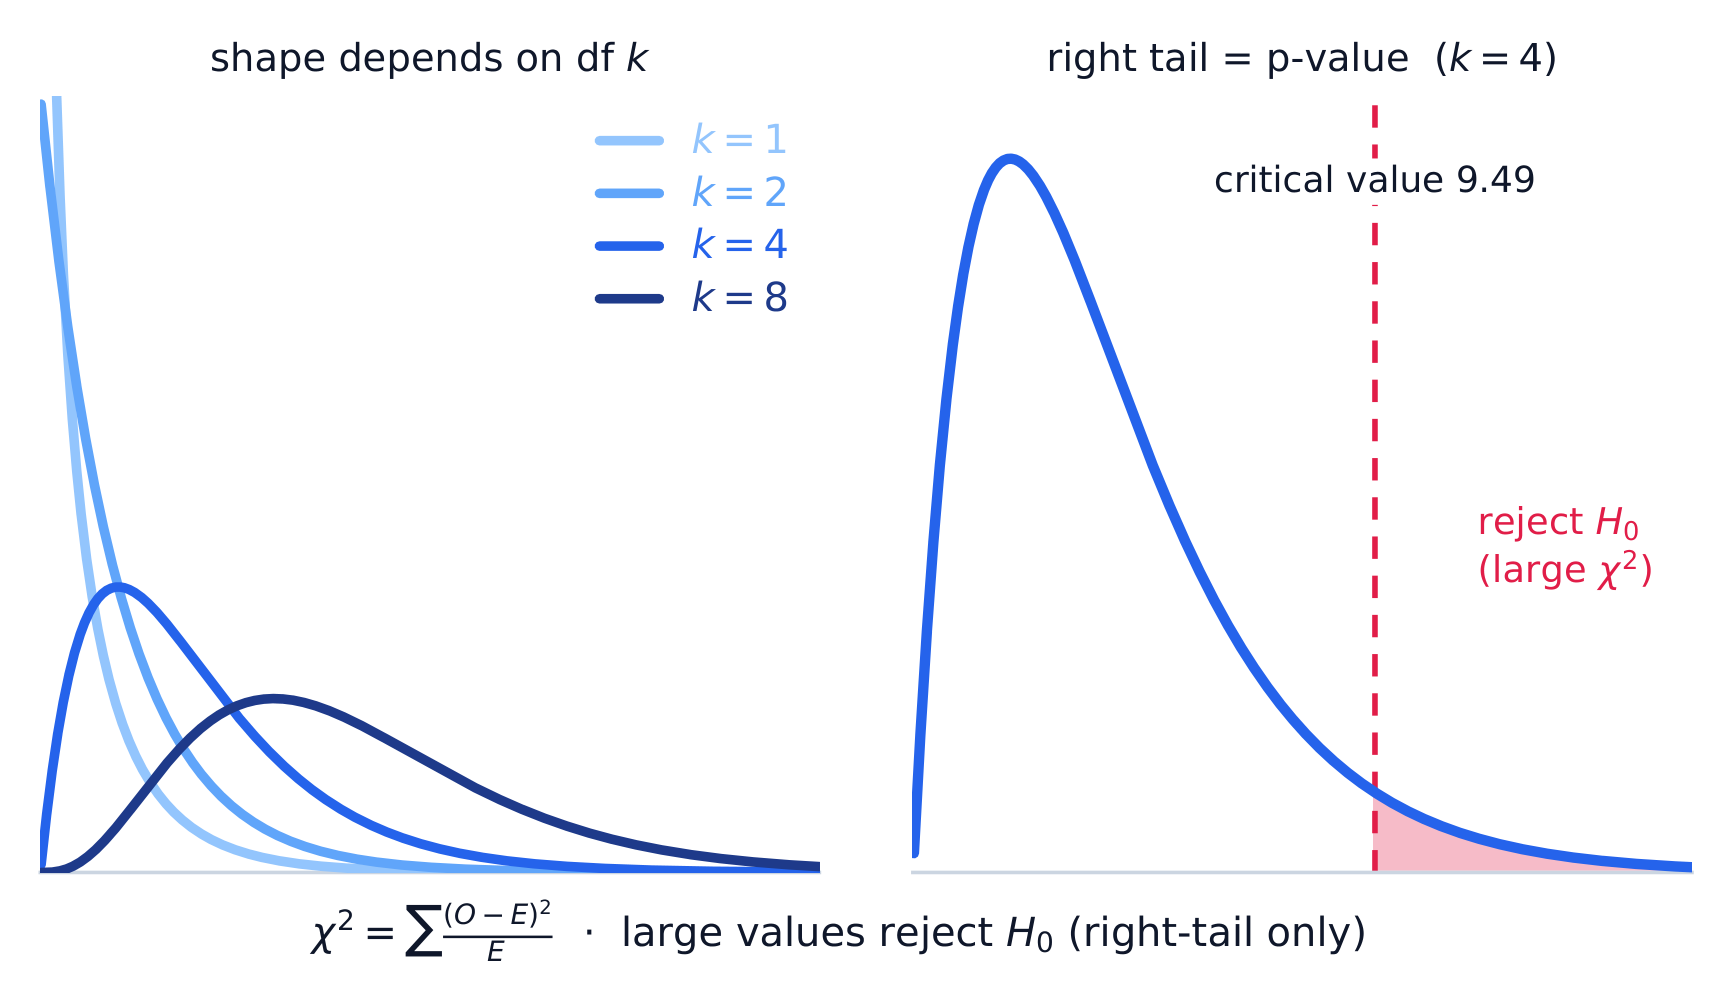
A large $\chi^2$ means the observed counts are far from expected – evidence against the claim. The chi-square distribution is right-skewed and depends on its degrees of freedom 自由度.
VAR-8.A.1 Expected counts of categorical data are counts consistent with the null hypothesis. In general, an expected count is a sample size times a probability.
The chi-square statistic measures the distance between observed and expected counts relative to expected counts.
Chi-square distributions have positive values and are skewed right. Within a family of density curves, the skew becomes less pronounced with increasing degrees of freedom.
Learning Objective VAR-8.B: Identify the null and alternative hypotheses in a test for a distribution of proportions in a set of categorical data. [Skill 1.F]
VAR-8.B.1 For a chi-square goodness-of-fit test, the null hypothesis specifies null proportions for each category, and the alternative hypothesis is that at least one of these proportions is not as specified in the null hypothesis.
Learning Objective VAR-8.C: Identify an appropriate testing method for a distribution of proportions in a set of categorical data. [Skill 1.E]
VAR-8.C.1 When considering a distribution of proportions for one categorical variable, the appropriate test is the chi-square test for goodness of fit.
Learning Objective VAR-8.D: Calculate expected counts for the chi-square test for goodness of fit. [Skill 3.A]
VAR-8.D.1 Expected counts for a chi-square goodness-of-fit test are (sample size)(null proportion).
Learning Objective VAR-8.E: Verify the conditions for making statistical inferences when testing goodness of fit for a chi-square distribution. [Skill 4.C]
VAR-8.E.1 In order to make statistical inferences for a chi-square test for goodness of fit we must check the following:
a. To check for independence:
i. Data should be collected using a random sample or randomized experiment.
ii. When sampling without replacement, check that $n \leq 10\%N$.
b. The chi-square test for goodness of fit becomes more accurate with more observations, so large counts should be used (shape).
i. A conservative check for large counts is that all expected counts should be greater than 5.
VAR-8.F.2 The distribution of the test statistic assuming the null hypothesis is true (null distribution) can be either a randomization distribution or, when a probability model is assumed to be true, a theoretical distribution (chi-square).
Learning Objective VAR-8.G: Determine the $p$-value for chi-square test for goodness of fit significance test. [Skill 3.E]
VAR-8.G.1 The $p$-value for a chi-square test for goodness of fit for a number of degrees of freedom is found using the appropriate table or computer generated output.
Enduring Understanding (DAT-3): Significance testing allows us to make decisions about hypotheses within a particular context.
Learning Objective DAT-3.I: Interpret the $p$-value for the chi-square test for goodness of fit. [Skill 4.B]
DAT-3.I.1 An interpretation of the $p$-value for the chi-square test for goodness of fit is the probability, given the null hypothesis and probability model are true, of obtaining a test statistic as, or more, extreme than the observed value.
Learning Objective DAT-3.J: Justify a claim about the population based on the results of a chi-square test for goodness of fit. [Skill 4.E]
DAT-3.J.1 A decision to either reject or fail to reject the null hypothesis is based on comparison of the $p$-value to the significance level, $\alpha$.
DAT-3.J.2 The results of a chi-square test for goodness of fit can serve as the statistical reasoning to support the answer to a research question about the population that was sampled.
Source: College Board AP Course and Exam Description · 出典: College Board AP コースおよび試験説明書
English
Compute $\chi^2=\sum\dfrac{(O-E)^2}{E}$ with $df=(\text{number of categories})-1$. Find the $p$-value from the chi-square distribution (upper tail), compare to $\alpha$, and conclude in context. A large component of the sum points to the category that deviates most.
Worked example. A die rolled $60$ times gives counts $8,10,12,9,11,10$. If it is fair, each expected count is $60/6=10$, so
with $df=6-1=5$. Write out every category, including the two that match their expected count exactly and so add $0$ – the sum runs over all six categories, and $df$ counts categories, not just the ones that differ. This $\chi^2$ is small (a large $p$-value), so we fail to reject$H_0$ – no evidence the die is unfair.
日本語
$\chi^2=\sum\dfrac{(O-E)^2}{E}$ を $df=(\text{number of categories})-1$ で計算する。カイ二乗分布(上端尾部)から $p$ 値を求め、 $\alpha$ と比較して文脈に基づいて結論を出す。和の大きな成分は、最も逸脱したカテゴリを指す。
カイ二乗は観測カウントと帰無仮説に基づく期待カウントを比較します
** worked example.** サイコロを$60$回振り、カウントが$8,10,12,9,11,10$となりました。公平であれば、各期待カウントは$60/6=10$なので、
Explore the chi-square distribution and its p-value · カイ二乗分布とそのp値を調べる
The p-value is the area in the right tail beyond your test statistic, so a larger$\chi^2$ means a smaller p-value. Drag $\chi^2$ to watch that area shrink, and drag df to see the whole family change shape — strongly right-skewed at small df, more symmetric as df grows. · p値は検定統計量より右側にある尾の面積であり、大きな$\chi^2$ は 小さい p値を意味する。$\chi^2$ をドラッグしてその面積が縮小する様子を確認し、自由度 (df) を動かして分布族全体の形状変化を見る(自由度が小さいときは強い右偏、自由度が増えると対称性を持つ)。
8.4
Expected Counts in Two-Way Tables · 2次元表における期待カウント
Syllabus · シラバス
English
Enduring Understanding (VAR-8): The chi-square distribution may be used to model variation.
Learning Objective VAR-8.H: Calculate expected counts for two-way tables of categorical data. [Skill 3.A]
VAR-8.H.1 The expected count in a particular cell of a two-way table of categorical data can be calculated using the formula:
This is the count you would see if the row and column variables were unrelated.
Worked example. In a two-way table a cell's row total is $40$, its column total is $50$, and the grand total is $200$. Its expected count is $E=\dfrac{40\times50}{200}=10$. Repeating for every cell gives the expected table to compare against the observed one.
** worked example.** 2次元表であるセルの行合計が$40$、列合計が$50$、全体合計が$200$の場合、その期待カウントは$E=\dfrac{40\times50}{200}=10$です。すべてのセルについて繰り返すことで、観測表と比較するための期待表が得られます。
スプレッドシートはカイ二乗検定前にカテゴリカルなカウントを整理します
8.5
Homogeneity or Independence? · 均質性か独立性か?
Syllabus · シラバス
English
Enduring Understanding (VAR-8): The chi-square distribution may be used to model variation.
Learning Objective VAR-8.I: Identify the null and alternative hypotheses for a chi-square test for homogeneity or independence. [Skill 1.F]
VAR-8.I.1 The appropriate hypotheses for a chi-square test for homogeneity are:
$H_0$: There is no difference in distributions of a categorical variable across populations or treatments.
$H_a$: There is a difference in distributions of a categorical variable across populations or treatments.
VAR-8.I.2 The appropriate hypotheses for a chi-square test for independence are:
$H_0$: There is no association between two categorical variables in a given population or the two categorical variables are independent.
$H_a$: Two categorical variables in a population are associated or dependent.
Learning Objective VAR-8.J: Identify an appropriate testing method for comparing distributions in two-way tables of categorical data. [Skill 1.E]
VAR-8.J.1 When comparing distributions to determine whether proportions in each category for categorical data collected from different populations are the same, the appropriate test is the chi-square test for homogeneity.
VAR-8.J.2 To determine whether row and column variables in a two-way table of categorical data might be associated in the population from which the data were sampled, the appropriate test is the chi-square test for independence.
Learning Objective VAR-8.K: Verify the conditions for making statistical inferences when testing a chi-square distribution for independence or homogeneity. [Skill 4.C]
VAR-8.K.1 In order to make statistical inferences for a chi-square test for two-way tables (homogeneity or independence), we must verify the following:
a. To check for independence:
i. For a test for independence: Data should be collected using a simple random sample.
ii. For a test for homogeneity: Data should be collected using a stratified random sample or randomized experiment.
iii. When sampling without replacement, check that $n \leq 10\%N$.
b. The chi-square tests for independence and homogeneity become more accurate with more observations, so large counts should be used (shape).
i. A conservative check for large counts is that all expected counts should be greater than 5.
b. 独立性および同質性のカイ二乗検定は観測値が増えるほど精度が高まるため、大きな期待度数を使用する(形状)。
i. 大きな度数に対する保守的なチェックとしては、すべての期待度数が5より大きいことが挙げられる。
Source: College Board AP Course and Exam Description · 出典: College Board AP コースおよび試験説明書
English
Two tests use the same $\chi^2$ math but answer different questions:
Test for homogeneity 同质性: are the distributions of one categorical variable the same across several populations or groups (separate samples/treatments)?
Test for independence 独立性: are two categorical variables associated within a single population (one sample, two variables measured)?
The design (several samples vs one sample) decides which name and hypotheses to use.
日本語
2つの検定は同じ$\chi^2$数学を使いますが、異なる質問に答えます:
均質性の検定: 1つのカテゴリ変数の分布が複数の集団やグループで同一か(分離された標本/処理)?
独立性の検定: 2つのカテゴリ変数が単一の集団内で関連しているか(1つの標本、2つの変数を測定)?
設計(複数標本 vs 1つ)がどの名前と仮説を使うかを決定します。
8.6
Carrying Out a Test for Homogeneity or Independence · 均質性または独立性の検定の実施
Syllabus · シラバス
English
Enduring Understanding (VAR-8): The chi-square distribution may be used to model variation.
Learning Objective VAR-8.L: Calculate the appropriate statistic for a chi-square test for homogeneity or independence. [Skill 3.E]
VAR-8.L.1 The appropriate test statistic for a chi-square test for homogeneity or independence is the chi-square statistic:
Equation:$\chi^2 = \sum \dfrac{(Observed\ count - Expected\ count)^2}{Expected\ count}$, with degrees of freedom equal to: $(number\ of\ rows - 1)(number\ of\ columns - 1)$.
Learning Objective VAR-8.M: Determine the $p$-value for a chi-square significance test for independence or homogeneity. [Skill 3.E]
VAR-8.M.1 The $p$-value for a chi-square test for independence or homogeneity for a number of degrees of freedom is found using the appropriate table or technology.
VAR-8.M.2 For a test of independence or homogeneity for a two-way table, the $p$-value is the proportion of values in a chi-square distribution with appropriate degrees of freedom that are equal to or larger than the test statistic.
Enduring Understanding (DAT-3): Significance testing allows us to make decisions about hypotheses within a particular context.
Learning Objective DAT-3.K: Interpret the $p$-value for the chi-square test for homogeneity or independence. [Skill 4.B]
DAT-3.K.1 An interpretation of the $p$-value for the chi-square test for homogeneity or independence is the probability, given the null hypothesis and probability model are true, of obtaining a test statistic as, or more, extreme than the observed value.
Learning Objective DAT-3.L: Justify a claim about the population based on the results of a chi-square test for homogeneity or independence. [Skill 4.E]
DAT-3.L.1 A decision to either reject or fail to reject the null hypothesis for a chi-square test for homogeneity or independence is based on comparison of the $p$-value to the significance level, $\alpha$.
DAT-3.L.2 The results of a chi-square test for homogeneity or independence can serve as the statistical reasoning to support the answer to a research question about the population that was sampled (independence) or the populations that were sampled (homogeneity).
Source: College Board AP Course and Exam Description · 出典: College Board AP コースおよび試験説明書
English
Compute expected counts, then $\chi^2=\sum\dfrac{(O-E)^2}{E}$ over all cells, with
$$df=(\text{rows}-1)(\text{columns}-1).$$
Conditions: random data, all expected counts $\ge 5$, 10% condition. Find the $p$-value, compare to $\alpha$, and conclude in context – evidence of a difference between groups (homogeneity) or of an association (independence).
Choosing the Right Categorical Procedure · 適切なカテゴリカル手続の選択
Syllabus · シラバス
English
This topic is intended to focus on the skill of selecting an appropriate inference procedure now that students have a range of options. Students should be given opportunities to practice when and how to apply all learning objectives relating to inference for categorical data.
Source: College Board AP Course and Exam Description · 出典: College Board AP コースおよび試験説明書
English
Decide by the setup: one categorical variable against a claimed distribution $\Rightarrow$goodness-of-fit; one sample cross-classified by two variables $\Rightarrow$independence; several samples/groups compared $\Rightarrow$homogeneity. Comparing just two proportions can use either a two-proportion $z$-test or a chi-square test, but only for a two-tailed alternative, where they agree exactly ($\chi^2=z^2$). A chi-square test is always two-tailed, so it cannot give a directional conclusion: if $H_a$ is one-tailed (say $p_1>p_2$), use the $z$-test.
All three tests use the same $\chi^2$ arithmetic, so the marks are won by naming the right one. The design decides — how many samples were taken, and how many variables were measured on each unit. · 3つの検定すべて同じ $\chi^2$ の計算式を使用するため、正解を名指すことで得点されます。決めるのは設計です。いくつのサンプルを取り、各単位についていくつの変数を測定したかです。
8.7
Exam tips · 試験対策
English
Use $\chi^2=\sum\tfrac{(O-E)^2}{E}$ for categorical data; always divide by the expected count.
Pick the right test: goodness-of-fit (one variable), independence, or homogeneity (two-way table).
Compute expected counts as $\tfrac{\text{row total}\times\text{column total}}{\text{grand total}}$ and check each is $\ge5$.
A large $\chi^2$ (small p-value) means observed counts differ from expected by more than chance.
State degrees of freedom correctly (categories $-1$, or $(r-1)(c-1)$).
Type to search notes, lessons, code, vocabulary and past-paper questions across every subject. · すべての科目でノートImplemented、Implemented、コード、語彙、過去問問題を検索するために入力してください。