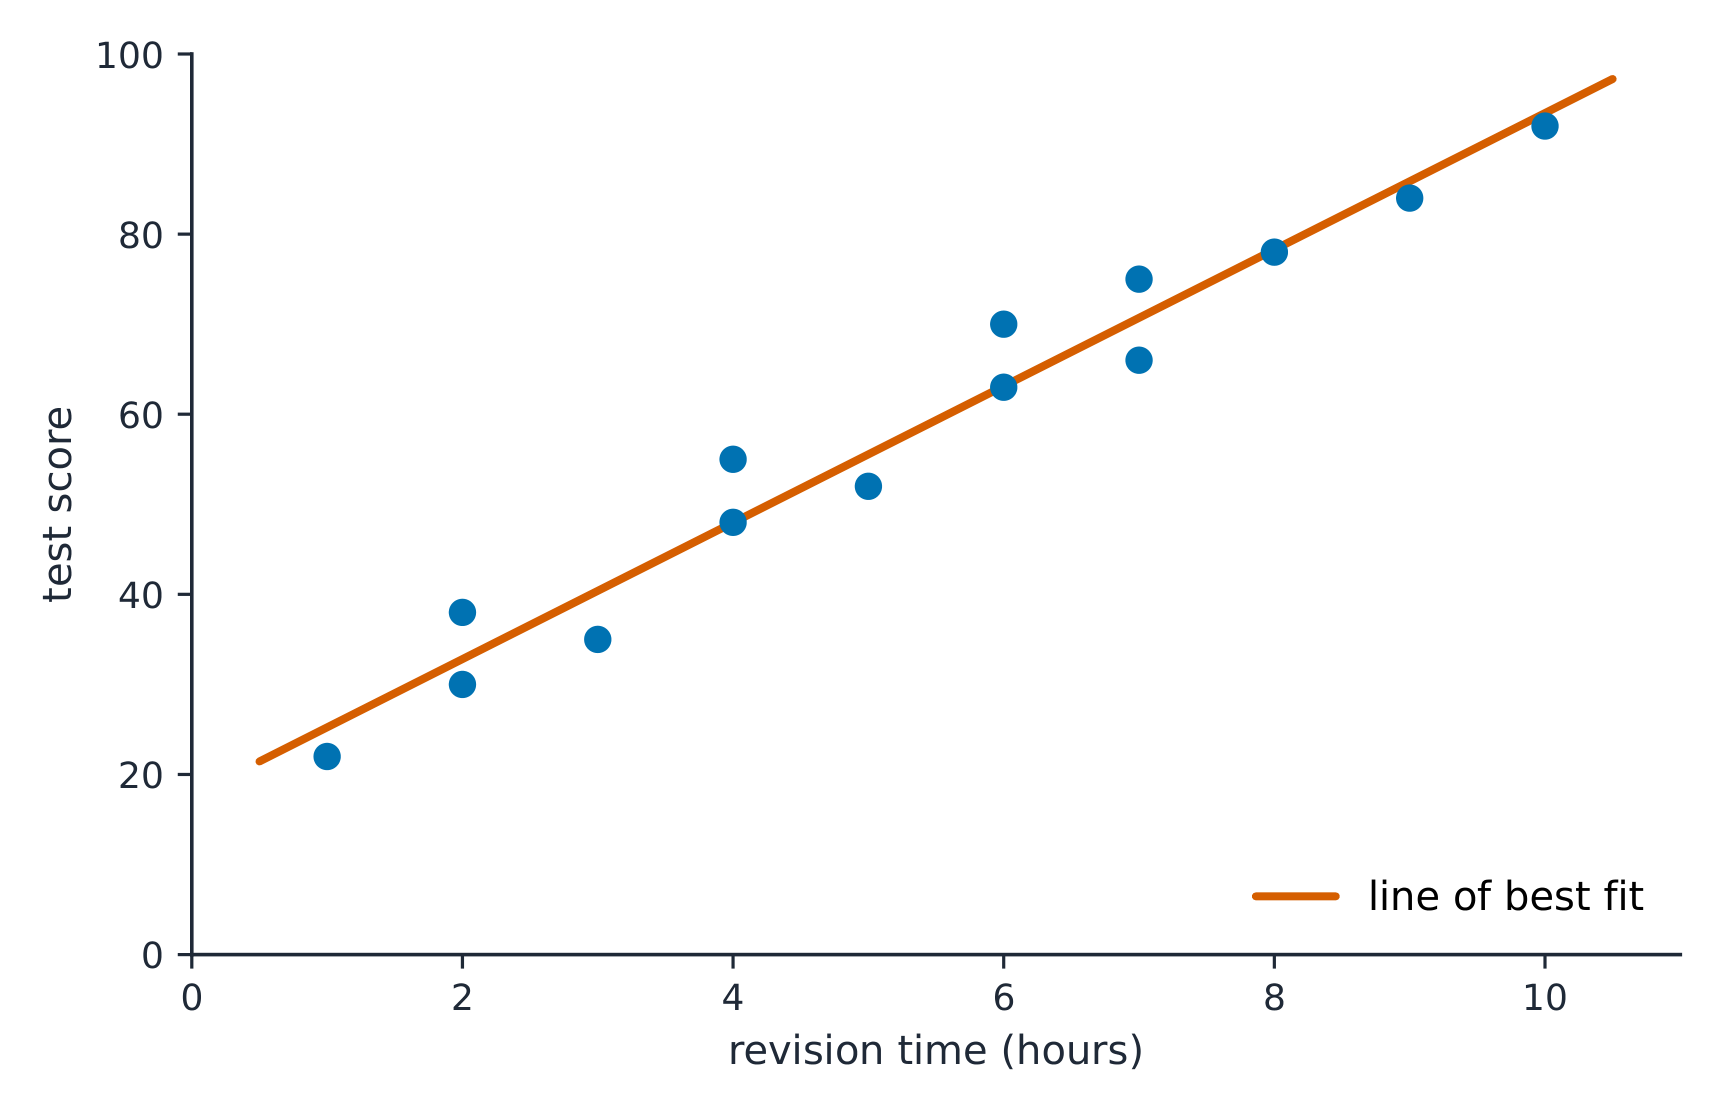
Đây là một lớp học trên biểu đồ scatter: giờ ôn tập dọc theo trục hoành, điểm kiểm tra dọc theo trục tung. Đường拟合 (best fit) đi lên. Nhưng đây chỉ là một lớp học. Hãy lấy…”
English narration · English + 中文 subtitles burned in · Giọng đọc tiếng Anh · phụ đề tiếng Anh + 中文 được ghi trực tiếp
9.1
Do Those Points Align? · Các Điểm Those Có Thẳng Hàng Không?
Syllabus · Chương trình
English
Enduring Understanding (VAR-1): Given that variation may be random or not, conclusions are uncertain.
Learning Objective VAR-1.K: Identify questions suggested by variation in scatter plots. [Skill 1.A]
VAR-1.K.1 Variation in points' positions relative to a theoretical line may be random or non-random.
Tiếng Việt
Hiểu biết bền vững (VAR-1): Vì sự biến thiên có thể ngẫu nhiên hoặc không, nên những kết luận đều mang tính bất định.
Mục tiêu học tập VAR-1.K: Xác định các câu hỏi gợi ý từ sự biến thiên trong biểu đồ phân tán. [Kỹ năng 1.A]
VAR-1.K.1 Sự biến thiên trong vị trí của các điểm so với đường lý thuyết có thể là ngẫu nhiên hoặc không ngẫu nhiên.
Source: College Board AP Course and Exam Description · Nguồn: Mô tả Khóa học và Bài thi College Board AP
English
A sample scatterplot 散点图 gives a sample slope 样本斜率$b$ for the least-squares regression 回归 line – but a different sample would give a slightly different slope. So $b$ is a statistic with sampling variability 抽样变异性, estimating the true (population) slope 总体斜率$\beta$. This unit does inference 推断 for $\beta$: is there a real linear 线性 relationship, and how strong is it?
Tiếng Việt
Một biểu đồ scatter mẫu cung cấp một độ dốc mẫu$b$ cho đường hồi quy bình phương tối thiểu – nhưng một mẫu khác sẽ cho độ dốc hơi khác. Vì vậy $b$ là một thống kê có biến động lấy mẫu, ước lượng độ dốc thực (quần thể)$\beta$. Đơn vị này tiến hành suy luận cho $\beta$: liệu có mối quan hệ tuyến tính thực sự không, và nó mạnh đến đâu?
9.2
Confidence Interval for a Slope · Khoảng Tin Cậy Cho Độ Dốc
Syllabus · Chương trình
English
Enduring Understanding (UNC-4): An interval of values should be used to estimate parameters, in order to account for uncertainty.
Learning Objective UNC-4.AC: Identify an appropriate confidence interval procedure for a slope of a regression model. [Skill 1.D]
UNC-4.AC.1 Consider a response variable, $y$, that is linearly related to an explanatory variable, $x$. For a simple random sample of $n$ observations, the sample regression line, $\hat{y} = a + bx$, is an estimate of the population regression line $\mu_y = \alpha + \beta x$. For a particular observation, $(x_i, y_i)$, the residual from the sample regression line, $y_i - \hat{y}_i = y_i - (a + bx_i)$, is an estimate of $y_i - (\alpha + \beta x_i)$, the deviation of the response variable from the population regression line. For all points $(x, y)$ in the population, the standard deviation of all of the deviations of the response variable from the population regression line, $\sigma$, can be estimated by the standard deviation of the residuals from the sample regression line, $s = \sqrt{\dfrac{\sum\left(y_i - \hat{y}_i\right)^2}{n-2}}$. (Note: This formula uses $n-2$ in the denominator instead of $n-1$ because two parameters, $\alpha$ and $\beta$, must be estimated to obtain the predicted values from the least-squares regression line.)
UNC-4.AC.2 For a simple random sample of $n$ observations, let $b$ represent the slope of a sample regression line. Then the mean of the sampling distribution for $b$ equals the population slope: $\mu_b = \beta$. The standard deviation of the sampling distribution for $b$ is $\sigma_b = \dfrac{\sigma}{\sigma_x \sqrt{n}}$, where $\sigma_x = \sqrt{\dfrac{\sum\left(x_i - \bar{x}\right)^2}{n}}$.
UNC-4.AC.3 The appropriate confidence interval for the slope of a regression model is a $t$-interval for the slope.
Learning Objective UNC-4.AD: Verify the conditions to calculate confidence intervals for the slope of a regression model. [Skill 4.C]
UNC-4.AD.1 In order to calculate a confidence interval to estimate the slope of a regression line, we must check the following:
a. The true relationship between $x$ and $y$ is linear. Analysis of residuals may be used to verify linearity.
b. The standard deviation for $y$, $\sigma_y$, does not vary with $x$. Analysis of residuals may be used to check for approximately equal standard deviations for all $x$.
c. To check for independence:
i. Data should be collected using a random sample or a randomized experiment.
ii. When sampling without replacement, check that $n \le 10\% N$.
d. For a particular value of $x$, the responses ($y$-values) are approximately normally distributed. Analysis of graphical representations of residuals may be used to check for normality.
i. If the observed distribution is skewed, $n$ should be greater than 30.
Learning Objective UNC-4.AE: Determine the given margin of error for the slope of a regression model. [Skill 3.D]
UNC-4.AE.1 For the slope of a regression line, the margin of error is the critical value $\left(t^*\right)$ times the standard error ($SE$) of the slope.
UNC-4.AE.2 The standard error for the slope of a regression line with sample standard deviation, $s$, is $SE = \dfrac{s}{s_x \sqrt{n-1}}$, where $s$ is the estimate of $\sigma$ and $s_x$ is the sample standard deviation of the $x$ values.
Learning Objective UNC-4.AF: Calculate an appropriate confidence interval for the slope of a regression model. [Skill 3.D]
UNC-4.AF.1 The point estimate for the slope of a regression model is the slope of the line of best fit, $b$.
UNC-4.AF.2 For the slope of a regression model, the interval estimate is $b \pm t^* \left(SE_b\right)$.
Tiếng Việt
Hiểu biết bền vững (UNC-4): Một khoảng giá trị nên được sử dụng để ước lượng tham số, nhằm tính đến sự không chắc chắn.
Mục tiêu học tập UNC-4.AC: Xác định quy trình khoảng tin cậy phù hợp cho hệ số góc của mô hình hồi quy. [Kỹ năng 1.D]
UNC-4.AC.1 Xét một biến phản hồi, $y$, có quan hệ tuyến tính với một biến giải thích, $x$. Đối với một mẫu ngẫu nhiên đơn gồm $n$ quan sát, đường hồi quy mẫu, $\hat{y} = a + bx$, là ước lượng của đường hồi quy tổng thể, $\mu_y = \alpha + \beta x$. Đối với một quan sát cụ thể, $(x_i, y_i)$, phần dư từ đường hồi quy mẫu, $y_i - \hat{y}_i = y_i - (a + bx_i)$, là ước lượng của $y_i - (\alpha + \beta x_i)$, độ lệch của biến phản hồi so với đường hồi quy tổng thể. Đối với tất cả các điểm $(x, y)$ trong tổng thể, độ lệch chuẩn của tất cả các độ lệch của biến phản hồi so với đường hồi quy tổng thể, $\sigma$, có thể được ước lượng bởi độ lệch chuẩn của các phần dư từ đường hồi quy mẫu, $s = \sqrt{\dfrac{\sum\left(y_i - \hat{y}_i\right)^2}{n-2}}$. (Lưu ý: Công thức này sử dụng $n-2$ ở mẫu số thay vì $n-1$ vì hai tham số, $\alpha$ và $\beta$, phải được ước lượng để thu được các giá trị dự đoán từ đường hồi quy bình phương tối thiểu.)
UNC-4.AC.2 Đối với mẫu ngẫu nhiên đơn gồm $n$ quan sát, gọi $b$ là hệ số góc của đường hồi quy mẫu. Khi đó, trung bình của phân phối lấy mẫu cho $b$ bằng hệ số góc tổng thể: $\mu_b = \beta$. Độ lệch chuẩn của phân phối lấy mẫu cho $b$ là $\sigma_b = \dfrac{\sigma}{\sigma_x \sqrt{n}}$, trong đó $\sigma_x = \sqrt{\dfrac{\sum\left(x_i - \bar{x}\right)^2}{n}}$.
UNC-4.AC.3 Khoảng tin cậy phù hợp cho độ dốc của mô hình hồi quy là khoảng $t$ cho độ dốc.
Mục tiêu học tập UNC-4.AD: Kiểm tra các điều kiện để tính khoảng tin cậy cho độ dốc của mô hình hồi quy. [Kỹ năng 4.C]
UNC-4.AD.1 Để tính khoảng tin cậy nhằm ước lượng độ dốc của đường hồi quy, chúng ta cần kiểm tra các điều sau:
a. Quan hệ thực tế giữa $x$ và $y$ là tuyến tính. Phân tích phần dư có thể được sử dụng để xác minh tính tuyến tính.
b. Độ lệch chuẩn của $y$, $\sigma_y$, không thay đổi theo $x$. Phân tích phần dư có thể được sử dụng để kiểm tra xem độ lệch chuẩn xấp xỉ bằng nhau cho tất cả các $x$ hay không.
c. Để kiểm tra tính độc lập:
i. Dữ liệu nên được thu thập bằng cách sử dụng mẫu ngẫu nhiên hoặc thí nghiệm được gán ngẫu nhiên.
ii. Khi lấy mẫu không thay thế, hãy kiểm tra rằng $n \le 10\% N$.
d. Đối với một giá trị cụ thể của $x$, các phản hồi (các giá trị $y$) phân phối xấp xỉ theo phân phối chuẩn. Phân tích các biểu diễn đồ thị của phần dư có thể được sử dụng để kiểm tra tính chuẩn.
i. Nếu phân phối quan sát bị lệch, $n$ nên lớn hơn 30.
Mục tiêu học tập UNC-4.AE: Xác định biên độ sai số đã cho cho độ dốc của mô hình hồi quy. [Kỹ năng 3.D]
UNC-4.AE.1 Đối với độ dốc của đường hồi quy, biên độ sai số là giá trị tới hạn $\left(t^*\right)$ nhân với sai số chuẩn ($SE$) của độ dốc.
UNC-4.AE.2 Sai số chuẩn cho độ dốc của đường hồi quy với độ lệch chuẩn mẫu, $s$, là $SE = \dfrac{s}{s_x \sqrt{n-1}}$, trong đó $s$ là ước lượng của $\sigma$ và $s_x$ là độ lệch chuẩn mẫu của các giá trị $x$.
Mục tiêu học tập UNC-4.AF: Tính toán khoảng tin cậy phù hợp cho độ dốc của mô hình hồi quy. [Kỹ năng 3.D]
UNC-4.AF.1 Ước lượng điểm cho độ dốc của mô hình hồi quy là độ dốc của đường拟合 tốt nhất (đường hồi quy), $b$.
UNC-4.AF.2 Đối với độ dốc của mô hình hồi quy, ước lượng khoảng là $b \pm t^* \left(SE_b\right)$.
Source: College Board AP Course and Exam Description · Nguồn: Mô tả Khóa học và Bài thi College Board AP
English
A $t$ interval for the true slope $\beta$:
$$b\pm t^{*}\,SE_b,\qquad df=n-2,$$
where $b$ is the sample slope and $SE_b$ its standard error (read from computer output). Conditions (LINER): the true relationship is Linear, observations Independent, residuals Normal, and residuals have Equal spread (check the residual plot and a histogram of residuals), from Random data. Interpret the interval for $\beta$ in context, with units of $y$ per unit of $x$.
The residual plot 残差图 is where you check Linear and Equal-spread: you want a formless cloud around zero. A curve means the relationship is not linear; a fan (spread growing with $x$) means the residuals do not have equal spread – both break a condition.
Worked example. Regression output gives slope $b=2.5$ with $SE_b=0.8$ from $n=20$ points. For a $95\%$ interval, $df=18$ gives $t^*=2.101$:
$$2.5\pm2.101(0.8)=2.5\pm1.68=(0.82,\ 4.18).$$
Because $0$ is not in the interval, there is evidence of a positive linear relationship.
Tiếng Việt
Một khoảng tin cậy $t$ cho độ dốc thực $\beta$:
$$b\pm t^{*}\,SE_b,\qquad df=n-2,$$
trong đó $b$ là độ dốc mẫu và $SE_b$ là sai số chuẩn của nó (đọc từ đầu ra máy tính). Điều kiện (LINER): mối quan hệ thực là Tuyến tính, các quan sát Độc lập, phần dư Normal, và phần dư có Bằng độ rộng (kiểm tra biểu đồ phần dư và biểu đồ tần suất phần dư), từ dữ liệu Ngẫu nhiên. Diễn giải khoảng tin cậy cho $\beta$ trong ngữ cảnh, với đơn vị của $y$ trên đơn vị của $x$.
Biểu đồ phần dư ngẫu nhiên, không có mô hình hỗ trợ các điều kiện; một đường cong hoặc hình quạt thì không
Biểu đồ phần dư là nơi bạn kiểm tra Tuyến tính và Bằng spread: bạn muốn thấy một đám mây vô định dạng quanh giá trị 0. Một đường cong có nghĩa là mối quan hệ không tuyến tính; một hình quạt (spread tăng theo $x$) có nghĩa là phần dư không có equal spread – cả hai đều vi phạm điều kiện.
Ví dụ đã giải. Đầu ra hồi quy cho độ dốc $b=2.5$ với $SE_b=0.8$ từ $n=20$ điểm. Đối với khoảng tin cậy $95\%$, $df=18$ cho $t^*=2.101$:
$$2.5\pm2.101(0.8)=2.5\pm1.68=(0.82,\ 4.18).$$
Vì $0$không nằm trong khoảng tin cậy, có bằng chứng về mối quan hệ tuyến tính dương.
Suy luận độ dốc dựa trên đường hồi quy bình phương tối thiểu qua các điểmHồi quy bình phương tối thiểu: đường thẳng làm giảm tổng bình phương phần dư
Explore · Khám phá
Inference for a regression slope · Suy luận cho độ dốc hồi quy
The sample slope varies from sample to sample; a confidence interval and t-test ask whether the true slope could be zero (no linear relationship). · Độ dốc mẫu thay đổi từ mẫu này sang mẫu khác; khoảng tin cậy và kiểm định t yêu cầu liệu độ dốc thực sự có thể bằng không (không có mối quan hệ tuyến tính) hay không.
Justifying a Claim About a Slope · Chứng Minh Một Tuyên Về关于 Độ Dốc
Syllabus · Chương trình
English
Enduring Understanding (UNC-4): An interval of values should be used to estimate parameters, in order to account for uncertainty.
Learning Objective UNC-4.AG: Interpret a confidence interval for the slope of a regression model. [Skill 4.B]
UNC-4.AG.1 In repeated random sampling with the same sample size, approximately C% of confidence intervals created will capture the slope of the regression model, i.e., the true slope of the population regression model.
UNC-4.AG.2 An interpretation for a confidence interval for the slope of a regression line should include a reference to the sample taken and details about the population it represents.
Learning Objective UNC-4.AH: Justify a claim based on a confidence interval for the slope of a regression model. [Skill 4.D]
UNC-4.AH.1 A confidence interval for the slope of a regression model provides an interval of values that may provide sufficient evidence to support a particular claim in context.
Learning Objective UNC-4.AI: Identify the effects of sample size on the width of a confidence interval for the slope of a regression model. [Skill 4.A]
UNC-4.AI.1 When all other things remain the same, the width of the confidence interval for the slope of a regression model tends to decrease as the sample size increases.
Tiếng Việt
Hiểu biết bền vững (UNC-4): Một khoảng giá trị nên được sử dụng để ước lượng tham số, nhằm tính đến sự không chắc chắn.
Mục tiêu học tập UNC-4.AG: Giải thích khoảng tin cậy cho độ dốc của mô hình hồi quy. [Kỹ năng 4.B]
UNC-4.AG.1 Trong các lần lấy mẫu ngẫu nhiên lặp lại với cùng kích thước mẫu, khoảng C% các khoảng tin cậy được tạo ra sẽ bao gồm độ dốc của mô hình hồi quy, tức là độ dốc thực tế của đường hồi quy tổng thể.
UNC-4.AG.2 Một cách giải thích cho khoảng tin cậy cho độ dốc của đường hồi quy nên bao gồm tham chiếu đến mẫu đã lấy và các chi tiết về tổng thể mà nó đại diện.
Mục tiêu học tập UNC-4.AH: Chứng minh một tuyên bố dựa trên khoảng tin cậy cho độ dốc của mô hình hồi quy. [Kỹ năng 4.D]
UNC-4.AH.1 Một khoảng tin cậy cho độ dốc của mô hình hồi quy cung cấp một khoảng các giá trị có thể cung cấp bằng chứng đủ mạnh để hỗ trợ một tuyên bố cụ thể trong ngữ cảnh.
Mục tiêu học tập UNC-4.AI: Xác định ảnh hưởng của kích thước mẫu lên độ rộng của khoảng tin cậy cho độ dốc của mô hình hồi quy. [Kỹ năng 4.A]
UNC-4.AI.1 Khi mọi thứ khác không đổi, độ rộng của khoảng tin cậy cho độ dốc của mô hình hồi quy có xu hướng giảm khi kích thước mẫu tăng lên.
Source: College Board AP Course and Exam Description · Nguồn: Mô tả Khóa học và Bài thi College Board AP
English
If the confidence interval for $\beta$ contains $0$, a slope of zero is plausible – no evidence of a linear relationship. If the interval is entirely positive or negative, there is evidence of a real (positive or negative) linear relationship. State the direction in context.
Tiếng Việt
Nếu khoảng tin cậy cho $\beta$ chứa $0$, độ dốc bằng 0 là khả dĩ – không có bằng chứng về mối quan hệ tuyến tính. Nếu khoảng tin cậy hoàn toàn dương hoặc âm, có bằng chứng về mối quan hệ tuyến tính thực (dương hoặc âm). Nêu hướng trong ngữ cảnh.
9.4
Setting Up a Test for a Slope · Thiết Lập Một Kiểm Tra Cho Độ Dốc
Syllabus · Chương trình
English
Enduring Understanding (VAR-7): The $t$-distribution may be used to model variation.
Learning Objective VAR-7.J: Identify the appropriate selection of a testing method for a slope of a regression model. [Skill 1.E]
VAR-7.J.1 The appropriate test for the slope of a regression model is a $t$-test for a slope.
Learning Objective VAR-7.K: Identify appropriate null and alternative hypotheses for a slope of a regression model. [Skill 1.F]
VAR-7.K.1 The null hypothesis for a $t$-test for a slope is: $H_0 : \beta = \beta_0$, where $\beta_0$ is the hypothesized value from the null hypothesis. The alternative hypothesis is $H_0 : \beta < \beta_0$ or $H_0 : \beta > \beta_0$, or $H_0 : \beta \neq \beta_0$.
Learning Objective VAR-7.L: Verify the conditions for the significance test for the slope of a regression model. [Skill 4.C]
VAR-7.L.1 In order to make statistical inferences when testing for the slope of a regression model, we must check the following:
a. The true relationship between $x$ and $y$ is linear. Analysis of residuals may be used to verify linearity.
b. The standard deviation for $y$, $\sigma_y$, does not vary with $x$. Analysis of residuals may be used to check for approximately equal standard deviations for all $x$.
c. To check for independence:
i. Data should be collected using a random sample or a randomized experiment.
ii. When sampling without replacement, check that $n \le 10\% N$.
d. For a particular value of $x$, the responses ($y$-values) are approximately normally distributed. Analysis of graphical representations of residuals may be used to check for normality.
i. If the observed distribution is skewed, $n$ should be greater than 30.
ii. If the sample size is less than 30, the distribution of the sample data should be free from strong skewness and outliers.
Tiếng Việt
Hiểu biết bền vững (VAR-7): Phân phối $t$ có thể được sử dụng để mô hình hóa sự biến thiên.
Mục tiêu học tập VAR-7.J: Xác định sự lựa chọn phương pháp kiểm tra phù hợp cho độ dốc của mô hình hồi quy. [Kỹ năng 1.E]
VAR-7.J.1 Bài kiểm tra phù hợp cho độ dốc của mô hình hồi quy là bài kiểm tra $t$ cho độ dốc.
Mục tiêu học tập VAR-7.K: Xác định giả thuyết không và giả thuyết đối phù hợp cho độ dốc của mô hình hồi quy. [Kỹ năng 1.F]
VAR-7.K.1 Giả thuyết không cho bài kiểm tra $t$ cho độ dốc là: $H_0 : \beta = \beta_0$, trong đó $\beta_0$ là giá trị được giả định từ giả thuyết không. Giả thuyết đối là $H_0 : \beta < \beta_0$ hoặc $H_0 : \beta > \beta_0$, hoặc $H_0 : \beta \neq \beta_0$.
Mục tiêu học tập VAR-7.L: Xác minh các điều kiện cho bài kiểm tra ý nghĩa cho độ dốc của mô hình hồi quy. [Kỹ năng 4.C]
VAR-7.L.1 Để đưa ra suy luận thống kê khi kiểm tra độ dốc của mô hình hồi quy, chúng ta cần kiểm tra các điều sau:
a. Quan hệ thực tế giữa $x$ và $y$ là tuyến tính. Phân tích phần dư có thể được sử dụng để xác minh tính tuyến tính.
b. Độ lệch chuẩn của $y$, $\sigma_y$, không thay đổi theo $x$. Phân tích phần dư có thể được sử dụng để kiểm tra xem độ lệch chuẩn xấp xỉ bằng nhau cho tất cả các $x$ hay không.
c. Để kiểm tra tính độc lập:
i. Dữ liệu nên được thu thập bằng cách sử dụng mẫu ngẫu nhiên hoặc thí nghiệm được gán ngẫu nhiên.
ii. Khi lấy mẫu không thay thế, hãy kiểm tra rằng $n \le 10\% N$.
d. Đối với một giá trị cụ thể của $x$, các phản hồi (các giá trị $y$) phân phối xấp xỉ theo phân phối chuẩn. Phân tích các biểu diễn đồ thị của phần dư có thể được sử dụng để kiểm tra tính chuẩn.
i. Nếu phân phối quan sát bị lệch, $n$ nên lớn hơn 30.
ii. Nếu kích thước mẫu nhỏ hơn 30, phân phối dữ liệu mẫu nên không có độ lệch mạnh và ngoại lệ.
Source: College Board AP Course and Exam Description · Nguồn: Mô tả Khóa học và Bài thi College Board AP
English
The usual test asks whether there is any linear relationship:
$$H_0:\beta=0 \quad(\text{no linear relationship})\qquad H_a:\beta\neq 0 \ (\text{or } <,\,>).$$
Check the LINER conditions. This is a $t$-test on the slope.
Tiếng Việt
Kiểm tra thông thường hỏi liệu có bất kỳ mối quan hệ tuyến tính nào không:
$$H_0:\beta=0 \quad(\text{no linear relationship})\qquad H_a:\beta\neq 0 \ (\text{or } <,\,>).$$
Kiểm tra các điều kiện LINER. Đây là một kiểm tra $t$-test trên độ dốc.
Kiểm tra biểu đồ phần dư trước khi tin tưởng khoảng tin cậy hoặc kiểm tra độ dốc
9.5
Carrying Out a Test for a Slope · Thực Hiện Một Kiểm Tra Cho Độ Dốc
Syllabus · Chương trình
English
Enduring Understanding (VAR-7): The $t$-distribution may be used to model variation.
Learning Objective VAR-7.M: Calculate an appropriate test statistic for the slope of a regression model. [Skill 3.E]
VAR-7.M.1 The distribution of the slope of a regression model assuming all conditions are satisfied and the null hypothesis is true (null distribution) is a $t$-distribution.
VAR-7.M.2 For simple linear regression when random sampling from a population for the response that can be modeled with a normal distribution for each value of the explanatory variable, the sampling distribution of $t = \dfrac{b - \beta}{SE_b}$ has a $t$-distribution with degrees of freedom equal to $n - 2$. When testing the slope in a simple linear regression model with one parameter, the slope, the test for the slope has $df = n - 1$.
Enduring Understanding (DAT-3): Significance testing allows us to make decisions about hypotheses within a particular context.
Learning Objective DAT-3.M: Interpret the $p$-value of a significance test for the slope of a regression model. [Skill 4.B]
DAT-3.M.1 An interpretation of the $p$-value of a significance test for the slope of a regression model should recognize that the $p$-value is computed by assuming that the null hypothesis is true, i.e., by assuming that the true population slope is equal to the particular value stated in the null hypothesis.
Learning Objective DAT-3.N: Justify a claim about the population based on the results of a significance test for the slope of a regression model. [Skill 4.E]
DAT-3.N.1 A formal decision explicitly compares the $p$-value to the significance $\alpha$. If the $p$-value $\le \alpha$, then reject the null hypothesis, $H_0 : \beta = \beta_0$. If the $p$-value $> \alpha$, then fail to reject the null hypothesis.
DAT-3.N.2 The results of a significance test for the slope of a regression model can serve as the statistical reasoning to support the answer to a research question about that sample.
Tiếng Việt
Hiểu biết bền vững (VAR-7): Phân phối $t$ có thể được sử dụng để mô hình hóa sự biến thiên.
Mục tiêu học tập VAR-7.M: Tính toán thống kê kiểm tra phù hợp cho độ dốc của mô hình hồi quy. [Kỹ năng 3.E]
VAR-7.M.1 Phân phối của độ dốc của mô hình hồi quy khi giả thiết tất cả các điều kiện được thỏa mãn và giả thuyết không đúng (phân phối không) là phân phối $t$.
VAR-7.M.2 Đối với hồi quy tuyến tính đơn giản khi lấy mẫu ngẫu nhiên từ một quần thể cho biến phản hồi có thể được mô hình hóa bằng phân phối chuẩn cho mỗi giá trị của biến giải thích, phân phối mẫu của $t = \dfrac{b - \beta}{SE_b}$ có phân phối $t$ với bậc tự do bằng $n - 2$. Khi kiểm tra hệ số góc trong mô hình hồi quy tuyến tính đơn giản với một tham số, hệ số góc, bài kiểm tra cho hệ số góc có $df = n - 1$.
Hiểu biết bền vững (DAT-3): Kiểm định ý nghĩa giúp chúng ta đưa ra quyết định về các giả thuyết trong một ngữ cảnh cụ thể.
Mục tiêu học tập DAT-3.M: Diễn giải giá trị $p$ của phép kiểm tra ý nghĩa cho hệ số góc của mô hình hồi quy. [Kỹ năng 4.B]
DAT-3.M.1 Một diễn giải giá trị $p$ của phép kiểm tra ý nghĩa cho hệ số góc của mô hình hồi quy cần lưu ý rằng giá trị $p$ được tính toán bằng cách giả định giả thuyết không đúng, tức là giả định rằng hệ số góc thực tế của tổng thể bằng với giá trị cụ thể nêu trong giả thuyết không.
Mục tiêu học tập DAT-3.N: Bảo vệ một tuyên bố về quần thể dựa trên kết quả của bài kiểm tra ý nghĩa cho hệ số góc của mô hình hồi quy. [Kỹ năng 4.E]
DAT-3.N.1 Một quyết định chính thức so sánh giá trị $p$ với mức ý nghĩa $\alpha$. Nếu giá trị $p$ nhỏ hơn hoặc bằng $\le \alpha$, thì bác bỏ giả thuyết không, $H_0 : \beta = \beta_0$. Nếu giá trị $p$ lớn hơn $> \alpha$, thì không bác bỏ giả thuyết không.
DAT-3.N.2 Kết quả của bài kiểm tra ý nghĩa cho hệ số góc của mô hình hồi quy có thể đóng vai trò là lập luận thống kê để hỗ trợ câu trả lời cho một câu hỏi nghiên cứu về mẫu đó.
Source: College Board AP Course and Exam Description · Nguồn: Mô tả Khóa học và Bài thi College Board AP
English
The slope $t$ statistic:
$$t=\frac{b-0}{SE_b},\qquad df=n-2.$$
Both $b$ and $SE_b$ come straight from the regression output. Find the $p$-value from the $t$-distribution, compare to $\alpha$, and conclude in context – evidence (or not) of a linear relationship between the two variables.
Watch the tails. Regression output always prints the two-tailed$p$-value (for $H_a:\beta\neq 0$). If your $H_a$ is one-tailed, halve it – and first check the sample slope really points the way $H_a$ claims; if it points the other way, the one-tailed $p$-value is above $0.5$ and you cannot reject $H_0$.
Worked example. For the same output ($b=2.5$, $SE_b=0.8$, $n=20$), test $H_0:\beta=0$:
$$t=\frac{2.5-0}{0.8}=3.13,\qquad df=18,$$
a small $p$-value ($<0.01$), so reject $H_0$ – convincing evidence of a linear relationship. This matches the interval, which excluded $0$.
Tiếng Việt
Thống kê độ dốc $t$:
$$t=\frac{b-0}{SE_b},\qquad df=n-2.$$
Cả hai $b$ và $SE_b$ đều lấy trực tiếp từ kết quả hồi quy. Tìm giá trị $p$ từ phân phối $t$, so sánh với $\alpha$, và đưa ra kết luận trong ngữ cảnh – bằng chứng (hoặc không có) về mối quan hệ tuyến tính giữa hai biến.
Lưu ý phần đuôi. Kết quả hồi quy luôn in giá trị $p$hai-đuôi (cho $H_a:\beta\neq 0$). Nếu $H_a$ của bạn là một-đuôi, hãy chia đôi nó – và trước tiên hãy kiểm tra xem độ dốc mẫu thực sự chỉ hướng theo cách mà $H_a$ tuyên bố hay không; nếu nó chỉ hướng ngược lại, giá trị $p$ một-đuôi sẽ nằm trên $0.5$ và bạn không thể bác bỏ $H_0$.
Ví dụ đã giải. Đối với cùng đầu ra ($b=2.5$, $SE_b=0.8$, $n=20$), kiểm tra $H_0:\beta=0$:
$$t=\frac{2.5-0}{0.8}=3.13,\qquad df=18,$$
một giá trị $p$ nhỏ ($<0.01$), vì vậy bác bỏ $H_0$ – bằng chứng thuyết phục về mối quan hệ tuyến tính. Điều này phù hợp với khoảng tin cậy, đã loại trừ $0$.
9.6
Selecting the Right Procedure · Chọn Thủ续 Phù Hợp
Syllabus · Chương trình
English
This topic is intended to focus on the skill of selecting an appropriate inference procedure now that students have a range of options. Students should be given opportunities to practice when and how to apply all learning objectives relating to inference.
Tiếng Việt
Chủ đề này nhằm tập trung vào kỹ năng lựa chọn thủ tục suy luận phù hợp khi học sinh đã có sẵn một loạt các tùy chọn. Học sinh nên được tạo cơ hội thực hành khi nào và làm thế nào để áp dụng tất cả các mục tiêu học tập liên quan đến suy luận.
Source: College Board AP Course and Exam Description · Nguồn: Mô tả Khóa học và Bài thi College Board AP
English
Across all of inference, identify: what is estimated or claimed (a proportion, a mean, a difference, a distribution of counts, or a slope), how many samples, and which design (independent or paired; sample or experiment). Then name the procedure, verify its conditions, carry it out, and communicate the conclusion with the statistic, the $p$-value or interval, and a plain-language answer in context. This selecting-and-communicating skill is what the investigative-task question rewards most.
Tiếng Việt
Trong toàn bộ suy luận thống kê, xác định: điều gì được ước lượng hoặc tuyên bố (tỷ lệ, trung bình, hiệu số, phân phối tần số, hay độ dốc), bao nhiêu mẫu, và loại thiết kế nào (độc lập hay cặp; mẫu hay thí nghiệm). Sau đó đặt tên cho quy trình, kiểm tra các điều kiện, tiến hành thực hiện, và truyền đạt kết luận với thống kê, giá trị $p$ hoặc khoảng tin cậy, cùng câu trả lời bằng ngôn ngữ thông thường trong ngữ cảnh. Kỹ năng chọn lọc và truyền đạt này chính là điểm mấu chốt mà câu hỏi về nhiệm vụ khám phá đánh giá cao nhất.
9.6
Exam tips · Mẹo làm bài thi
English
Inference for a slope tests whether the true slope is $0$ (no linear relationship).
If a slope's confidence interval includes 0, you cannot conclude a real linear relationship – the variables may still be related in a curved way.
Read the slope, standard error, t-statistic, and p-value straight from computer output – but the printed p-value is two-tailed, so halve it for a one-tailed $H_a$.
Check the regression conditions (linearity, independence, roughly normal residuals, equal spread) via the residual plot.
Interpret the interval and test in context, tied to the true slope.
Tiếng Việt
Suy luận cho độ dốc kiểm tra xem độ dốc thực có phải là $0$ (không có mối quan hệ tuyến tính) không.
Nếu khoảng tin cậy của độ dốc bao gồm 0, bạn không thể kết luận có mối quan hệ tuyến tính thực – các biến vẫn có thể liên quan theo cách cong.
Đọc độ dốc, sai số chuẩn, thống kê t, và p-value trực tiếp từ đầu ra máy tính – nhưng p-value in sẵn là hai đuôi, vì vậy hãy chia đôi nó cho một kiểm tra một đuôi $H_a$.
Kiểm tra các điều kiện hồi quy (tuyến tính, độc lập, phần dư xấp xỉ normal, equal spread) qua biểu đồ phần dư.
Diễn giải khoảng tin cậy và kiểm tra trong ngữ cảnh, gắn liền với độ dốc thực.
Interactive lessons on this topic · Bài học tương tác về chủ đề này
Work through it step by step, with instant-check exercises. · Làm theo từng bước, kèm theo bài tập kiểm tra ngay lập tức.
Pick one and the site follows you — notes, papers, videos and practice all open on it. · Chọn một môn và trang sẽ điều hướng theo — ghi chú, tài liệu, video và bài tập đều mở ở đó.
Type to search notes, lessons, code, vocabulary and past-paper questions across every subject. · Nhập để tìm ghi chú, bài học, mã, từ vựng và câu hỏi đề thi cũ trên mọi môn học.