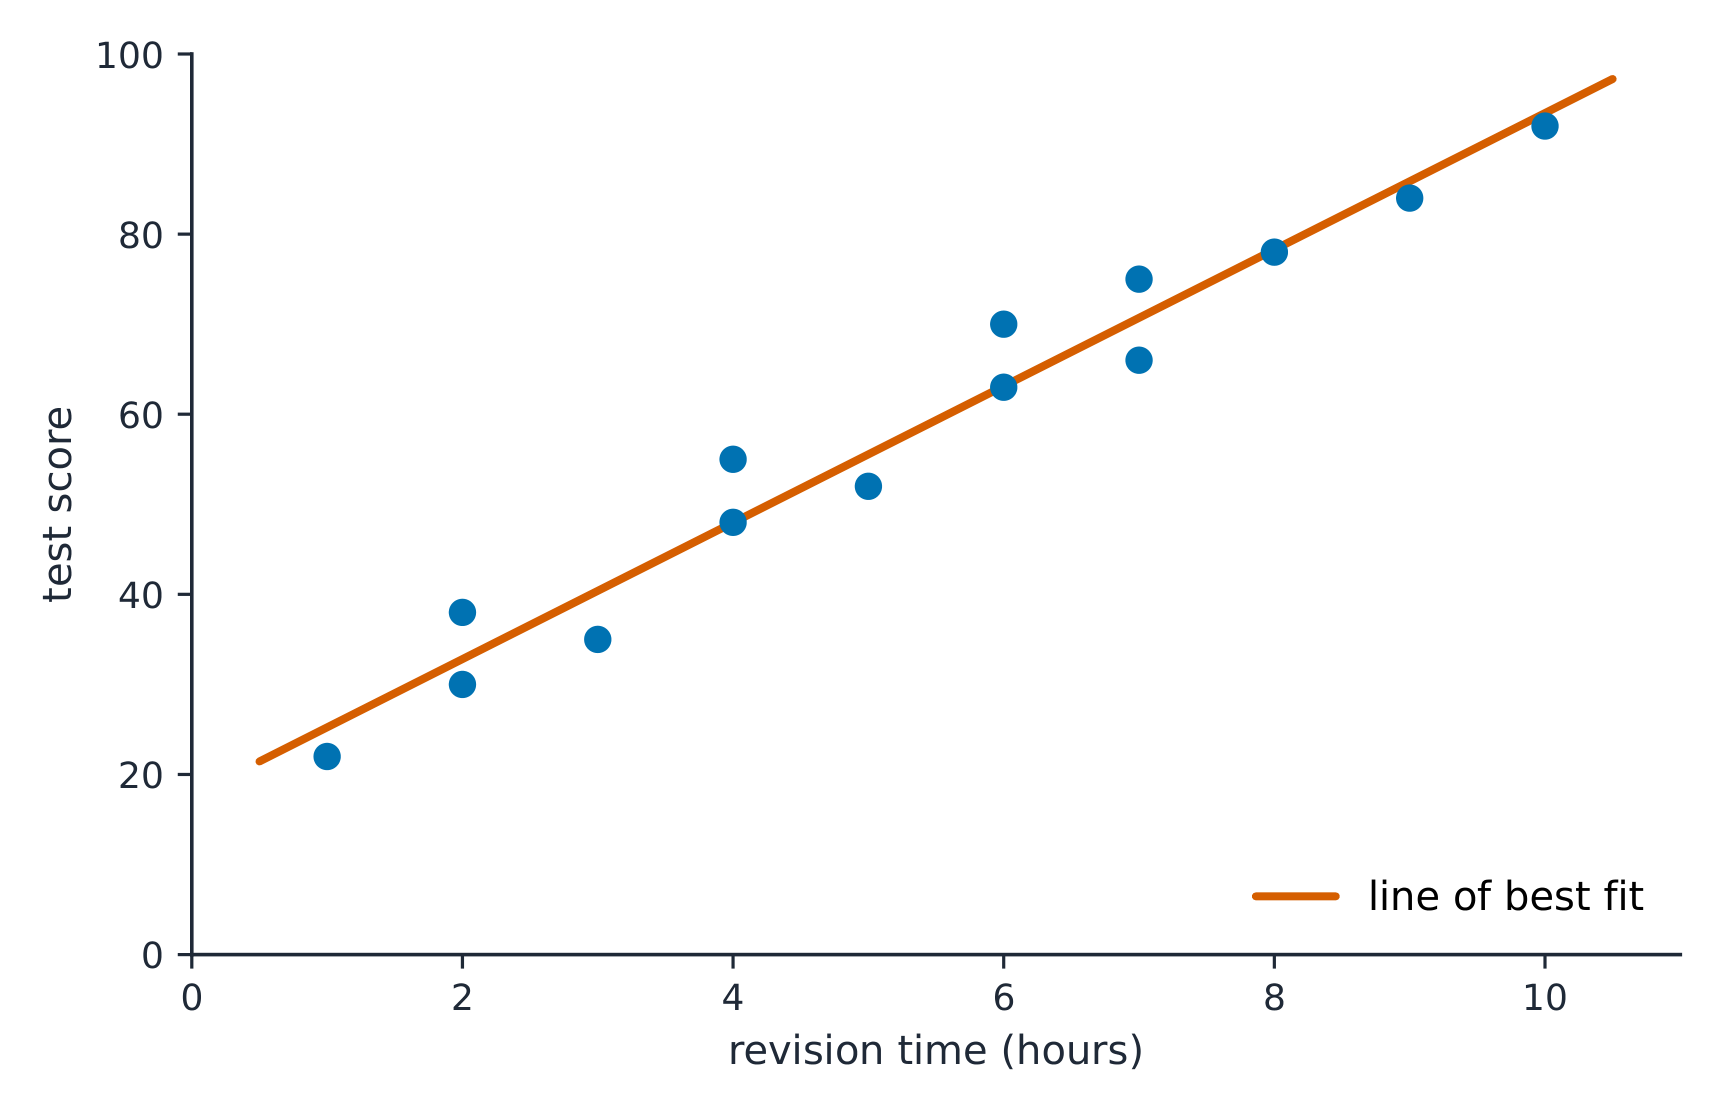
הנה כיתה אחת על גרף פיזור: שעות לימוד לאורך התחתית, ציון במבחן בצד העליון. קו המתאים הטוב עולה. אבל זו רק כיתה אחת. קח…
English narration · English + 中文 subtitles burned in · קריאת קול באנגלית · תרגום אנגלי + סינית שרוף בתוך הסרטון
9.1
Do Those Points Align? · האם נקודות אלו נמצאות בקו?
Syllabus · סיילבוס
English
Enduring Understanding (VAR-1): Given that variation may be random or not, conclusions are uncertain.
Learning Objective VAR-1.K: Identify questions suggested by variation in scatter plots. [Skill 1.A]
VAR-1.K.1 Variation in points' positions relative to a theoretical line may be random or non-random.
עברית
הבנה מתמשכת (VAR-1): בשל כך ששינוי עשוי להיות אקראי או לא, המסקנות הן לא וודאות.
מטרת למידה VAR-1.K: זיהוי שאלות המוצעות על ידי תנודות בגרפי פיזור. [מיומנות 1.A]
VAR-1.K.1 תנודות במיקום הנקודות ביחס לקו תיאורתי עשויות להיות מקריות או שאינן מקריות.
Source: College Board AP Course and Exam Description · מקור: תיאור הקורס והמבחן של College Board AP
English
A sample scatterplot 散点图 gives a sample slope 样本斜率$b$ for the least-squares regression 回归 line – but a different sample would give a slightly different slope. So $b$ is a statistic with sampling variability 抽样变异性, estimating the true (population) slope 总体斜率$\beta$. This unit does inference 推断 for $\beta$: is there a real linear 线性 relationship, and how strong is it?
עברית
גרף פיזור לדוגמה נותן שיפוע לדוגמה$b$ עבור קו הרגרסיה של פחותים מרובעים – אך דגימה אחרת תניב שיפוע שונה מעט. לכן $b$ הוא סטטיסטיקה עם תנודת דגימה, המשמעת את השיפוע האמיתי (של אוכלוסייה)$\beta$. יחידה זו מבצעת חישוב עבור $\beta$: האם קיים קשר ליניארי אמיתי, וכמה חזק הוא?
9.2
Confidence Interval for a Slope · מרווח סמכות לשיפוע
Syllabus · סיילבוס
English
Enduring Understanding (UNC-4): An interval of values should be used to estimate parameters, in order to account for uncertainty.
Learning Objective UNC-4.AC: Identify an appropriate confidence interval procedure for a slope of a regression model. [Skill 1.D]
UNC-4.AC.1 Consider a response variable, $y$, that is linearly related to an explanatory variable, $x$. For a simple random sample of $n$ observations, the sample regression line, $\hat{y} = a + bx$, is an estimate of the population regression line $\mu_y = \alpha + \beta x$. For a particular observation, $(x_i, y_i)$, the residual from the sample regression line, $y_i - \hat{y}_i = y_i - (a + bx_i)$, is an estimate of $y_i - (\alpha + \beta x_i)$, the deviation of the response variable from the population regression line. For all points $(x, y)$ in the population, the standard deviation of all of the deviations of the response variable from the population regression line, $\sigma$, can be estimated by the standard deviation of the residuals from the sample regression line, $s = \sqrt{\dfrac{\sum\left(y_i - \hat{y}_i\right)^2}{n-2}}$. (Note: This formula uses $n-2$ in the denominator instead of $n-1$ because two parameters, $\alpha$ and $\beta$, must be estimated to obtain the predicted values from the least-squares regression line.)
UNC-4.AC.2 For a simple random sample of $n$ observations, let $b$ represent the slope of a sample regression line. Then the mean of the sampling distribution for $b$ equals the population slope: $\mu_b = \beta$. The standard deviation of the sampling distribution for $b$ is $\sigma_b = \dfrac{\sigma}{\sigma_x \sqrt{n}}$, where $\sigma_x = \sqrt{\dfrac{\sum\left(x_i - \bar{x}\right)^2}{n}}$.
UNC-4.AC.3 The appropriate confidence interval for the slope of a regression model is a $t$-interval for the slope.
Learning Objective UNC-4.AD: Verify the conditions to calculate confidence intervals for the slope of a regression model. [Skill 4.C]
UNC-4.AD.1 In order to calculate a confidence interval to estimate the slope of a regression line, we must check the following:
a. The true relationship between $x$ and $y$ is linear. Analysis of residuals may be used to verify linearity.
b. The standard deviation for $y$, $\sigma_y$, does not vary with $x$. Analysis of residuals may be used to check for approximately equal standard deviations for all $x$.
c. To check for independence:
i. Data should be collected using a random sample or a randomized experiment.
ii. When sampling without replacement, check that $n \le 10\% N$.
d. For a particular value of $x$, the responses ($y$-values) are approximately normally distributed. Analysis of graphical representations of residuals may be used to check for normality.
i. If the observed distribution is skewed, $n$ should be greater than 30.
Learning Objective UNC-4.AE: Determine the given margin of error for the slope of a regression model. [Skill 3.D]
UNC-4.AE.1 For the slope of a regression line, the margin of error is the critical value $\left(t^*\right)$ times the standard error ($SE$) of the slope.
UNC-4.AE.2 The standard error for the slope of a regression line with sample standard deviation, $s$, is $SE = \dfrac{s}{s_x \sqrt{n-1}}$, where $s$ is the estimate of $\sigma$ and $s_x$ is the sample standard deviation of the $x$ values.
Learning Objective UNC-4.AF: Calculate an appropriate confidence interval for the slope of a regression model. [Skill 3.D]
UNC-4.AF.1 The point estimate for the slope of a regression model is the slope of the line of best fit, $b$.
UNC-4.AF.2 For the slope of a regression model, the interval estimate is $b \pm t^* \left(SE_b\right)$.
עברית
הבנה מתמשכת (UNC-4): יש להשתמש בטווח ערכים כדי להעריך פרמטרים, כדי להתחשב בחוסר ודאות.
מטרת למידה UNC-4.AC: זיהוי הליך interval ביטחון מתאים למשיק של מודל רגרסיה. [מיומנות 1.D]
UNC-4.AC.1 שוקלים משתנה תגובה, $y$, הקשור בקו ישר למשתנה הסבר, $x$. לדגימה אקראית פשוטה של $n$ תצפיות, קו הרגרסיה בדוגמה, $\hat{y} = a + bx$, הוא הערכת קו הרגרסיה באוכלוסייה, $\mu_y = \alpha + \beta x$. עבור תצפית ספציפית, $(x_i, y_i)$, הפגוש מקו הרגרסיה בדוגמה, $y_i - \hat{y}_i = y_i - (a + bx_i)$, הוא הערכת $y_i - (\alpha + \beta x_i)$, הסטייה של משתנה התגובה מקו הרגרסיה באוכלוסייה. עבור כל הנקודות $(x, y)$ באוכלוסייה, הסטייה התקנית של כל הסטיות של משתנה התגובה מקו הרגרסיה באוכלוסייה, $\sigma$, ניתן להעריך על ידי הסטייה התקנית של הפגשים מקו הרגרסיה בדוגמה, $s = \sqrt{\dfrac{\sum\left(y_i - \hat{y}_i\right)^2}{n-2}}$. (הערה: נוסחה זו משתמשת ב-$n-2$ במכנה במקום ב-$n-1$ מכיוון שיש להעריך שני פרמטרים, $\alpha$ ו-$\beta$, כדי לקבל את הערכים המتوقعة מקו הרגרסיה של פחותים רבועים).
UNC-4.AC.2 עבור דגימה אקראית פשוטה של $n$ תצפיות, נתון כי $b$ מייצג את המשיק של קו הרגרסיה בדוגמה. אזי הממוצע של ההתפלגות הדגימה עבור $b$ שווה למשיק באוכלוסייה: $\mu_b = \beta$. הסטייה התקנית של ההתפלגות הדגימה עבור $b$ היא $\sigma_b = \dfrac{\sigma}{\sigma_x \sqrt{n}}$, כאשר $\sigma_x = \sqrt{\dfrac{\sum\left(x_i - \bar{x}\right)^2}{n}}$.
UNC-4.AC.3 interval הביטחון המתאים למשיק של מודל רגרסיה הוא interval $t$ למשיק.
מטרת למידה UNC-4.AD: אימות התנאים לחישוב intervalי ביטחון למשיק של מודל רגרסיה. [מיומנות 4.C]
UNC-4.AD.1 כדי לחשב interval ביטחון להערכת משיק של קו רגרסיה, עלינו לבדוק את הבא:
א. הקשר האמיתי בין $x$ ל-{$y$} הוא ליניארי. ניתן להשתמש בניתוח שאריות כדי לוודא ליניאריות.
ב. סטיית התקן עבור $y$, {$\sigma_y$}, אינה משתנה לפי $x$. ניתן להשתמש בניתוח שאריות לבדיקה כי סטיות תקן דומות בקירוב לכל $x$.
ג. לבדיקת עצמאות:
i. הנתונים צריכים להיות אסופים באמצעות דגימה אקראית או ניסוי מקומי (Randomized Experiment).
ii. כאשר דוגמה נלקחת ללא החזרה, בדוק כי $n \le 10\% N$.
ד. עבור ערך מסוים של $x$, התגובות (ערכי {$y$}) מתפלגות באופן קרוב לתקינות. ניתן להשתמש בייצוגים גרפיים של שאריות לבדיקת תקינות.
i. אם ההתפלגות הנצפית היא אסימטרית, $n$ צריך להיות גדול מ-30.
מטרת למידה UNC-4.AE: קביעת מרווח השגיאה הנתון שיפוע של דגם רגרסיה. [כישור 3.D]
UNC-4.AE.1 עבור שיפוע של קו רגרסיה, שגיאת המרווח היא הערך הקריטי $\left(t^*\right)$ כפול השגיאה הסטנדרטית ({$SE$}) של השיפוע.
UNC-4.AE.2 השגיאה הסטנדרטית לשיפוע של קו רגרסיה עם סטיית תקן מדגם, {$s$}, היא {$SE = \dfrac{s}{s_x \sqrt{n-1}}$}, כאשר $s$ הוא הערכת $\sigma$ ו-{$s_x$} היא סטיית התקן של המדגם של ערכי {$x$}.
מטרת למידה UNC-4.AF: חישוב מרווח ביטחון מתאים לשיפוע של דגם רגרסיה. [כישור 3.D]
UNC-4.AF.1 הערכת הנקודה עבור שיפוע של דגם רגרסיה היא שיפוע קו ההתאמה הטובה ביותר, $b$.
UNC-4.AF.2 עבור שיפוע של דגם רגרסיה, הערכת המרווח היא $b \pm t^* \left(SE_b\right)$.
Source: College Board AP Course and Exam Description · מקור: תיאור הקורס והמבחן של College Board AP
English
A $t$ interval for the true slope $\beta$:
$$b\pm t^{*}\,SE_b,\qquad df=n-2,$$
where $b$ is the sample slope and $SE_b$ its standard error (read from computer output). Conditions (LINER): the true relationship is Linear, observations Independent, residuals Normal, and residuals have Equal spread (check the residual plot and a histogram of residuals), from Random data. Interpret the interval for $\beta$ in context, with units of $y$ per unit of $x$.
The residual plot 残差图 is where you check Linear and Equal-spread: you want a formless cloud around zero. A curve means the relationship is not linear; a fan (spread growing with $x$) means the residuals do not have equal spread – both break a condition.
Worked example. Regression output gives slope $b=2.5$ with $SE_b=0.8$ from $n=20$ points. For a $95\%$ interval, $df=18$ gives $t^*=2.101$:
$$2.5\pm2.101(0.8)=2.5\pm1.68=(0.82,\ 4.18).$$
Because $0$ is not in the interval, there is evidence of a positive linear relationship.
עברית
מפסר סמך $t$ לשיפוע האמיתי $\beta$:
$$b\pm t^{*}\,SE_b,\qquad df=n-2,$$
כאן $b$ הוא שיפוע הדוגמה ו-$SE_b$ ה-שגיאה הסטנדרטית שלו (קריאה מתוצאות המחשב). תנאים (LINER): הקשר האמיתי הוא ליניארי, התצפיות בין עצמן בלתי תלויות, שאריות נורמליות, לשאריות פיזור שווה (בדיקה באמצעות גרף השאריות וההיסטוגרמה של השאריות), ומנתח אקראי. יש לפרש את המרווח עבור $\beta$ בהקשר, עם יחידות של $y$ ליחידת $x$.
גרף שאריות אקראי וללא תבנית תומך בתנאים; עקומה או משפך אינם תומכים
גרף השאריות הוא המקום בו בודקים תנאי ליניאריות ופיזור שווה: יש להשיג צורת ענן חסרת צורה סביב אפס. עקומה מעידה על כך שהקשר אינו ליניארי; משפך (הפיזור גדל ככל ש-$x$ גדל) מעיד על כך לשאריות אין פיזור שווה – שתיהם מפרים תנאי.
דוגמה פותרת. תוצאות הרגרסיה נותנות שיפוע $b=2.5$ עם $SE_b=0.8$ ממ $n=20$ נקודות. עבור מרווח $95\%$, $df=18$ נותן $t^*=2.101$:
$$2.5\pm2.101(0.8)=2.5\pm1.68=(0.82,\ 4.18).$$
מכיוון ש-$0$אינו נמצא במרווח, קיים ראיה לקשר ליניארי חיובי.
הסקת שיפוע מבוססת על ישר הרגרסיה למינימום ריבועים העובר דרך הנקודותריגרסיה של סכום הריבועים הקטנים: הקו שממזער את סכום השאריות המרובעות
Explore · חקור
Inference for a regression slope · סקירה לגרם נטיית רגרסיה
The sample slope varies from sample to sample; a confidence interval and t-test ask whether the true slope could be zero (no linear relationship). · הנטייה בדגימה משתנה מדגימה לדגימה; מרווח סמך ובדיקת t בודקים האם הנטייה האמיתית יכולה להיות אפס (ללא קשר ליניארי).
Justifying a Claim About a Slope · נימוק לטענה לגבי שיפוע
Syllabus · סיילבוס
English
Enduring Understanding (UNC-4): An interval of values should be used to estimate parameters, in order to account for uncertainty.
Learning Objective UNC-4.AG: Interpret a confidence interval for the slope of a regression model. [Skill 4.B]
UNC-4.AG.1 In repeated random sampling with the same sample size, approximately C% of confidence intervals created will capture the slope of the regression model, i.e., the true slope of the population regression model.
UNC-4.AG.2 An interpretation for a confidence interval for the slope of a regression line should include a reference to the sample taken and details about the population it represents.
Learning Objective UNC-4.AH: Justify a claim based on a confidence interval for the slope of a regression model. [Skill 4.D]
UNC-4.AH.1 A confidence interval for the slope of a regression model provides an interval of values that may provide sufficient evidence to support a particular claim in context.
Learning Objective UNC-4.AI: Identify the effects of sample size on the width of a confidence interval for the slope of a regression model. [Skill 4.A]
UNC-4.AI.1 When all other things remain the same, the width of the confidence interval for the slope of a regression model tends to decrease as the sample size increases.
עברית
הבנה מתמשכת (UNC-4): יש להשתמש בטווח ערכים כדי להעריך פרמטרים, כדי להתחשב בחוסר ודאות.
מטרת למידה UNC-4.AG: פרשנות מרווח ביטחון לשיפוע של דגם רגרסיה. [כישור 4.B]
UNC-4.AG.1 במדידות אקראיות חוזרות עם אותו גודל מדגם, כ-C% ממרווחי הביטחון שנבנו יכללו את שיפוע דגם הרגרסיה, כלומר את השיפוע האמיתי של דגם הרגרסיה באוכלוסייה.
UNC-4.AG.2 פרשנות למרווח ביטחון לשיפוע של קו רגרסיה צריכה להכיל התייחסות למדגם שנלקח ולפרטים על האוכלוסייה שהוא מייצג.
מטרת למידה UNC-4.AH: נימוק טענה על בסיס מרווח ביטחון לשיפוע של דגם רגרסיה. [כישור 4.D]
UNC-4.AH.1 מרווח ביטחון לשיפוע של דגם רגרסיה מספק מרווח ערכים שעשוי לספק עדות מספקת לתמיכה בטענה מסוימת בהקשר נתון.
מטרת למידה UNC-4.AI: זיהוי השפעות גודל המדגם על רוחב מרווח הביטחון לשיפוע של דגם רגרסיה. [כישור 4.A]
UNC-4.AI.1 כאשר כל הדברים האחרים נשארים זהים, רוחב מרווח הביטחון לשיפוע של דגם רגרסיה נוטה לצמצום כאשר גודל המדגם גדל.
Source: College Board AP Course and Exam Description · מקור: תיאור הקורס והמבחן של College Board AP
English
If the confidence interval for $\beta$ contains $0$, a slope of zero is plausible – no evidence of a linear relationship. If the interval is entirely positive or negative, there is evidence of a real (positive or negative) linear relationship. State the direction in context.
עברית
אם מרווח הביטחון עבור $\beta$ מכיל $0$, שיפוע של אפס הוא סביר – אין עדות לקשר ליניארי. אם המרווח חיובי או שלילי לחלוטין, קיימת עדות לקשר ליניארי אמיתי (חיובי או שלילי). ציין את הכיוון בהקשר.
9.4
Setting Up a Test for a Slope · הגדרת בדיקה לשיפוע
Syllabus · סיילבוס
Enduring Understanding
Learning Objective
Essential Knowledge
VAR-7
The $t$-distribution may be used to model variation.
VAR-7.J
Identify the appropriate selection of a testing method for a slope of a regression model. [Skill 1.E]
VAR-7.J.1 The appropriate test for the slope of a regression model is a $t$-test for a slope.
VAR-7.K
Identify appropriate null and alternative hypotheses for a slope of a regression model. [Skill 1.F]
VAR-7.K.1 The null hypothesis for a $t$-test for a slope is: $H_0 : \beta = \beta_0$, where $\beta_0$ is the hypothesized value from the null hypothesis. The alternative hypothesis is $H_0 : \beta < \beta_0$ or $H_0 : \beta > \beta_0$, or $H_0 : \beta \neq \beta_0$.
VAR-7.L
Verify the conditions for the significance test for the slope of a regression model. [Skill 4.C]
VAR-7.L.1 In order to make statistical inferences when testing for the slope of a regression model, we must check the following:
a. The true relationship between $x$ and $y$ is linear. Analysis of residuals may be used to verify linearity.
b. The standard deviation for $y$, $\sigma_y$, does not vary with $x$. Analysis of residuals may be used to check for approximately equal standard deviations for all $x$.
c. To check for independence:
i. Data should be collected using a random sample or a randomized experiment.
ii. When sampling without replacement, check that $n \le 10\% N$.
d. For a particular value of $x$, the responses ($y$-values) are approximately normally distributed. Analysis of graphical representations of residuals may be used to check for normality.
i. If the observed distribution is skewed, $n$ should be greater than 30.
ii. If the sample size is less than 30, the distribution of the sample data should be free from strong skewness and outliers.
Source: College Board AP Course and Exam Description · מקור: תיאור הקורס והמבחן של College Board AP
English
The usual test asks whether there is any linear relationship:
$$H_0:\beta=0 \quad(\text{no linear relationship})\qquad H_a:\beta\neq 0 \ (\text{or } <,\,>).$$
Check the LINER conditions. This is a $t$-test on the slope.
עברית
הבדיקה הרגילה שואלת האם קיים קשר ליניארי כלשהו:
$$H_0:\beta=0 \quad(\text{no linear relationship})\qquad H_a:\beta\neq 0 \ (\text{or } <,\,>).$$
בדוק תנאי LINER. זוהי בדיקת $t$ על השיפוע.
בדוק פלטות שאריות לפני שהתלית במרווח ביטחון או בבדיקת שיפוע
9.5
Carrying Out a Test for a Slope · ביצוע בדיקה לשיפוע
Syllabus · סיילבוס
English
Enduring Understanding (VAR-7): The $t$-distribution may be used to model variation.
Learning Objective VAR-7.M: Calculate an appropriate test statistic for the slope of a regression model. [Skill 3.E]
VAR-7.M.1 The distribution of the slope of a regression model assuming all conditions are satisfied and the null hypothesis is true (null distribution) is a $t$-distribution.
VAR-7.M.2 For simple linear regression when random sampling from a population for the response that can be modeled with a normal distribution for each value of the explanatory variable, the sampling distribution of $t = \dfrac{b - \beta}{SE_b}$ has a $t$-distribution with degrees of freedom equal to $n - 2$. When testing the slope in a simple linear regression model with one parameter, the slope, the test for the slope has $df = n - 1$.
Enduring Understanding (DAT-3): Significance testing allows us to make decisions about hypotheses within a particular context.
Learning Objective DAT-3.M: Interpret the $p$-value of a significance test for the slope of a regression model. [Skill 4.B]
DAT-3.M.1 An interpretation of the $p$-value of a significance test for the slope of a regression model should recognize that the $p$-value is computed by assuming that the null hypothesis is true, i.e., by assuming that the true population slope is equal to the particular value stated in the null hypothesis.
Learning Objective DAT-3.N: Justify a claim about the population based on the results of a significance test for the slope of a regression model. [Skill 4.E]
DAT-3.N.1 A formal decision explicitly compares the $p$-value to the significance $\alpha$. If the $p$-value $\le \alpha$, then reject the null hypothesis, $H_0 : \beta = \beta_0$. If the $p$-value $> \alpha$, then fail to reject the null hypothesis.
DAT-3.N.2 The results of a significance test for the slope of a regression model can serve as the statistical reasoning to support the answer to a research question about that sample.
עברית
הבנה מתמשכת (VAR-7): ההתפלגות $t$ יכולה לשמש לדגום תנודת.
מטרת הלמידה VAR-7.M: חישוב סטטיסטות מבחן מתאימה לשיפוע של מודל רגרסיה. [מיומנות 3.E]
VAR-7.M.1 החלוקה של שיפוע של מודל רגרסיה בהנחה שכל התנאים מתקיימים וההנחה האפס נכונה (חלוקת אפס) היא חלוקת $t$.
VAR-7.M.2 לגבי רגרסיה ליניארית פשוטה כאשר דגימה אקראית מתוך אוכלוסייה לתגובה שאפשר לדגם בחלוקה נורמלית עבור כל ערך של המשתנה המסביר, חלוקת הדגימה של $t = \dfrac{b - \beta}{SE_b}$ היא בעלת חלוקת $t$ עם דרגות חופש השוות ל$n - 2$. במהלך בדיקת השיפוע במודל רגרסיה ליניארית פשוטה עם פרמטר אחד, השיפוע, המבחן לשיפוע יש $df = n - 1$.
הבנה מתמשכת (DAT-3): בדיקת משמעות מאפשרת לנו לקבל החלטות לגבי הנחות בתוך הקשר נתון.
מטרת הלמידה DAT-3.M: פרשנות הערך $p$ של מבחן משמעותיות לשיפוע של מודל רגרסיה. [מיומנות 4.B]
DAT-3.M.1 פרשנות הערך $p$ של מבחן משמעותיות לשיפוע של מודל רגרסיה צריכה להכיר בכך שהערך $p$ מחושב בהנחה שההנחה האפס נכונה, כלומר, בהנחה שהשיפוע האמיתי באוכלוסייה שווה לערך הספציפי המצוין בהנחה האפס.
מטרת הלמידה DAT-3.N: הצדעת טענה על האוכלוסייה בהתבסס על תוצאות מבחן משמעותיות לשיפוע של מודל רגרסיה. [מיומנות 4.E]
DAT-3.N.1 החלטה פורמלית مقارנת במפורש את הערך $p$ לרמת משמעות $\alpha$. אם הערך $p$$\le \alpha$, אז דוחים את ההנחה האפס, $H_0 : \beta = \beta_0$. אם הערך $p$$> \alpha$, אז לא דוחים את ההנחה האפס.
DAT-3.N.2 תוצאות מבחן משמעותיות לשיפוע של מודל רגרסיה יכולות לשמש כהיחס הסטטיסטי לתמיכה בתשובה לשאלת מחקר על דוגמה זו.
Source: College Board AP Course and Exam Description · מקור: תיאור הקורס והמבחן של College Board AP
English
The slope $t$ statistic:
$$t=\frac{b-0}{SE_b},\qquad df=n-2.$$
Both $b$ and $SE_b$ come straight from the regression output. Find the $p$-value from the $t$-distribution, compare to $\alpha$, and conclude in context – evidence (or not) of a linear relationship between the two variables.
Watch the tails. Regression output always prints the two-tailed$p$-value (for $H_a:\beta\neq 0$). If your $H_a$ is one-tailed, halve it – and first check the sample slope really points the way $H_a$ claims; if it points the other way, the one-tailed $p$-value is above $0.5$ and you cannot reject $H_0$.
Worked example. For the same output ($b=2.5$, $SE_b=0.8$, $n=20$), test $H_0:\beta=0$:
$$t=\frac{2.5-0}{0.8}=3.13,\qquad df=18,$$
a small $p$-value ($<0.01$), so reject $H_0$ – convincing evidence of a linear relationship. This matches the interval, which excluded $0$.
עברית
סטטיסת השיפוע $t$:
$$t=\frac{b-0}{SE_b},\qquad df=n-2.$$
כל $b$ ו-$SE_b$ מגיעים ישירות מתוצאות הריגרסיה. מצא את ערך ה-$p$ מהתפלגות ה-$t$, השווה ל-$\alpha$, והסקן בהקשר – עדות (או אי-עדויות) לקשר ליניארי בין המשתנים.
התמקדו בזנבות ההתפלגות. תוצאות רגרסיה מודפסות תמיד ערך-$p$ דו-צדדי (עבור $H_a:\beta\neq 0$). אם ערך ה-$H_a$ שלכם הוא חד-צדדי, חציו – אך קודם לכן ודאו שהשיפוע במדגם אכן מצביע לכיוון מה ש-$H_a$ טוען; אם הוא מצביע לכיוון השני, ערך ה-$p$ החד-צדדי גבוה מ-$0.5$ ואי אפשר לדחות את ה-$H_0$.
דוגמה פותרת. עבור אותן התוצאות ($b=2.5$, $SE_b=0.8$, $n=20$), בדוק את $H_0:\beta=0$:
$$t=\frac{2.5-0}{0.8}=3.13,\qquad df=18,$$
ערך ⟨$p$⟩ קטן ($<0.01$), ולכן דוחים את $H_0$ – עדות משכנעת לקשר ליניארי. זה תואם את המרווח, שכלל את $0$.
9.6
Selecting the Right Procedure · בחירת הprocedure הנכון
Syllabus · סיילבוס
English
This topic is intended to focus on the skill of selecting an appropriate inference procedure now that students have a range of options. Students should be given opportunities to practice when and how to apply all learning objectives relating to inference.
עברית
נושא זה נועד להתמקד במיומנות בחירת הליך אינפראנס מתאים כעת שיש לסטודנטים מגוון אפשרויות. הסטודנטים צריכים לקבל הזדמנויות לתרגול מתי וכיצד ליישם את כל מטרות הלמידה הקשורות לאינפראנס.
Source: College Board AP Course and Exam Description · מקור: תיאור הקורס והמבחן של College Board AP
English
Across all of inference, identify: what is estimated or claimed (a proportion, a mean, a difference, a distribution of counts, or a slope), how many samples, and which design (independent or paired; sample or experiment). Then name the procedure, verify its conditions, carry it out, and communicate the conclusion with the statistic, the $p$-value or interval, and a plain-language answer in context. This selecting-and-communicating skill is what the investigative-task question rewards most.
עברית
בכל תחום האינפרנס, זיהה: מה מעומס או נטען (פרופורציה, ממוצע, הפרש, התפלגות ספירה, או שיפוע), כמה דגימות, ואיזה עיצוב (בלתי תלוי או זוגי; דגימה או ניסוי). לאחר מכן, נסה את שם הprocedure, ודא את תנאיו, ביצע אותו, ותקשור את המסקנה עם הסטטיסטיקה, ערך ה-$p$ או המרווח, ותשובה בשפה פשוטה בהקשר. מיומנות זו של בחירה ותקשורת היא מה שהשאלה על משימה חקירתית מעריכה ביותר.
9.6
Exam tips · טיפים לבחינות
English
Inference for a slope tests whether the true slope is $0$ (no linear relationship).
If a slope's confidence interval includes 0, you cannot conclude a real linear relationship – the variables may still be related in a curved way.
Read the slope, standard error, t-statistic, and p-value straight from computer output – but the printed p-value is two-tailed, so halve it for a one-tailed $H_a$.
Check the regression conditions (linearity, independence, roughly normal residuals, equal spread) via the residual plot.
Interpret the interval and test in context, tied to the true slope.
עברית
אינפרנס עבור שיפוע בודק האם השיפוע האמיתי הוא $0$ (אין קשר ליניארי).
אם מרווח הביטחון של שיפוע כולל 0, לא ניתן להסיק על קשר ליניארי אמיתי – המשתנים עשויים להיות קשורים בצורה מעגלית.
קרא את השיפוע, שגיאת התקן, סטטיסת t וערך p ישירות מתוצאות המחשב – אך ערך ה-p המודפס הוא דו-צדי, ולכן חלק אותו למחצה עבור בדיקה חד-צדית של $H_a$.
בדוק את תנאי הרגרסיה (קויות, עצמאות, שאריות קרובות לתפלגות נורמלית, פיזור שווה) באמצעות גרף השאריות.
פרשן את המרווח ובצע בדיקה בהקשר, בקשר לשיפוע האמיתי.
Interactive lessons on this topic · שיעורים אינטראקטיביים בנושא זה
Work through it step by step, with instant-check exercises. · לעבור על הדברים צעד אחר צעד, עם תרגילים לבדיקה מיידית.
Pick one and the site follows you — notes, papers, videos and practice all open on it. · בחרו נושא אחד והאתר יעקוב אחריו — הערות, מסמכים, וידאו ותרגולים פתוחים בו.
Type to search notes, lessons, code, vocabulary and past-paper questions across every subject. · הקלד כדי לחפש הערות, שיעורים, קוד, אוצר מילים ושאלות מבחנים בכל הנושאים.