| Enduring Understanding | Learning Objective | Essential Knowledge |
|---|---|---|
MOD-1 | MOD-1.A |
|
Basic Economic Concepts
AP Macroeconomics · Topic 1
 7:30
Basic Economic Concepts
Here is a result that feels wrong the first time you meet it. Suppose you are faster than your friend at writing code and faster at writing documentation. You…
English narration · English + 中文 subtitles burned in
1.1
Scarcity

Syllabus
Source: College Board AP Course and Exam Description
In April 2020, General Motors turned part of its plant in Kokomo, Indiana – a factory that made electronics for cars – into a line building hospital ventilators. Every ventilator made there was a batch of car parts not made. No society can have everything it wants, so every use of a resource is a choice against another use. That is where economics starts.
Economics 经济学 begins with scarcity 稀缺性: people's wants are unlimited, but the resources 资源 to satisfy them are limited. The resources – the factors of production 生产要素 – are land, labor 劳动, capital 资本, and entrepreneurship 企业家才能. Scarcity forces every society to choose what, how, and for whom to produce, and it makes trade-offs 权衡 unavoidable.
Who makes the choices? In a market economy 市场经济 the "what, how and for whom" questions are answered mostly by prices and private decisions; in a command economy 计划经济 a government plans them. Real economies, including the US and China, are mixed economies 混合经济: markets decide most production, and government provides things such as defence, roads and schooling.
Explore
Which factor of production?
Every resource is a factor of production — land, labour, capital, or entrepreneurship. Sorting them is the first step in thinking about scarcity.
Vocabulary
Train
| English |
|---|
| Economics/ˌiːkəˈnɒmɪks/ |
| scarcity/ˈskeəsɪti/ |
| resources/rɪˈzɔːsɪz/ |
| factors of production/ˈfæktəz ɒv prəˈdʌkʃn/ |
| labor/ˈleɪbə/ |
| capital/ˈkæpɪtl/ |
| entrepreneurship/ˌɒntrɪprəˈnjʊəʃɪp/ |
| trade-offs/treɪd ɒfs/ |
| market economy/ˈmɑːkɪt ɪˈkɒnəmi/ |
| command economy/kəˈmænd ɪˈkɒnəmi/ |
| mixed economy/mɪkst ɪˈkɒnəmi/ |
1.2
Opportunity Cost and the Production Possibilities Curve (PPC)

Syllabus
| Enduring Understanding | Learning Objective | Essential Knowledge |
|---|---|---|
MOD-1 | MOD-1.B |
|
Source: College Board AP Course and Exam Description
Every choice has an opportunity cost 机会成本 – the value of the next-best alternative given up. The production possibilities curve (PPC) 生产可能性曲线 shows the maximum combinations of two goods an economy can make when resources are fully and efficiently used.
- Points on the curve are efficient; inside, inefficient (unemployed resources); outside, unattainable.
- The downward slope shows opportunity cost; a bowed-out curve shows increasing opportunity cost.
- More resources or better technology cause economic growth 经济增长, shifting the PPC outward.
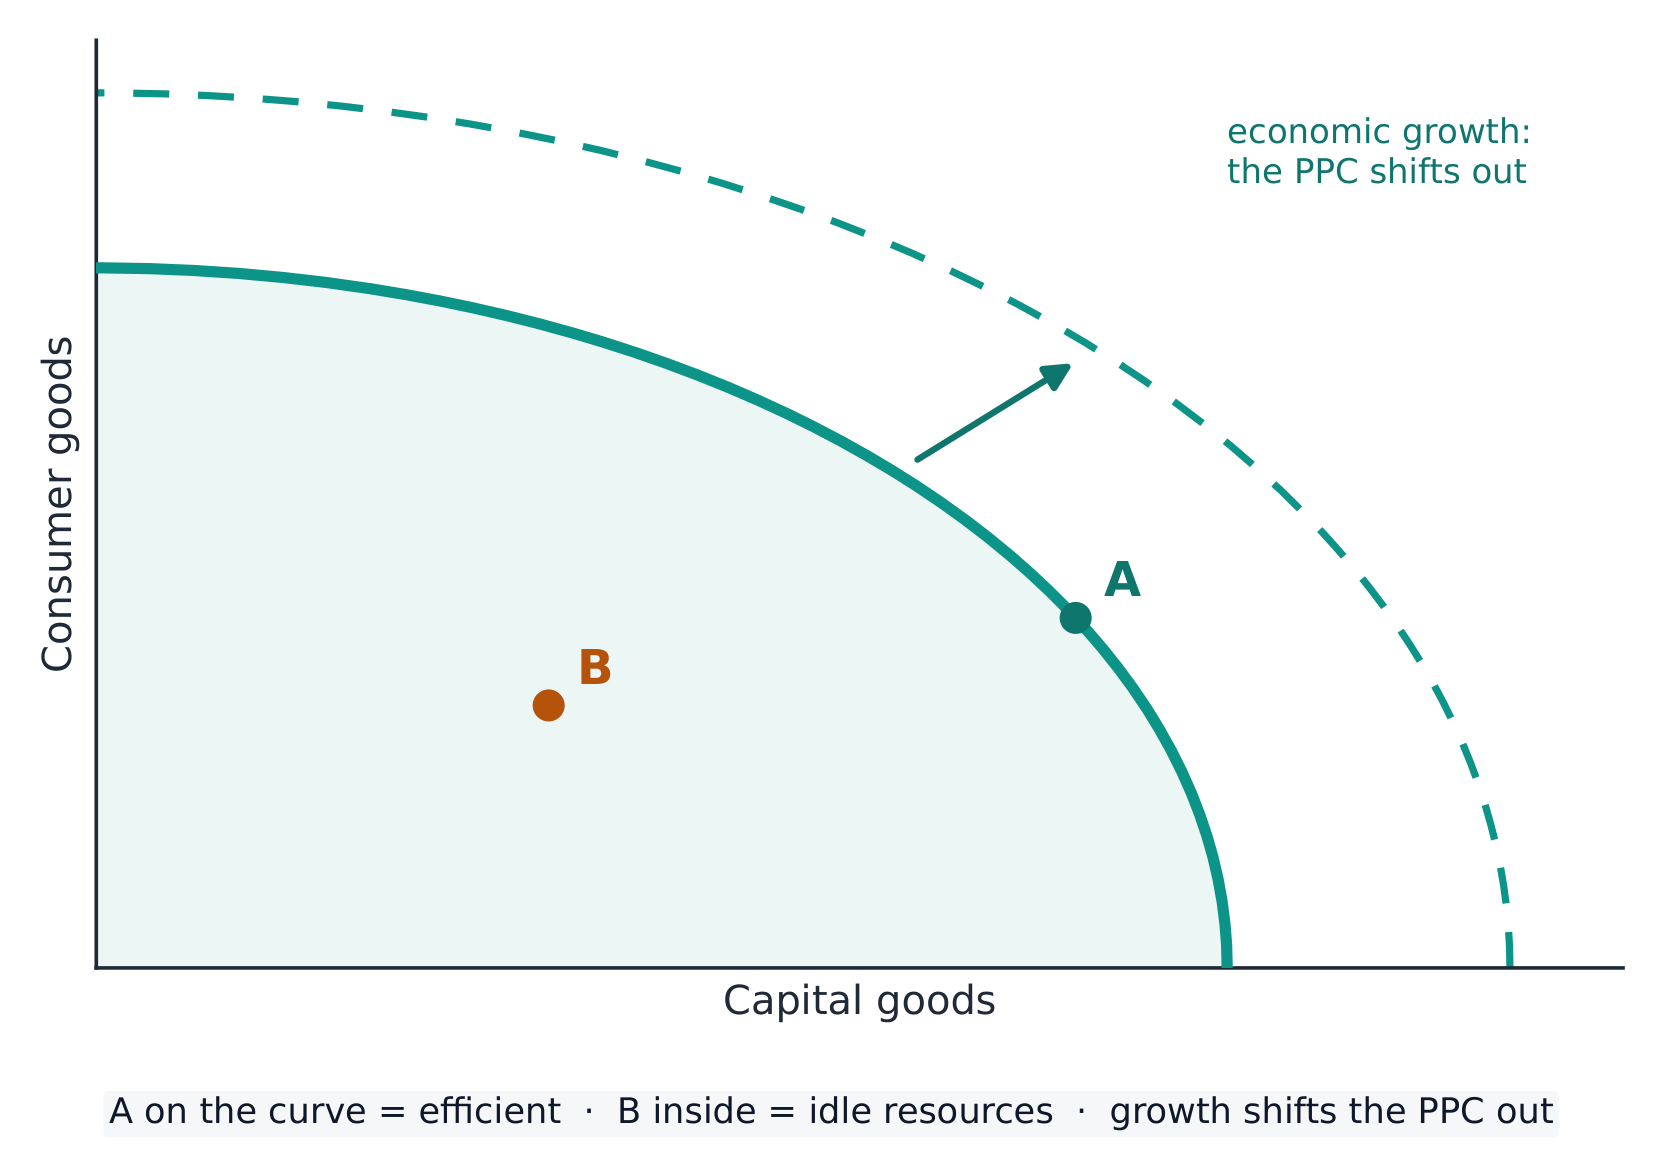
Reading a PPC with numbers. Suppose an economy's PPC passes through these points (capital goods, consumer goods): $(0,100)$, $(10,90)$, $(20,70)$, $(30,40)$, $(40,0)$. Moving from $10$ to $20$ capital goods costs $90-70=20$ consumer goods, so each capital good costs $2$. From $30$ to $40$ the cost is $40$ consumer goods, $4$ each. The cost per unit rises, so the curve is bowed out: resources are not equally good at making both goods, and the economy moves the least suitable ones last.
Today's choice shifts tomorrow's curve. A country that picks a point with more capital goods (machines, factories, infrastructure) gives up consumer goods now, but its PPC shifts out faster in the future. A country that picks mostly consumer goods enjoys more now and grows more slowly.
When technology improves for one good only, the PPC does not shift in parallel: it pivots outward along that good's axis, and the other intercept stays fixed.
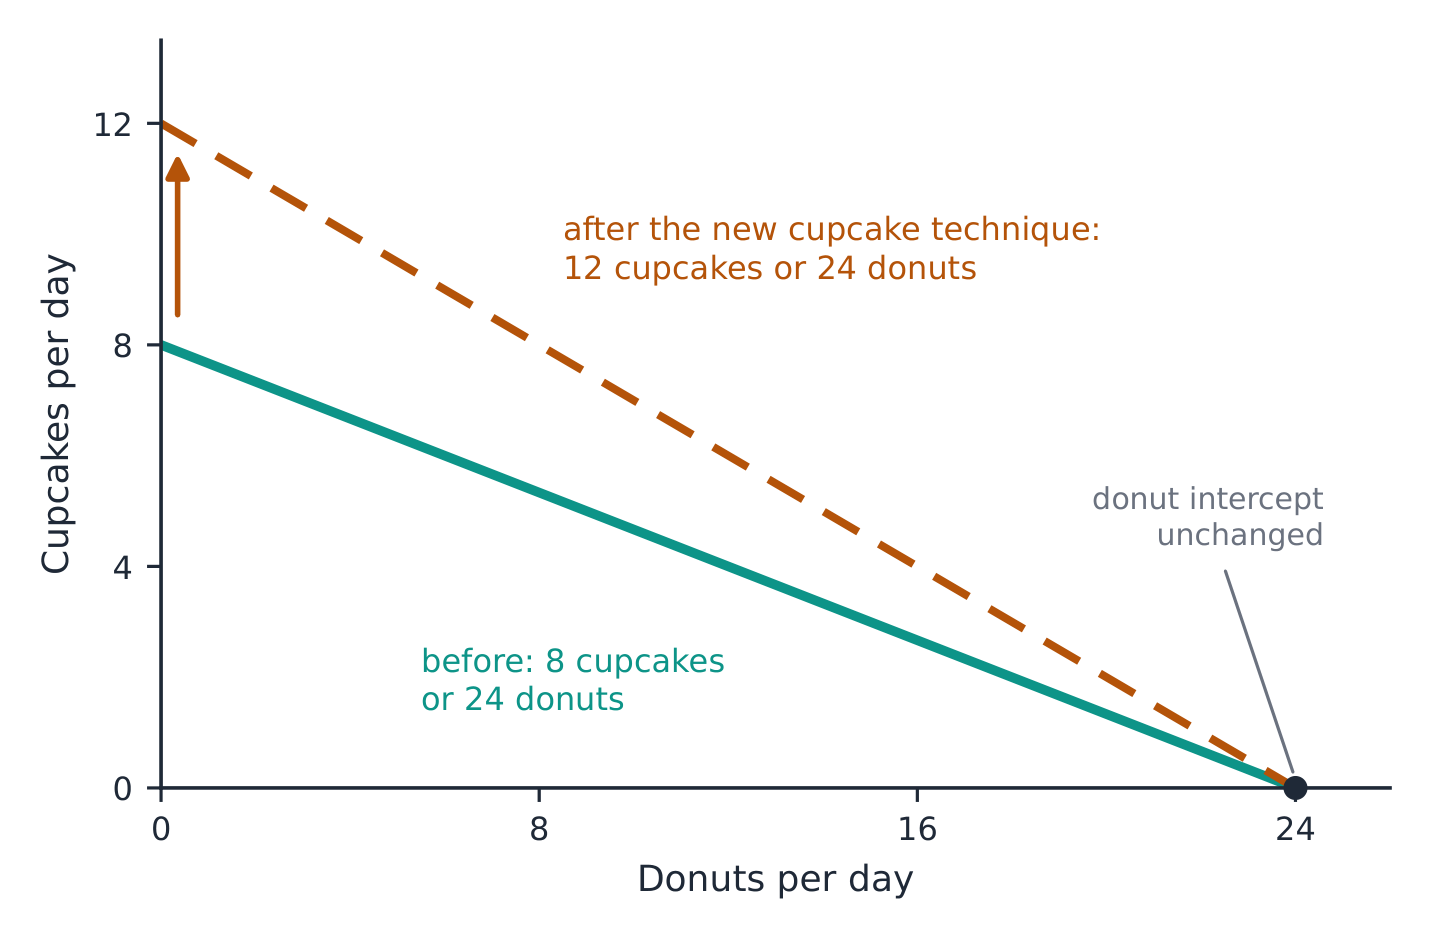
Common mistakes. Shifting the whole PPC out when only one good's technology changed; drawing a recession as an inward shift (a recession puts the economy at a point inside an unchanged PPC – the resources still exist but sit idle); and drawing a straight PPC when the question says opportunity cost is increasing.
Explore
Explore the production possibilities curve
Move along the curve — making more capital goods means giving up consumer goods. That lost output is the opportunity cost, and the bowed shape shows it rising with each extra unit.
Vocabulary
Train
| English |
|---|
| opportunity cost/ɒpəˈtjuːnɪti kɒst/ |
| production possibilities curve (PPC)/prəˈdʌkʃn ˌpɒsəˈbɪlɪtiz kɜːv/ |
| economic growth/ˌiːkəˈnɒmɪk ɡrəʊθ/ |
1.3
Comparative Advantage and Gains from Trade

Syllabus
| Enduring Understanding | Learning Objective | Essential Knowledge |
|---|---|---|
MKT-1 | MKT-1.A |
|
MKT-1.B |
|
Source: College Board AP Course and Exam Description
A producer has an absolute advantage 绝对优势 in a good if it can make more of it. It has a comparative advantage 比较优势 if it has the lower opportunity cost. Nations should specialize in their comparative-advantage goods and trade – both gain if the terms of trade 贸易条件 lie between the two opportunity costs. Trade lets a country consume beyond its own PPC.
Worked example. Country A can make $10$ wheat or $5$ cloth per day; Country B can make $8$ wheat or $8$ cloth. For A, one cloth costs $\tfrac{10}{5}=2$ wheat; for B it costs $\tfrac{8}{8}=1$ wheat. B's opportunity cost of cloth is lower, so B specializes in cloth. Checking wheat: A gives up $0.5$ cloth per wheat and B gives up $1$, so A specializes in wheat. Trading at any rate between the two costs, both consume beyond their own PPC.
Check the gains with numbers. Before trade, each country splits its day in half: A makes 5 wheat and 2.5 cloth, B makes 4 wheat and 4 cloth. After specializing, A makes 10 wheat and B makes 8 cloth. They trade 4 wheat for 3 cloth, a price of $\tfrac43 \approx 1.33$ wheat per cloth, which lies between B's cost (1) and A's cost (2). A now has 6 wheat and 3 cloth; B has 4 wheat and 5 cloth. Both have more than before, so both points lie outside their own PPCs.
Output or input data? AP questions give one of two kinds of table, and the method differs.
- Output (units made with the same resources), as above: the opportunity cost of good X is $\dfrac{\text{units of Y}}{\text{units of X}}$ ("other over").
- Input (hours or workers needed to make one unit): the opportunity cost of X is $\dfrac{\text{hours per X}}{\text{hours per Y}}$ ("same over").
Input example. Country C needs 2 hours for a shirt and 4 hours for a bike; Country D needs 3 hours for a shirt and 9 hours for a bike. C has the absolute advantage in both goods (fewer hours each). One shirt costs C $\tfrac24 = 0.5$ bike but costs D only $\tfrac39 \approx 0.33$ bike, so D has the comparative advantage in shirts. One bike costs C $\tfrac42 = 2$ shirts but costs D $\tfrac93 = 3$ shirts, so C has the comparative advantage in bikes.
Worked example (should a country import?). Country X can make $10$ solar panels or $30$ furnaces with its resources. At home, one solar panel costs $\tfrac{30}{10}=3$ furnaces. If the terms of trade are $2$ furnaces for $1$ solar panel, X can get a panel by trading only $2$ furnaces – less than the $3$ it would give up to make one. So X should import solar panels and make furnaces. A country gains from trade whenever the terms of trade are better than its own opportunity cost.
Worked example (individuals). Erica can bake $8$ cupcakes or $24$ donuts a day; John can bake $6$ cupcakes or $30$ donuts. John has the absolute advantage in donuts ($30>24$); Erica has it in cupcakes. A cupcake costs Erica $3$ donuts and John $5$ donuts, so Erica has the comparative advantage in cupcakes and John in donuts. At $1$ cupcake for $4$ donuts, Erica gets $4$ donuts for each cupcake instead of the $3$ she could make herself, and John pays $4$ donuts for a cupcake instead of $5$: trade benefits both.

Explore
See the gains from specialization and trade
A country should specialize where its opportunity cost is lowest, then trade for the rest. Because the terms of trade sit between the two countries' costs, each can consume beyond its own production frontier.
Vocabulary
Train
| English |
|---|
| absolute advantage/ˈæbsəluːt ədˈvæntɪdʒ/ |
| comparative advantage/kəmˈpærətɪv ədˈvæntɪdʒ/ |
| terms of trade/tɜːmz ɒv treɪd/ |
1.4
Demand

Syllabus
| Enduring Understanding | Learning Objective | Essential Knowledge |
|---|---|---|
MKT-2 | MKT-2.A |
|
MKT-2.B |
|
Source: College Board AP Course and Exam Description
Demand 需求 relates price to the quantity buyers will buy. The law of demand 需求定律 makes the curve slope downward. A change in the good's own price is a movement along the curve; the determinants (income, tastes, prices of substitutes 替代品 and complements 互补品, number of buyers, expectations) shift the whole curve.
Shift or movement? A change in the good's own price changes the quantity demanded 需求量 (a movement along the curve). Anything else changes demand (a shift).
- Income rises: demand for a normal good 正常品 (restaurant meals) shifts right; demand for an inferior good 低档品 (instant noodles, bus rides) shifts left.
- The price of coffee rises: demand for tea (a substitute) shifts right; demand for coffee filters (a complement) shifts left.
- Buyers expect the price to rise next month: demand shifts right now.
Common mistake. "The price of pizza rose, so demand for pizza fell." The price change causes a fall in quantity demanded, not a shift of demand.

Explore
Explore demand — move along vs shift the curve
A change in the own price moves you along a fixed curve (a change in quantity demanded); a determinant like income or tastes shifts the whole curve ($D_1 \to D_2$) — a change in demand.
Vocabulary
Train
| English |
|---|
| Demand/dɪˈmænd/ |
| law of demand/lɔː ɒv dɪˈmænd/ |
| substitutes/ˈsʌbstɪtjuːts/ |
| complements/ˈkɒmplɪmənts/ |
| quantity demanded/ˈkwɒntɪti dɪˈmændɪd/ |
| normal good/ˈnɔːml ɡʊd/ |
| inferior good/ɪnˈfɪərɪə ɡʊd/ |
1.5
Supply

Syllabus
| Enduring Understanding | Learning Objective | Essential Knowledge |
|---|---|---|
MKT-2 | MKT-2.C |
|
MKT-2.D |
|
Source: College Board AP Course and Exam Description
Supply 供给 relates price to the quantity sellers will offer; the law of supply 供给定律 makes it slope upward. Its determinants – input prices, technology, taxes and subsidies 补贴, number of sellers, expectations – shift the curve, while the good's own price moves along it.
Likewise, a change in the good's own price changes the quantity supplied 供给量, while a change in a determinant shifts supply. Examples: higher wages for bakers shift the supply of bread left; a better oven technology shifts it right; a per-unit tax shifts it left (up by the tax); a subsidy shifts it right.
Explore
Explore what moves the supply curve
Supply slopes up: a higher price makes selling more worthwhile. A change in costs, technology or the number of sellers shifts the whole curve — not a move along it. Drag the supply line and watch price and quantity respond.
Vocabulary
Train
| English |
|---|
| Supply/səˈplaɪ/ |
| law of supply/lɔː ɒv səˈplaɪ/ |
| subsidies/ˈsʌbsɪdiz/ |
| quantity supplied/ˈkwɒntɪti səˈplaɪd/ |
1.6
Market Equilibrium, Disequilibrium, and Changes in Equilibrium

Syllabus
| Enduring Understanding | Learning Objective | Essential Knowledge |
|---|---|---|
MKT-2 | MKT-2.E |
|
MKT-2.F |
| |
MKT-2.G |
|
Source: College Board AP Course and Exam Description
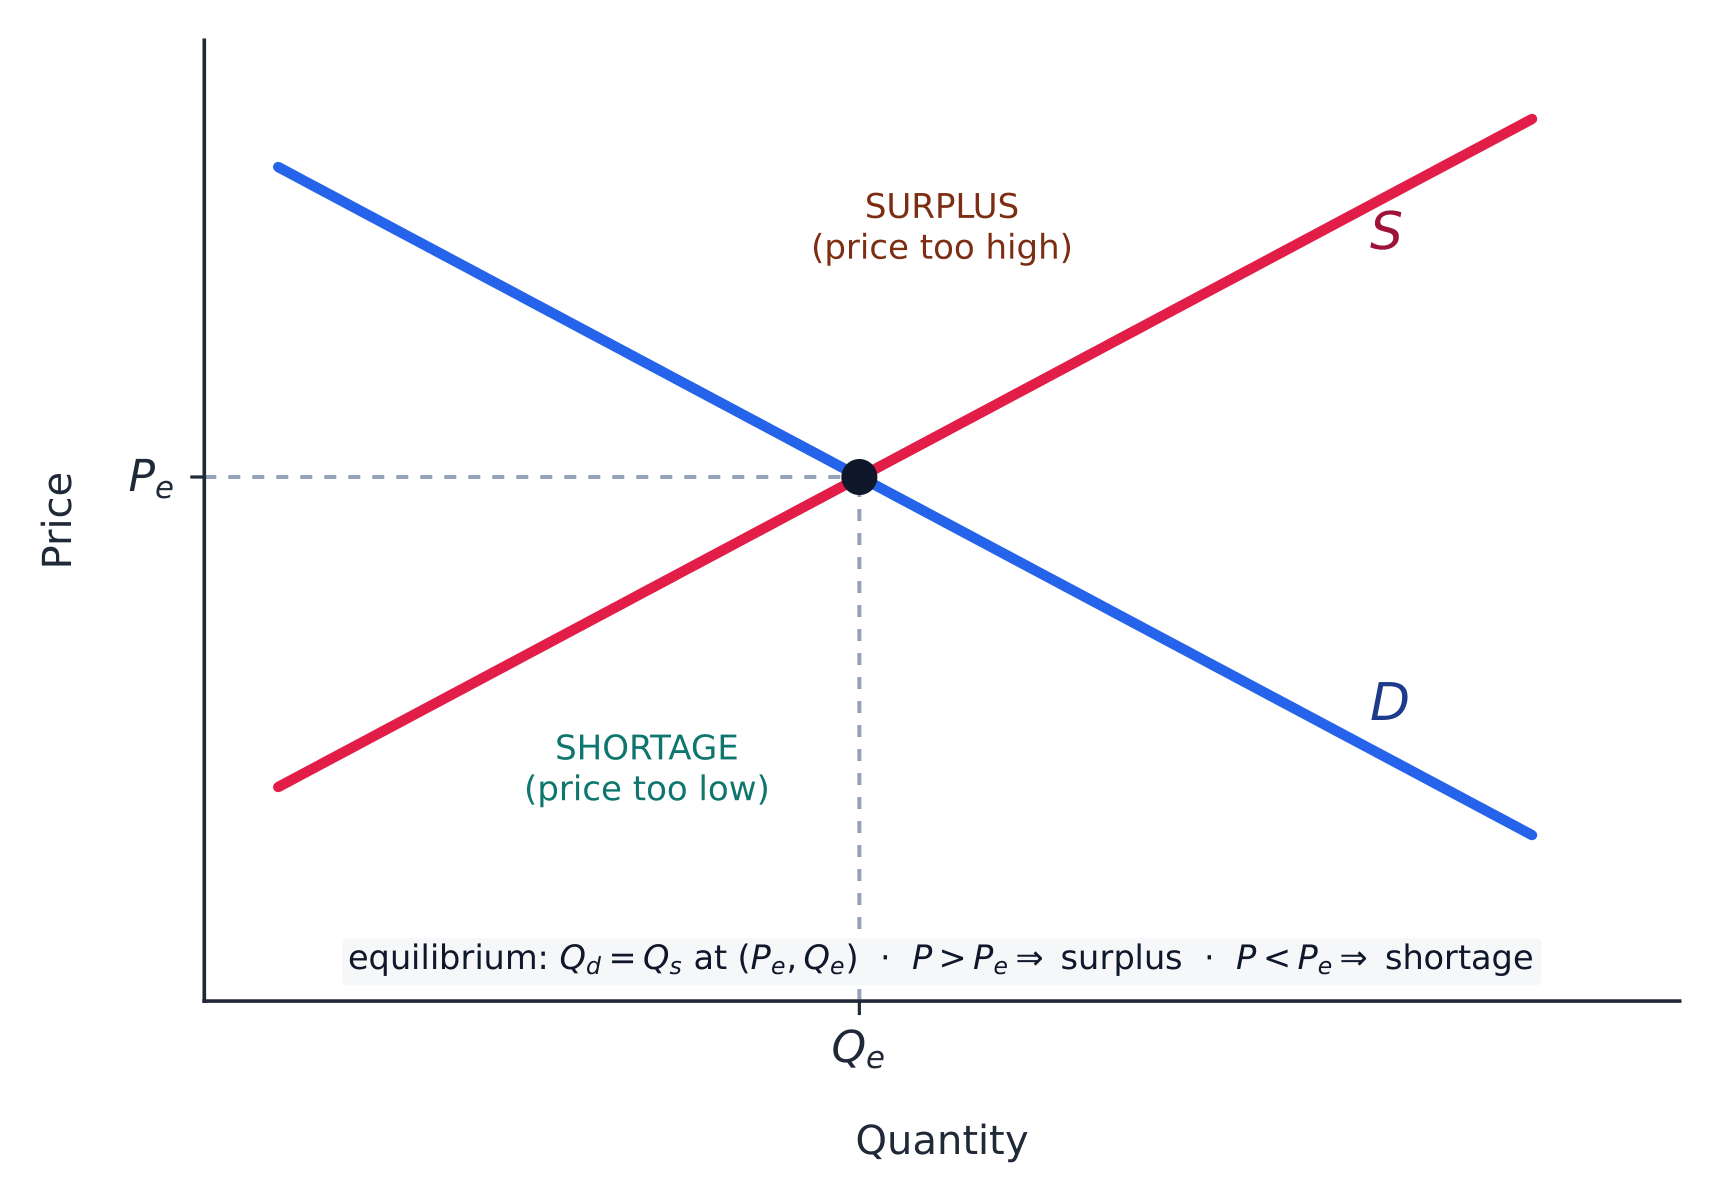
Equilibrium 均衡 is where supply meets demand, clearing the market. Above the equilibrium price a surplus 过剩 pushes price down; below it a shortage 短缺 pushes price up. When a determinant shifts one curve, price and quantity move predictably; when both shift, one of them is indeterminate.
Worked example. A new technology lowers producers' costs, shifting supply right. Along the unchanged demand curve, the equilibrium price falls and the equilibrium quantity rises. If instead a rise in incomes shifts demand right at the same time, quantity clearly rises but the effect on price depends on which shift is larger – the "both shift" indeterminate case.
| Both curves shift | Price | Quantity |
|---|---|---|
| demand right, supply right | indeterminate | rises |
| demand left, supply left | indeterminate | falls |
| demand right, supply left | rises | indeterminate |
| demand left, supply right | falls | indeterminate |
When the two shifts move one variable in the same direction, that variable's change is certain; the other depends on which shift is larger.
Worked example (numbers). Demand is $Q_d=100-2P$ and supply is $Q_s=3P-20$. Setting $Q_d=Q_s$: $100-2P=3P-20$, so $P=24$ and $Q=52$. At a price of $20$, $Q_d=60$ and $Q_s=40$: a shortage of $20$ units, so buyers bid the price up towards $24$. At a price of $30$, $Q_d=40$ and $Q_s=70$: a surplus of $30$, so sellers cut the price.
A real case. An outbreak of bird flu in 2022 killed tens of millions of US egg-laying hens. Supply shifted left, and because people keep buying eggs when prices rise, the price rose sharply: the average US price of a dozen large eggs reached $4.82 in January 2023, more than double its level a year earlier.
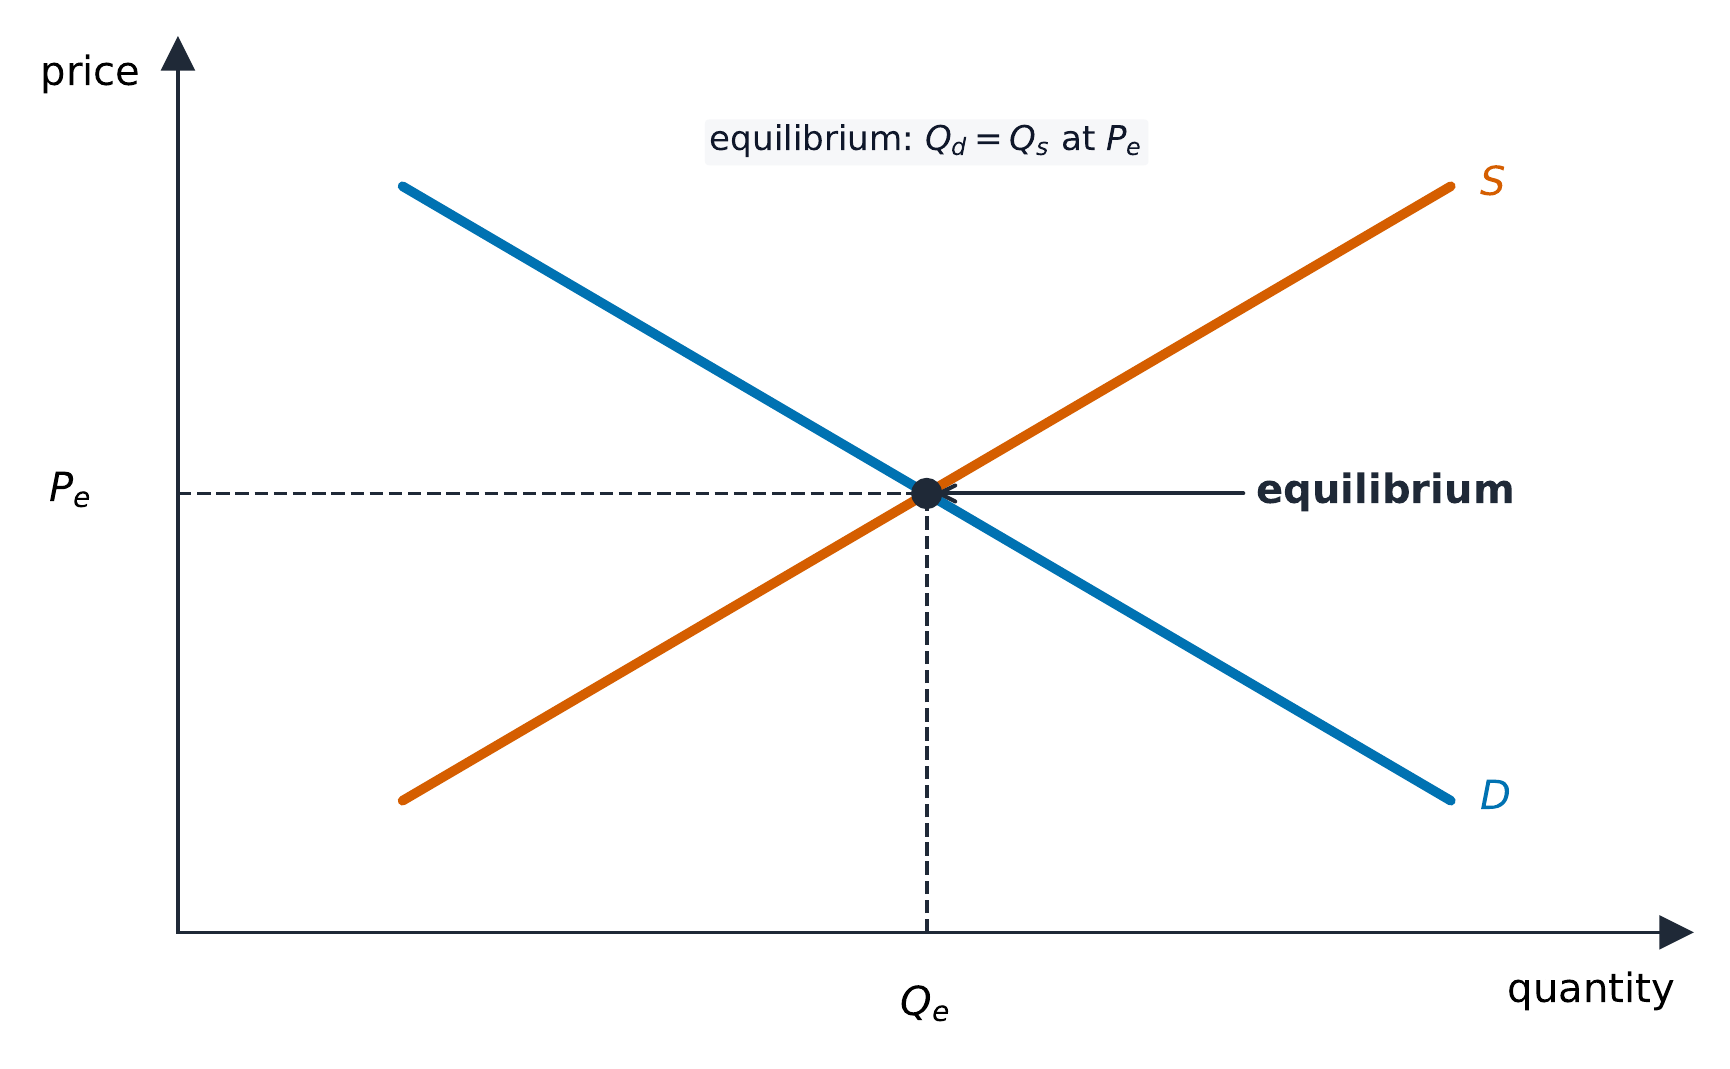
Exam skill: macro builds on these micro tools – you must draw and shift supply-and-demand and PPC graphs correctly, because the same shift logic drives the aggregate (whole-economy) models later in the course.
Explore
Explore market equilibrium, surplus and shortage
The market clears where supply meets demand. Shift a curve and watch the crossing move — a rightward demand shift raises both price and quantity; away from equilibrium a surplus or shortage pushes the price back.
Vocabulary
Train
| English |
|---|
| Equilibrium/ˌiːkwɪˈlɪbrɪəm/ |
| surplus/ˈsɜːpləs/ |
| shortage/ˈʃɔːtɪdʒ/ |
1.6
Exam tips
- Opportunity cost is what you give up — read it off a PPC as the slope; a bowed-out PPC shows increasing opportunity cost.
- Comparative advantage (lower opportunity cost), not absolute advantage, decides who should specialise and trade.
- Points inside the PPC are inefficient, outside unattainable; more resources/technology shift it out (growth).
- Check whether a trade table gives output (units made: "other over") or input (hours per unit: "same over") before computing opportunity cost.
- Distinguish a movement along a demand/supply curve (own price) from a shift (a determinant).
- These micro tools drive the aggregate models later — draw and shift the correct curve in the correct direction.
Practice.
- A PPC is drawn with consumer goods on the horizontal axis and capital goods on the vertical axis. Where would an economy in a recession be? What happens to the PPC if the labour force grows?
- Country A needs $2$ hours to make a chair and $6$ hours to make a table; Country B needs $3$ hours for a chair and $12$ for a table. Who has the comparative advantage in tables?
- With the countries in question 2, would trade at $3.5$ chairs per table benefit both?
- A frost destroys part of the orange crop while a health report raises the popularity of orange juice. What happens to the price and quantity of orange juice?
- Incomes fall. What happens to the demand for an inferior good, and to its equilibrium price?
- $Q_d=80-4P$ and $Q_s=2P+20$. Find the equilibrium, and the shortage or surplus at $P=6$.
Answers.
- At a point inside the PPC. Growth of the labour force shifts the whole PPC outward.
- A table costs A $\tfrac62=3$ chairs and B $\tfrac{12}{3}=4$ chairs. A has the lower opportunity cost, so A has the comparative advantage in tables (and B in chairs).
- Yes: $3.5$ chairs per table lies between A's cost ($3$) and B's cost ($4$).
- Supply shifts left and demand shifts right: the price rises; the change in quantity is indeterminate.
- Demand for an inferior good shifts right, so its equilibrium price and quantity rise.
- $80-4P=2P+20$ gives $P=10$, $Q=40$. At $P=6$: $Q_d=56$, $Q_s=32$, a shortage of $24$.
Interactive lessons on this topic
Work through it step by step, with instant-check exercises.