| Big Idea | Learning Objective | Essential Knowledge |
|---|---|---|
Big Idea 2 — Energetics | 8.1.A |
|
Big Idea 3 — Information Storage and Transmission | 8.1.B |
|
Ecology
AP Biology · Topic 8
 7:53
Ecology
This reef holds more kinds of life in one hectare than a whole province of farmland. Every fish depends on the coral, and the coral on tiny algae inside it.…
English narration · English + 中文 subtitles burned in
8.1
Responses to the Environment

Syllabus
Source: College Board AP Course and Exam Description
In 1995 wolves were returned to Yellowstone National Park after 70 years away. Elk stopped grazing by the rivers, willows grew back, beavers returned and built dams, and the rivers themselves changed course. One predator changed a whole ecosystem. This unit is about how such links work.
Organisms sense and respond to their surroundings in ways that aid survival and reproduction. Behaviors may be innate (inherited, like reflexes and instincts) or learned. Responses such as migration, hibernation, and phototropism, and signals between organisms, are shaped by natural selection because they improve fitness.
The behaviours the CED lists by name
These are the illustrative behaviours an exam question builds its scenario from, so learn what each one is and what it buys the organism:
| Behaviour | What it is | Why it aids fitness |
|---|---|---|
| taxis 趋性 | movement directed towards or away from a stimulus | reaches food, light or moisture, or escapes a hazard |
| kinesis 动性 | a change in the rate of random movement, with no direction | keeps the animal in favourable conditions by moving less there and more elsewhere |
| nocturnal and diurnal activity 夜行性与昼行性 | being active at night, or by day | avoids predators or heat, and matches activity to when food is available |
| territorial marking 领域标记 | scent, sound or visual marks that claim an area | secures food, nesting sites and mates without repeated fighting |
| coloration 体色 | pigmentation in animals and flowering plants | warning, camouflage, mate attraction — and in flowers, attracting pollinators |
| foraging 觅食 by bees and others | searching for and collecting food | efficient foraging returns more energy than it costs, which is what selection acts on |
⚠️ Taxis and kinesis are the pair most often confused. Taxis has a direction: the woodlouse walks towards the damp. Kinesis has only a rate: the woodlouse moves quickly and turns often in dry air and slows down in damp air, so it ends up in the damp without ever steering there.
Life-history strategy 生活史策略 is the pattern of when an organism grows, reproduces and dies, and it too is shaped by selection: a biennial plant stores resources in its first year and flowers in its second; reproductive diapause pauses development until conditions improve, so offspring arrive when they can survive. Both trade the timing of reproduction against the chance that it succeeds.
Plants respond too. Photoperiodism 光周期现象 is a response to day length: many plants flower only when nights reach a certain length, so they flower in the right season every year. Phototropism is growth towards light. When a caterpillar chews a leaf, many plants respond to the herbivory 植食作用 by making bitter or toxic chemicals, and some release chemicals into the air that attract the caterpillar's predators.
Sending signals. Organisms communicate with visual, sound, touch, electrical and chemical signals. Signals show dominance, mark territory, lead others to food and attract mates. A bird's song both holds its territory and attracts a mate; a honeybee's dance tells other bees where flowers are. A signal changes another organism's behaviour, so it changes who survives and reproduces.
- The fight-or-flight response prepares an animal's body to fight or run when it senses danger.
- Predator warnings, such as a meerkat's alarm call, make the whole group hide.
Working together. Cooperative behaviour usually increases both the individual's fitness and the group's survival. Wolves hunting in a pack can kill prey too large for one wolf; fish in a school and birds in a flock are harder for a predator to pick off; bees in a colony share the work. An animal that helps its relatives at a cost to itself still passes on copies of its own alleles, because relatives share many of them. This is kin selection 亲缘选择. Worker bees do not breed at all, but they help their mother, the queen, raise their sisters.
Innate or learned, both are selected. A behaviour, inherited or learned, spreads if it increases survival and reproduction. Parent birds feeding their chicks, courtship displays and efficient foraging are all examples.
Explore
Sort the responses
Sort each behaviour by the kind of response it is - a plant growth response, an animal movement, or a fast reflex.
Vocabulary
Train
| English |
|---|
| taxis/ˈtæksiz/ |
| kinesis/kəˈniːsɪs/ |
| nocturnal and diurnal activity/nɒkˈtɜːnl ænd ˈdɪɜːnl ækˈtɪvɪti/ |
| territorial marking/ˌterɪˈtɔːrɪəl ˈmɑːkɪŋ/ |
| coloration/ˌkʌləˈreɪʃn/ |
| foraging/ˈfɒrɪdʒɪŋ/ |
| Life-history strategy/laɪf ˈhɪstəri ˈstrætədʒi/ |
| photoperiodism |
| herbivory |
| kin selection |
8.2
Energy Flow Through Ecosystems

Syllabus
| Big Idea | Learning Objective | Essential Knowledge |
|---|---|---|
Big Idea 2 — Energetics | 8.2.A |
|
8.2.B |
| |
8.2.C |
| |
8.2.D |
|
Source: College Board AP Course and Exam Description
Energy enters most ecosystems 生态系统 as sunlight, is captured by producers 生产者 (photosynthesizers), and passes to consumers 消费者 along a food chain 食物链. Each level is a trophic level 营养级. Only about 10% of energy transfers up each level (the rest is lost as heat), so food chains are short and producers are the most abundant. Energy flows through and is lost, while matter (carbon, nitrogen) cycles.
Ecological levels. A population is one species in one area; a community is all the populations there; an ecosystem is the community plus its non-living surroundings; a biome 生物群系 is a large region with a typical climate and vegetation, such as a desert or a tropical rainforest.
Making and using food. Autotrophs 自养生物 capture energy from the environment.
- Photosynthetic organisms capture light energy. Together they set the ecosystem's primary productivity, the rate at which producers store energy.
- Chemosynthetic 化能合成 organisms capture energy from small inorganic molecules such as hydrogen sulfide, even without oxygen. Bacteria at deep-sea vents feed whole communities this way, with no sunlight at all.
Heterotrophs 异养生物 get their energy by eating organic matter: carbohydrates, lipids and proteins. They include herbivores, carnivores, omnivores, scavengers and decomposers 分解者. Decomposers break down dead matter and wastes, returning nutrients to the soil.
Warm or cold. Endotherms 恒温动物, such as birds and mammals, use the heat from their own metabolism to keep their body temperature almost constant. Ectotherms 变温动物, such as lizards and insects, gain most of their heat from the surroundings; they warm up by basking in the sun and cool down in the shade.
Keeping warm is expensive. A mouse uses many times as much food energy as a lizard of the same mass, but it can stay active on a cold night. Smaller endotherms lose heat faster, because they have more surface area for each gram of body.
Energy budgets. If an organism takes in more energy than it uses, the extra is stored and used for growth and reproduction. If it takes in less, it loses mass, has fewer offspring and eventually dies. Some organisms change how they reproduce with the energy available. Aphids and water fleas reproduce asexually, quickly, when food is plentiful, and switch to sexual reproduction when conditions get worse. Many animals and plants breed only in the season when food is easiest to find.
Changing the energy supply. Fewer producers, or less sunlight reaching them, means less energy for every level above. For example, after a volcanic eruption fills the air with dust, plants grow less. Fewer herbivores can then be supported, and fewer carnivores still. A top level, such as the quaternary consumers, may disappear entirely.
How matter cycles
Every biogeochemical cycle 生物地球化学循环 moves atoms between reservoirs 储库 (non-living stores such as the air, the ocean and rocks, and living stores in organisms). Atoms are never used up, only moved: each cycle shows the conservation of matter. The cycles are linked; for example, the water cycle carries nitrates and phosphates through the soil.
- Water. Reservoirs: oceans, surface water, the air, living organisms. Processes: evaporation, condensation, precipitation and transpiration 蒸腾作用 (water lost from leaves).
- Carbon. Photosynthesis takes CO₂ from the air into carbohydrates; respiration and decomposition return it. Burning fossil fuels releases carbon that was locked away for millions of years, so CO₂ in the air rises.
- Nitrogen. The air, 78% N₂, is the largest reservoir, but most organisms cannot use N₂. Soil microorganisms carry out each step, shown below.
- Phosphorus. Weathering of rocks releases phosphate (PO₄³⁻) into soil and water. Producers absorb it and build it into DNA, ATP and phospholipids; consumers get it by eating; decomposers return it. Unlike the other three cycles, phosphorus has no gas stage, so it moves slowly and often limits growth.

- Nitrogen fixation 固氮作用: bacteria (some in the root nodules of legumes) turn N₂ into ammonia.
- Nitrification 硝化作用: other soil bacteria turn ammonium into nitrite, then nitrate.
- Assimilation: plants take up nitrate or ammonium and use it to make amino acids and nucleotides.
- Ammonification 氨化作用: decomposers turn the nitrogen in dead matter and wastes back into ammonium.
- Denitrification 反硝化作用: bacteria in waterlogged, low-oxygen soil turn nitrate back into N₂.

Worked example. Suppose producers capture $10{,}000\ \text{kcal}$. Applying the $10\%$ rule, primary consumers receive about $1{,}000\ \text{kcal}$, secondary consumers $100\ \text{kcal}$, and tertiary consumers only $10\ \text{kcal}$. Losing $90\%$ as heat at every step is exactly why food chains rarely exceed four or five levels – there is too little energy left to support another.
Explore
Energy up a food chain
Only about 10% of energy passes to the next trophic level; the rest is lost as heat. That's why food chains are short and top predators are few.
Vocabulary
Train
| English |
|---|
| ecosystems/ˈiːkəʊsɪstəmz/ |
| producers/prəˈdjuːsəz/ |
| consumers/kənˈsuːməz/ |
| food chain/fuːd tʃeɪn/ |
| trophic level/ˈtrəʊfɪk ˈlevl/ |
| biome/ˈbaɪəʊm/ |
| autotrophs |
| chemosynthetic |
| heterotrophs |
| decomposers/ˌdiːkəmˈpəʊzəz/ |
| endotherms |
| ectotherms |
| biogeochemical cycle |
| reservoirs |
| transpiration/trænspəˈreɪʃn/ |
| nitrogen fixation/ˈnaɪtrədʒn fɪkˈseɪʃn/ |
| nitrification/ˌnaɪtrɪfɪˈkeɪʃn/ |
| ammonification/ˌæməˌnɪfɪˈkeɪʃn/ |
| denitrification/diːˌnaɪtrɪfɪˈkeɪʃn/ |
8.3
Population Ecology

Syllabus
| Big Idea | Learning Objective | Essential Knowledge |
|---|---|---|
Big Idea 3 — Information Storage and Transmission | 8.3.A |
|
Source: College Board AP Course and Exam Description
A population 种群 is the individuals of one species in an area. Its growth depends on birth, death, immigration, and emigration. Ignoring migration, the change in size is simply births minus deaths:
$$\frac{dN}{dt} = B - D$$
With no limits, each individual adds offspring at the maximum rate $r_{\max}$, and the population grows exponentially:
$$\frac{dN}{dt} = r_{\max}N$$
Worked example (exponential growth). A population of 500 bacteria has $r_{\max} = 0.2$ per hour. Its growth rate now is $0.2 \times 500 = 100$ cells per hour. When it reaches 5000 cells, it grows ten times as fast, 1000 cells per hour: the bigger it gets, the faster it grows, which gives the J-shape. Exponential growth 指数增长 ($J$-shaped) happens with unlimited resources; logistic growth 逻辑斯蒂增长 ($S$-shaped) levels off at the carrying capacity 环境容纳量 $K$ – the maximum the environment can sustain – following $\dfrac{dN}{dt}=r_{\max}N\dfrac{K-N}{K}$.
Worked example. A population has $r_{\max}=0.5\ \text{yr}^{-1}$, carrying capacity $K=1000$, and current size $N=400$. Then $\dfrac{dN}{dt}=0.5\times400\times\dfrac{1000-400}{1000}=0.5\times400\times0.6=120$ individuals per year. The $\frac{K-N}{K}$ term is why growth is fastest near $N=K/2$ and slows toward zero as $N$ approaches $K$.
Worked example (reading K from a graph). A yeast culture grows quickly, then levels off at about $8 \times 10^6$ cells per mL from day 5 onwards.
- The carrying capacity is the level where the curve flattens: $K \approx 8 \times 10^6$ cells/mL.
- Growth stops because something runs short or builds up: the sugar is used up, or toxic wastes such as ethanol accumulate.
- Adding fresh medium would raise $K$; the population would grow again until a new limit was reached.
Explore
Grow a population to carrying capacity
A population grows fast when small, then slows as it nears its carrying capacity $K$ — logistic growth. Raise the growth rate and watch it level off.
Vocabulary
Train
| English |
|---|
| population/ˌpɒpjʊˈleɪʃn/ |
| Exponential growth/ˌekspəˈnenʃl ɡrəʊθ/ |
| logistic growth/ləˈdʒɪstɪk ɡrəʊθ/ |
| carrying capacity/ˈkæriɪŋ kəˈpæsɪti/ |
8.4
Effect of Density on Populations

Syllabus
| Big Idea | Learning Objective | Essential Knowledge |
|---|---|---|
Big Idea 4 — Systems Interactions | 8.4.A |
|
Source: College Board AP Course and Exam Description
Some factors depend on crowding, others do not:
- Density-dependent 密度制约 factors intensify as a population grows – competition, predation, disease.
- Density-independent 非密度制约 factors act regardless of density – weather, natural disasters.
These factors regulate population size around the carrying capacity.
Carrying capacity is the number of a species that the ecosystem's resources can support long term. As a population nears it, density-dependent factors bite harder: each individual gets less food, disease spreads more easily between crowded animals, and predators find prey more easily. Births fall and deaths rise until they balance, giving the S-shaped logistic curve. A population that overshoots $K$ damages its resources, then crashes below $K$.
Explore
Density-dependent or not?
Sort each limiting factor by whether its effect gets stronger as the population becomes more crowded.
Vocabulary
Train
| English |
|---|
| Density-dependent/ˈdensɪti dɪˈpendənt/ |
| Density-independent/ˈdensɪti ˌɪndɪˈpendənt/ |
8.5
Community Ecology

Syllabus
| Big Idea | Learning Objective | Essential Knowledge |
|---|---|---|
Big Idea 2 — Energetics | 8.5.A |
|
8.5.B |
|
Source: College Board AP Course and Exam Description
A community 群落 is all the interacting populations in an area. Key interactions: competition 竞争 (for shared resources), predation 捕食, symbiosis 共生 – mutualism (both benefit), commensalism (one benefits, other unaffected), and parasitism (one benefits, other harmed). These relationships shape which species coexist.
Describing a community. A community is described by which species it has and by its species diversity: how many species there are, and how evenly the individuals are shared between them. Simpson's diversity index 辛普森多样性指数 combines both:
$$\text{diversity index} = 1 - \sum\left(\frac{n}{N}\right)^2$$
where $n$ is the number of one species and $N$ the total of all species. It runs from 0 (one species only) towards 1 (many species, evenly spread).
Worked example (Simpson's index). Community A has 40 oaks, 30 maples and 30 birches ($N = 100$). Community B has 80 oaks, 10 maples and 10 birches.
- A: $1 - (0.4^2 + 0.3^2 + 0.3^2) = 1 - (0.16 + 0.09 + 0.09) = 0.66$.
- B: $1 - (0.8^2 + 0.1^2 + 0.1^2) = 1 - (0.64 + 0.01 + 0.01) = 0.34$.
- Both have three species, but A is more even, so it is more diverse.
Effects as + and −. Each interaction can be written by its effect on each species:
| Interaction | Effect on species 1 / species 2 | Example |
|---|---|---|
| competition | − / − | lions and hyenas for the same prey |
| predation, herbivory | + / − | lynx eating hares |
| mutualism 互利共生 | + / + | bees and flowers; nitrogen-fixing bacteria in root nodules |
| commensalism 偏利共生 | + / 0 | barnacles on a whale |
| parasitism 寄生 | + / − | tapeworms; a cuckoo laying its eggs in a warbler's nest |
A relationship can change with conditions. Warbler nests with a cuckoo chick are usually a loss for the warblers. But where predators are common, the cuckoo chick releases a foul-smelling liquid that drives predators away, so the nest is more likely to succeed: the relationship becomes closer to mutualism.
Predators and prey cycle. When prey are plentiful, more predators survive and breed, so the predator population rises, a little later. More predators eat more prey, so the prey fall; then, short of food, the predators fall too, and the prey recover.

Other ways populations shape a community.
- Niche partitioning 生态位分化: similar species reduce competition by using a resource differently. Several warbler species feed on insects in the same tree, but each in a different part of it.
- Competitive exclusion: if two species need exactly the same limited resource, the better competitor eventually removes the other.
- Trophic cascade 营养级联: a change at one trophic level ripples down the chain. Yellowstone's wolves reduced elk grazing, so willows and the animals that depend on them returned.
Explore
Name the interaction
Sort each relationship between species by the type of interaction it is.
Vocabulary
Train
| English |
|---|
| community/kəˈmjuːnɪti/ |
| competition/ˌkɒmpəˈtɪʃn/ |
| predation/prɪˈdeɪʃn/ |
| symbiosis/ˌsɪmbaɪˈəʊsɪs/ |
| Simpson's diversity index |
| mutualism/ˈmjuːtʃuːəlɪzəm/ |
| commensalism |
| parasitism/ˈpærəsɪtɪzəm/ |
| niche partitioning |
| trophic cascade |
8.6
Biodiversity

Syllabus
| Big Idea | Learning Objective | Essential Knowledge |
|---|---|---|
Big Idea 4 — Systems Interactions | 8.6.A |
|
8.6.B |
|
Source: College Board AP Course and Exam Description
Biodiversity 生物多样性 is the variety of life – genes, species, and ecosystems. Higher diversity generally makes a community more resilient 有韧性, better able to withstand and recover from disturbance. A keystone species 关键种 has an outsized effect, so losing it can collapse the community.
Why diversity gives resilience. An ecosystem with few parts, and little variation between them, is less resilient to change. This is true for natural ecosystems and for artificial ones such as farms.
- With many species at each trophic level, a predator that loses one prey species can switch to another. With only one, it starves.
- A forest of many tree species loses only some trees to a new disease. A plantation of one tree species can lose them all.
- After a disturbance, some species in a diverse community are likely to survive and fill the gaps.
What holds diversity up. Keystone species, producers, and essential abiotic factors (such as water and nutrients) and biotic factors maintain an ecosystem's diversity. A keystone species has an effect far larger than its numbers. When the sea star Pisaster was removed from rocky shores, mussels took over the rocks and the number of species fell from 15 to 8. Sea otters keep sea urchins in check; without otters, the urchins eat whole kelp forests.
Worked example (removing a species). In community A, the top predator eats five prey species. In community B, it eats only species PP1. Explain why removing PP1 affects B more.
- In A, the predator can switch to its other four prey, so its numbers change little.
- In B, the predator loses its only food source, so its population crashes.
- Its other effects on community B, such as controlling herbivores, are lost too, so the change spreads further.

Explore
High or low biodiversity?
Sort each place by how much variety of life it holds - high or low biodiversity.
Vocabulary
Train
| English |
|---|
| Biodiversity/ˌbaɪəʊdaɪˈvɜːsɪti/ |
| resilient/rɪˈsɪlɪənt/ |
| keystone species/ˈkiːstəʊn ˈspiːsiːz/ |
8.7
Disruptions in Ecosystems

Syllabus
| Big Idea | Learning Objective | Essential Knowledge |
|---|---|---|
Big Idea 1 — Evolution | 8.7.A |
|
Big Idea 4 — Systems Interactions | 8.7.B |
|
8.7.C |
| |
8.7.D |
|
Source: College Board AP Course and Exam Description
Ecosystems change from natural and human causes – climate shifts, invasive species, habitat loss, and pollution. A disturbance can trigger ecological succession 生态演替 (the community rebuilds over time). Because species are interconnected, a change to one – especially a keystone or a trophic level – can ripple through the whole ecosystem.
Variation meets the environment. An adaptation is a genetic variation that is favoured by selection because it gives an advantage in a particular environment. Mutations are not directed by the environment; the variation is already there before the change, and the change only selects among it. In heterozygote advantage 杂合子优势, the heterozygote is fitter than either homozygote. With malaria present, people with one sickle-cell allele survive best, so both alleles stay in the population.
Invasive species. An invasive species 入侵物种 is one brought into a new area, by accident or on purpose, that spreads and harms the ecosystem. It succeeds because its new home lacks its natural predators, parasites and competitors, or because it outcompetes native species for resources.
- Kudzu, a vine from Asia planted in the USA, grows over and shades out whole forests.
- Zebra mussels, carried to the Great Lakes in ships' ballast water, filter out the plankton that native species eat and block water pipes.
The same species may not be invasive somewhere else, where the community already has predators or competitors that hold it in check.
Human activities speed up change.
- Biomagnification 生物放大: a toxin that is not broken down or excreted, such as DDT or mercury, becomes more concentrated at each trophic level. Top predators get the highest dose; DDT made the eggshells of eagles and ospreys so thin that they broke.
- Eutrophication 富营养化: fertiliser runs off into lakes. Algae grow fast, then die; decomposers break down the dead algae and use up the oxygen in the water, and fish die.
- Introduced diseases: Dutch elm disease, a fungus spread by beetles, killed most elm trees in Europe and North America; potato blight destroyed Ireland's single-variety potato crop.
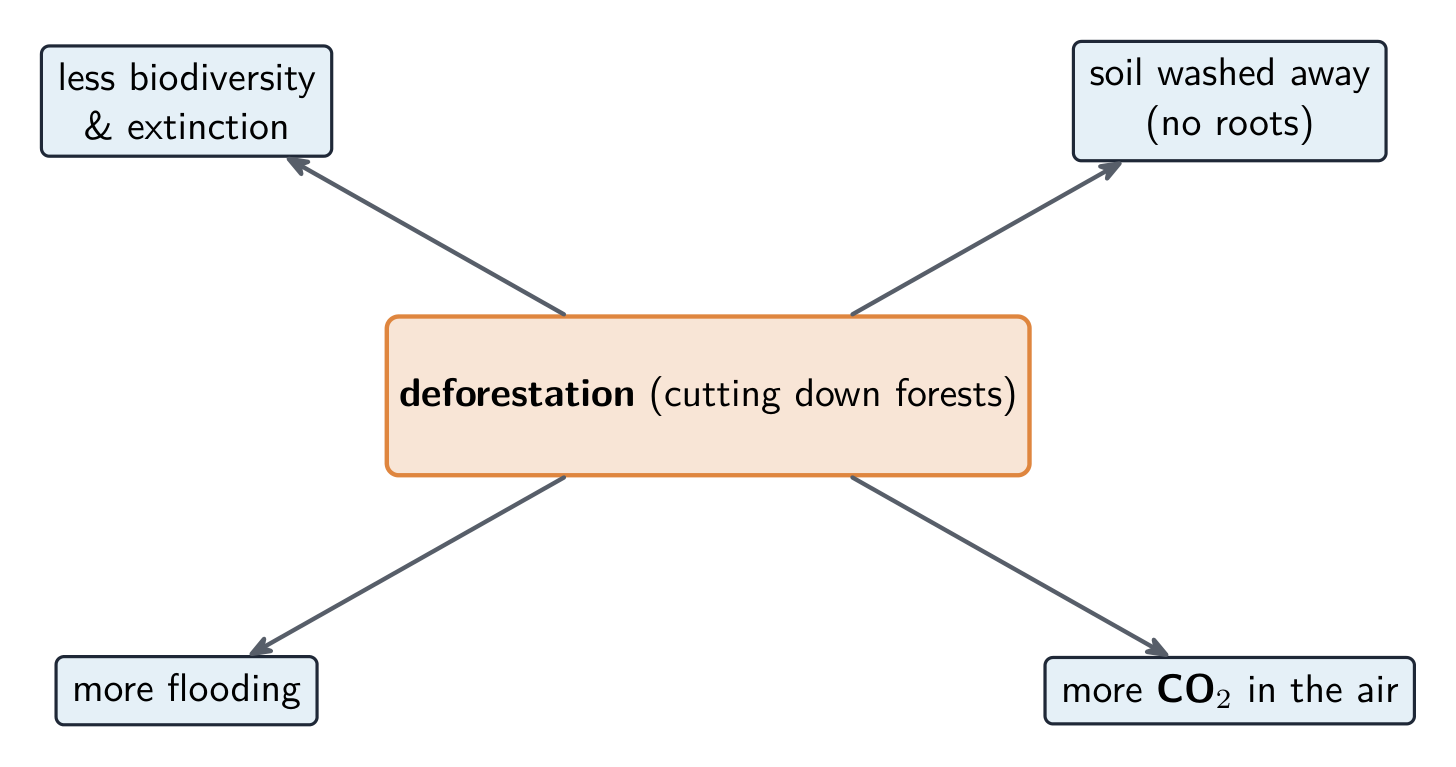
- Logging, urbanisation and monocropping (growing one crop over large areas) destroy habitats and lower diversity.
Geological and weather events. Ecosystems also change for reasons humans do not control. El Niño warms the eastern Pacific every few years, which moves rainfall and cuts fish numbers off Peru. Continental drift separated and joined land masses: when the Isthmus of Panama formed about 3 million years ago, North and South American animals mixed, and many South American species died out in competition with the newcomers. A meteor impact 66 million years ago ended the age of the dinosaurs. Global climate change is moving the ranges of many species towards the poles and up mountains. Biogeography, the study of where species live, records these changes.
Common mistakes.
- Saying energy is recycled in an ecosystem. Matter cycles; energy flows one way and leaves as heat.
- Saying the 90% "lost" energy is destroyed. It is still energy, mostly released as heat in respiration, or left in parts that are not eaten or digested.
- Placing the fastest logistic growth at the carrying capacity. Growth is fastest near $N=K/2$; at $N=K$ the term $\frac{K-N}{K}$ is zero, so $\frac{dN}{dt}=0$.
- Calling a flood or a frost density-dependent because it kills many individuals. A factor is density-dependent only if its effect per individual grows as the population becomes more crowded.
- Mixing up taxis and kinesis. Taxis is directed movement towards or away from a stimulus; kinesis changes only the rate of random movement.
- Calling a keystone species "the most common species". A keystone species has an effect far larger than its numbers suggest; a sea star or a wolf can be rare and still hold the community together.
- Saying an organism "decides" to adapt, or that the environment causes the right mutation. Selection acts on variation that already exists.
- Mixing up nitrification and nitrogen fixation. Fixation turns N₂ gas into ammonia; nitrification turns ammonium into nitrate.
- Saying a higher Simpson's index means more individuals. It means more species, more evenly spread.
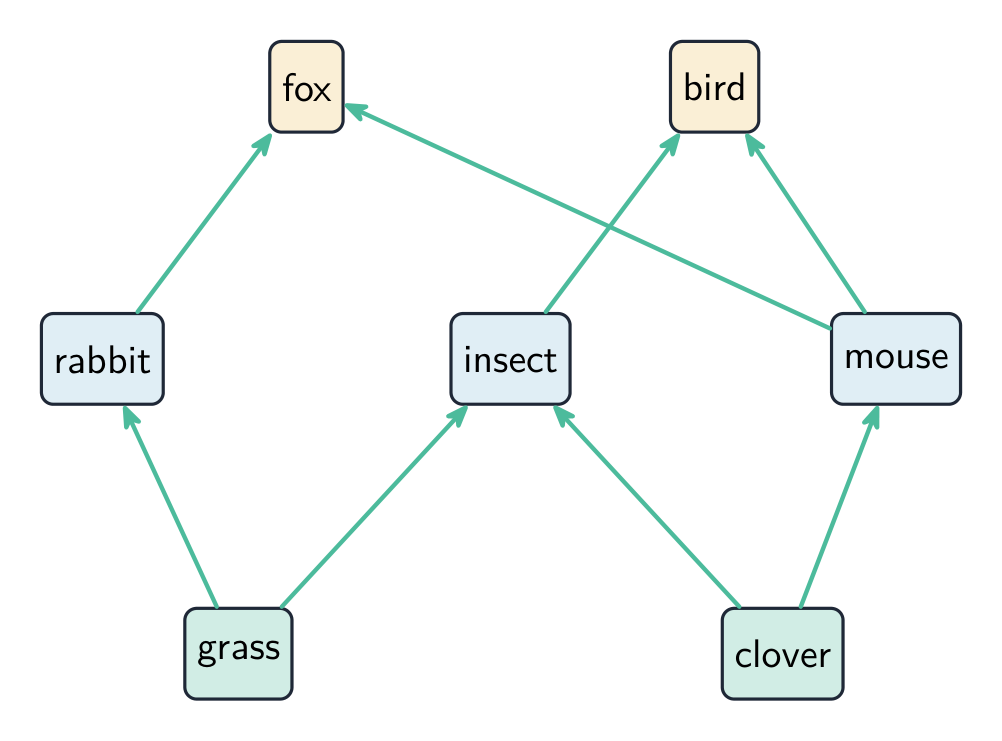
- Drawing food-web arrows from predator to prey. Arrows show the direction energy flows: from the organism eaten to the one that eats it.
- Calling every symbiosis mutualism. Symbiosis includes mutualism (+/+), commensalism (+/0) and parasitism (+/−).
Explore
Natural or human disruption?
Sort each disturbance by whether it is a natural event or caused by humans.
Vocabulary
Train
| English |
|---|
| ecological succession/ˌekəˈlɒdʒɪkl səkˈseʃn/ |
| heterozygote advantage |
| invasive species/ɪnˈveɪsɪv ˈspiːsiːz/ |
| biomagnification/ˌbaɪəʊˌmæɡnɪfɪˈkeɪʃn/ |
| eutrophication/ˌjuːtrəfɪˈkeɪʃn/ |
8.7
Exam tips
- Apply the 10% rule: about 90% of energy is lost at each trophic level, so food chains are short.
- Distinguish exponential ($J$) from logistic ($S$) growth; the latter levels off at the carrying capacity ($\frac{dN}{dt}=r_{\max}N\frac{K-N}{K}$).
- Separate density-dependent (competition, disease, predation) from density-independent (weather) limiting factors.
- Name community interactions (competition, predation, symbiosis) and the effect of a keystone species.
- Explain how disturbing one species — especially a keystone or a whole trophic level — ripples through the ecosystem.
- For a null hypothesis, state that the treatment has no effect: "Caffeine in nectar has no effect on how often bees return to a flower."
- For data on a carrying capacity, read $K$ where the curve levels off, and name the limit: food, space, or the build-up of wastes.
Interactive lessons on this topic
Work through it step by step, with instant-check exercises.