This handout covers Topic 4: Further Probability & Statistics 进阶概率统计. It adds continuous distributions, small-sample inference, the chi-squared and non-parametric tests, and probability generating functions.
Further Probability & Statistics
A-Level Further Mathematics · Topic 4
 8:08
Further Probability & Statistics
Dublin, nineteen-oh-eight. Inside the Guinness brewery, a young chemist named William Gosset faces a very practical problem. He can test only a few batches of…
English narration · English + 中文 subtitles burned in
4.1
Continuous random variables
Syllabus
| Candidates should be able to: | Notes and examples |
|---|---|
| use a probability density function which may be defined piecewise | |
| use the general result $\text{E}(g(X)) = \int f(x)g(x) \, \mathrm{d}x$ where $f(x)$ is the probability density function of the continuous random variable $X$ and $g(X)$ is a function of $X$ | |
| understand and use the relationship between the probability density function (PDF) and the cumulative distribution function (CDF), and use either to evaluate probabilities or percentiles | |
| use cumulative distribution functions (CDFs) of related variables in simple cases. | e.g. given the CDF of a variable $X$, find the CDF of a related variable $Y$, and hence its PDF, e.g. where $Y = X^3$. |
Source: Cambridge International syllabus
A continuous variable $X$ is described by a probability density function 概率密度函数 $f(x)$, which may be defined piecewise. The probability over a range is the area under $f$, and the mean of any function of $X$ is
$$E(g(X)) = \int g(x)\,f(x)\,dx.$$
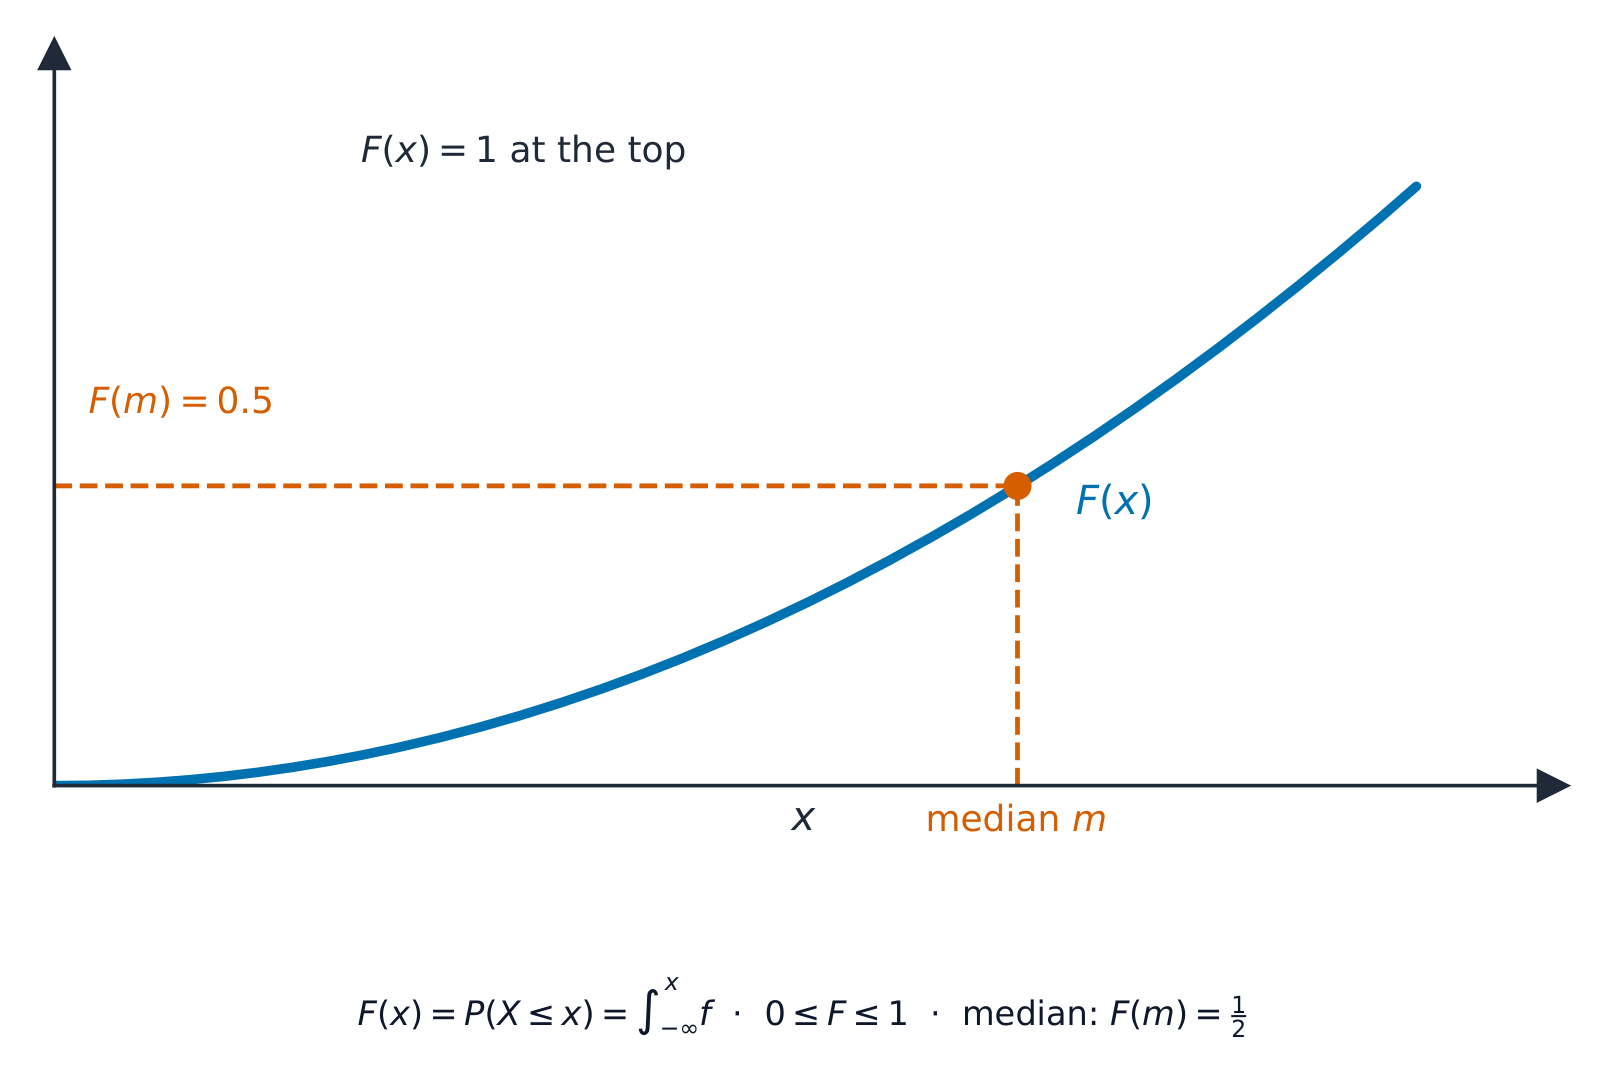
The cumulative distribution function 累积分布函数 $F(x) = P(X \leqslant x)$ is the running total: $F(x) = \displaystyle\int_{-\infty}^{x} f(t)\,dt$, and $f(x) = F'(x)$ wherever the density is continuous. Use $F$ to find probabilities and percentiles 百分位数 (for example, the median 中位数 solves $F(x) = 0.5$).
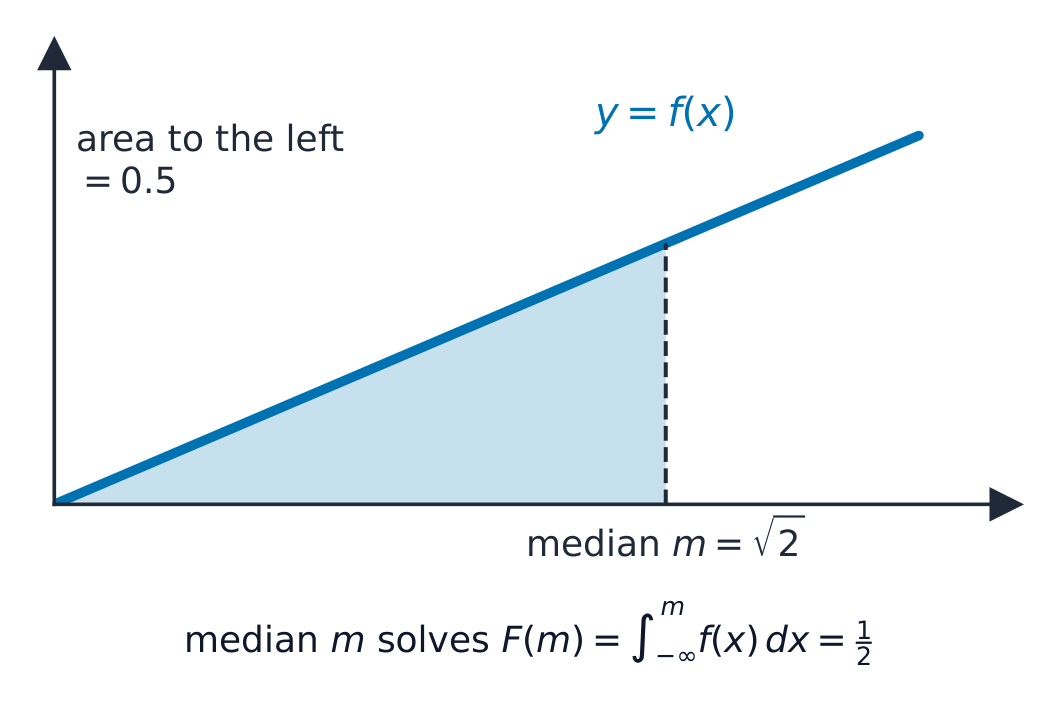
Worked example. A variable has $f(x) = \tfrac12 x$ for $0 \leqslant x \leqslant 2$. Find the median.
The cumulative distribution function is $F(x) = \displaystyle\int_0^x \tfrac12 t\,dt = \tfrac14 x^2$. Set $F(m) = 0.5$:
$$\tfrac14 m^2 = 0.5 \;\Rightarrow\; m^2 = 2 \;\Rightarrow\; m = \sqrt{2} = 1.41.$$
Worked example: mean, variance and $E(g(X))$. For the same $f(x)=\tfrac12 x$ on $[0,2]$:
$$E(X)=\int_0^2 x\cdot\tfrac12 x\,dx=\left[\frac{x^3}{6}\right]_0^2=\frac43, \qquad E(X^2)=\int_0^2 x^2\cdot\tfrac12 x\,dx=\left[\frac{x^4}{8}\right]_0^2=2,$$
$$\mathrm{Var}(X)=E(X^2)-\big(E(X)\big)^2=2-\frac{16}{9}=\frac29.$$
The same rule handles any $g$: $E\!\left(\tfrac1X\right)=\displaystyle\int_0^2 \frac1x\cdot\tfrac12 x\,dx=\int_0^2\tfrac12\,dx=1$. Note that $E\!\left(\tfrac1X\right)=1$ is not $\dfrac{1}{E(X)}=\tfrac34$.
The distribution of a related variable. If $Y=g(X)$, find $Y$'s distribution through its cumulative function. For $Y=X^2$: $F_Y(y)=P(X^2\leqslant y)=P(-\sqrt y\leqslant X\leqslant\sqrt y)=F_X(\sqrt y)-F_X(-\sqrt y)$, then differentiate for $f_Y=F_Y'$. When $g$ is monotonic increasing there is a shortcut, $F_Y(y)=F_X\big(g^{-1}(y)\big)$.
Worked example. With $f_X(x)=\tfrac12 x$ on $[0,2]$ (so $F_X(x)=\tfrac14 x^2$), let $Y=X^2$. For $0\leqslant y\leqslant 4$, $F_Y(y)=F_X(\sqrt y)=\tfrac14 y$, so $f_Y(y)=F_Y'(y)=\tfrac14$ – that is, $Y$ is uniform on $[0,4]$.
For $Y=X^3$ (the syllabus example) the range becomes $0\leqslant y\leqslant 8$, and $F_Y(y)=F_X\big(y^{1/3}\big)=\tfrac14 y^{2/3}$, so $f_Y(y)=\tfrac16 y^{-1/3}$. Always state the new range of $Y$ first.
Explore
Density area becomes cumulative height
$f(x)=2x/b^2,\quad F(x)=x^2/b^2\ (0\le x\le b)$
Match the rising density on [0, 2] to its cumulative probability. A bound selects an area; a percentile finds the bound for a given area.
Vocabulary
Train
| English |
|---|
| probability density function/ˌprɒbəˈbɪlɪti ˈdensɪti ˈfʌŋkʃn/ |
| cumulative distribution function/ˈkjuːmjʊlətɪv ˌdɪstrɪˈbjuːʃn ˈfʌŋkʃn/ |
| percentiles/pəˈsentaɪlz/ |
| median/ˈmiːdiːən/ |
4.2
Inference using normal and t-distributions

Syllabus
| Candidates should be able to: | Notes and examples |
|---|---|
| formulate hypotheses and apply a hypothesis test concerning the population mean using a small sample drawn from a normal population of unknown variance, using a t-test | |
| calculate a pooled estimate of a population variance from two samples | Calculations based on either raw or summarised data may be required. |
| formulate hypotheses concerning the difference of population means, and apply, as appropriate: - a 2-sample t-test - a paired sample t-test - a test using a normal distribution | The ability to select the test appropriate to the circumstances of a problem is expected. |
| determine a confidence interval for a population mean, based on a small sample from a normal population with unknown variance, using a t-distribution | |
| determine a confidence interval for a difference of population means, using a t-distribution or a normal distribution, as appropriate. |
Source: Cambridge International syllabus
For an independent random sample from a normal population with unknown variance, base your hypothesis test 假设检验 for the mean on the $t$-distribution. This assumption is especially important for a small sample. The same idea gives a confidence interval 置信区间 for the mean:
$$\bar{x} \pm t\,\frac{s}{\sqrt{n}},$$
where $t$ comes from the $t$-tables with $n - 1$ degrees of freedom. To compare two populations, use a two-sample (2-sample) or paired-sample $t$-test, after finding a pooled estimate 合并估计 of the shared variance when appropriate.

Worked example. An independent random sample of $n = 10$ from a normal population has mean $\bar{x} = 50$ and sample standard deviation $s = 4$ (using the $n-1$ divisor). Find a $95\%$ confidence interval for the mean (use $t = 2.262$ for $9$ degrees of freedom).
$$50 \pm 2.262\times\frac{4}{\sqrt{10}} = 50 \pm 2.86 \;\Rightarrow\; (47.1,\ 52.9).$$
Worked example: one-sample $t$-test. The same sample is used to test a claim that the population mean is $52$, at the $5\%$ level, assuming the population is normal. $H_0:\mu=52$, $H_1:\mu\neq52$.
$$t=\frac{\bar x-\mu_0}{s/\sqrt n}=\frac{50-52}{4/\sqrt{10}}=-1.58.$$
The critical values are $\pm2.262$ ($9$ degrees of freedom, two-tailed $5\%$). Since $|-1.58|<2.262$, do not reject $H_0$: there is insufficient evidence that the mean differs from $52$. This agrees with the interval, which contains $52$.
Worked example: two-sample $t$-test with a pooled variance. Two independent samples from normal populations with a common variance: sample A has $n_A=8$, $\bar x_A=24.5$, $s_A^2=4.2$; sample B has $n_B=10$, $\bar x_B=22.1$, $s_B^2=5.0$ (unbiased estimates). Test $H_0:\mu_A=\mu_B$ against $H_1:\mu_A\neq\mu_B$ at the $5\%$ level.
The pooled estimate weights each variance by its degrees of freedom:
$$s_p^2=\frac{(n_A-1)s_A^2+(n_B-1)s_B^2}{n_A+n_B-2}=\frac{7(4.2)+9(5.0)}{16}=\frac{74.4}{16}=4.65.$$
$$t=\frac{\bar x_A-\bar x_B}{\sqrt{s_p^2\left(\frac{1}{n_A}+\frac{1}{n_B}\right)}}=\frac{24.5-22.1}{\sqrt{4.65\left(\frac18+\frac1{10}\right)}}=\frac{2.4}{1.023}=2.35.$$
With $16$ degrees of freedom the two-tailed $5\%$ critical value is $2.120$. Since $2.35>2.120$, reject $H_0$: there is evidence that the population means differ. The matching $95\%$ confidence interval for $\mu_A-\mu_B$ is $2.4\pm2.120(1.023)$, which is $(0.23,\ 4.57)$, and it excludes $0$.
Worked example: paired $t$-test. Six runners are timed before and after a training plan. The improvements (before minus after, in seconds) are $1.2$, $0.8$, $-0.3$, $1.5$, $0.9$, $0.6$. The same runners appear twice, so work with the differences as one sample: $\bar d=0.783$ and $s_d=0.618$. With $H_0:\mu_d=0$ and $H_1:\mu_d>0$,
$$t=\frac{0.783}{0.618/\sqrt6}=3.11.$$
The one-tailed $5\%$ critical value for $5$ degrees of freedom is $2.015$. Since $3.11>2.015$, reject $H_0$: there is evidence that the plan improves times, assuming the differences are normally distributed. A two-sample test here would be wrong, because the two sets of times are not independent.
Choosing the test. Same individuals measured twice → paired $t$. Two independent small samples from normal populations with a common variance → pooled two-sample $t$. Large samples (or known variances) → a test using the normal distribution, with $\sqrt{\tfrac{s_A^2}{n_A}+\tfrac{s_B^2}{n_B}}$ for independent large samples. If the population variances are known, use those variances in place of the sample estimates; exact small-sample normal inference also needs normal populations.
Explore
Why small samples need t instead of z
With $\sigma$ unknown you use $t$, and $t$ has heavier tails than the normal (drawn dashed behind it) — so its critical values are larger and the interval is wider. At the worked example's $9$ degrees of freedom the widget reads $t^* = 2.262$, exactly the table value used above. Sweep df up and $t$ collapses onto the normal.
Explore
The normal distribution
Shade a tail to find a probability — the basis of confidence intervals and hypothesis tests.
Vocabulary
Train
| English |
|---|
| hypothesis test/haɪˈpɒθəsɪs test/ |
| confidence interval/ˈkɒnfɪdəns ˈɪntəvl/ |
| pooled estimate/puːld ˈestɪmət/ |
4.3
Chi-squared tests
Syllabus
| Candidates should be able to: | Notes and examples |
|---|---|
| fit a theoretical distribution, as prescribed by a given hypothesis, to given data | Questions will not involve lengthy calculations. |
| use a $\chi^2$-test, with the appropriate number of degrees of freedom, to carry out the corresponding goodness of fit analysis | Classes should be combined so that each expected frequency is at least 5. |
| use a $\chi^2$-test, with the appropriate number of degrees of freedom, for independence in a contingency table. | Yates’ correction is not required. Where appropriate, either rows or columns should be combined so that the expected frequency in each cell is at least 5. |
Source: Cambridge International syllabus
A $\chi^2$-test (chi-squared test 卡方检验) compares observed counts $O$ with expected counts $E$ from a theoretical distribution 理论分布:
$$\chi^2 = \sum \frac{(O - E)^2}{E}.$$
Use independent observations, with positive expected counts large enough for the chi-squared approximation; combine suitable classes if needed. Compare with a table value for the right number of degrees of freedom 自由度. Two uses: a goodness of fit 拟合优度 test (does the data follow the proposed model?), and a test for independence 独立性 of two variables in a contingency table 列联表.
Worked example. Four equally likely categories give observed counts $20, 30, 25, 25$ (so each expected count is $25$). Test the fit at the $5\%$ level.
$$\chi^2 = \frac{(20-25)^2 + (30-25)^2 + 0 + 0}{25} = \frac{25 + 25}{25} = 2.$$
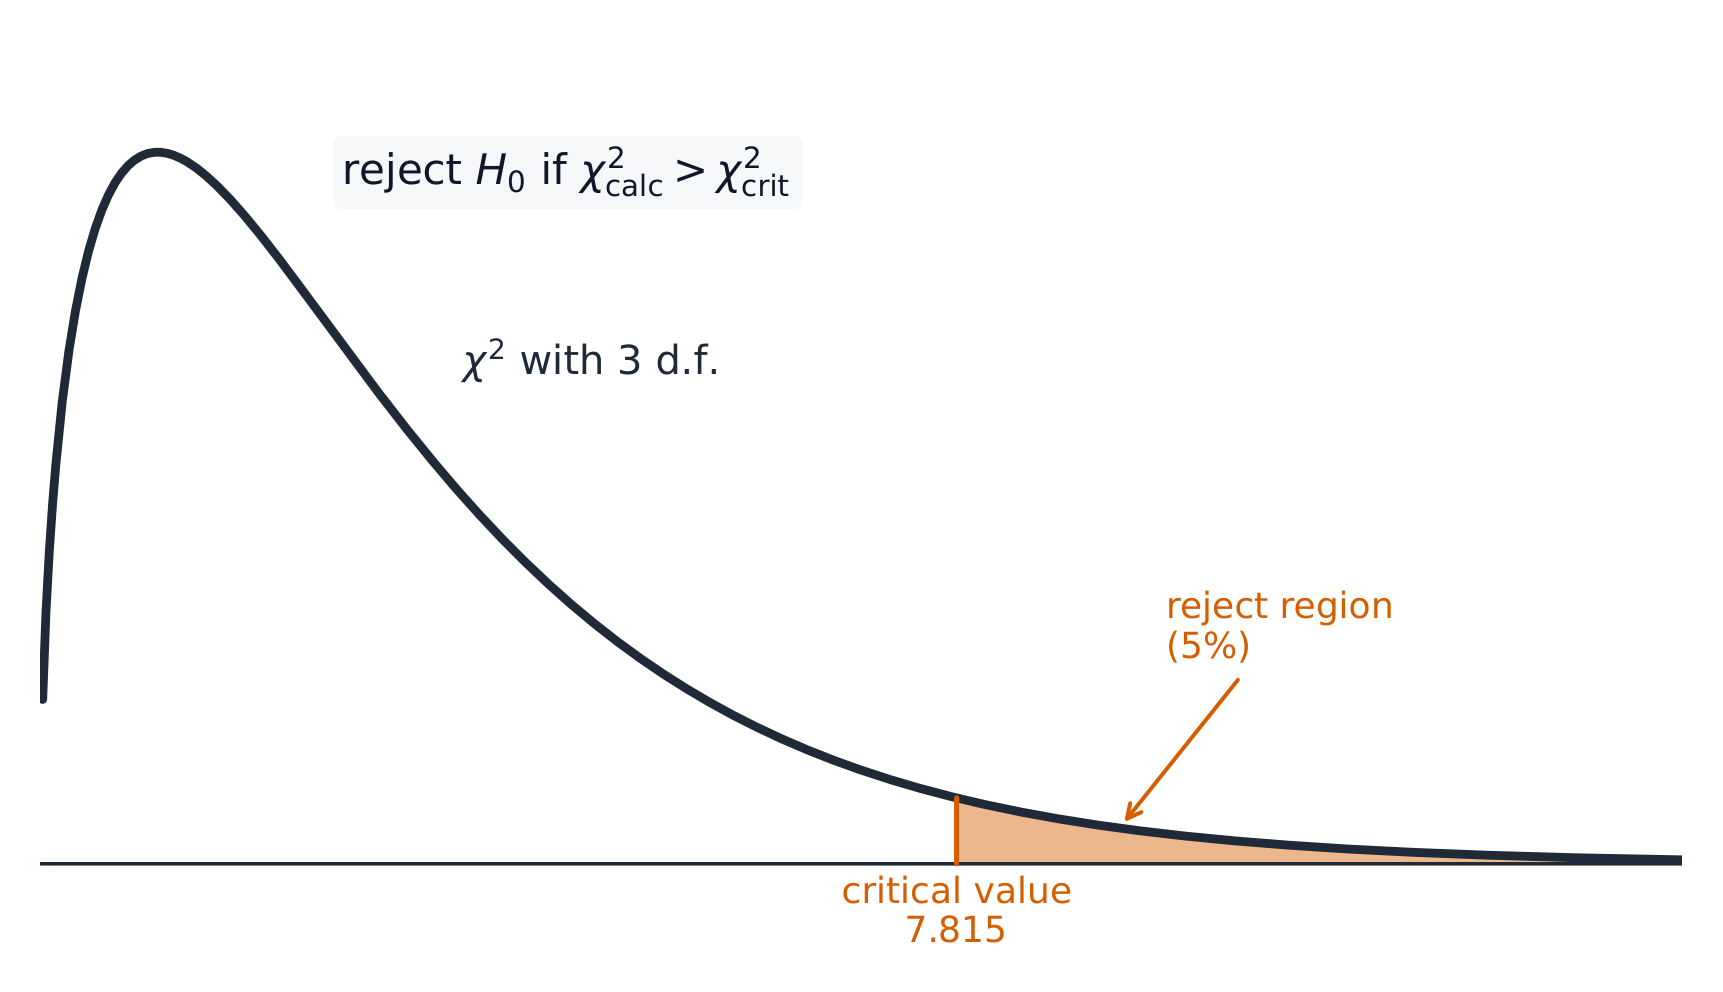
With $4 - 1 = 3$ degrees of freedom the table value is $7.815$. Since $2 < 7.815$, do not reject the model.
Worked example: fitting a prescribed distribution. $80$ families with three children are counted by number of girls. Test, at the $5\%$ level, whether $B(3,\,0.5)$ fits.
| Girls | $0$ | $1$ | $2$ | $3$ |
|---|---|---|---|---|
| $O$ | $6$ | $28$ | $34$ | $12$ |
| $E=80\times P$ | $80\times\tfrac18=10$ | $80\times\tfrac38=30$ | $30$ | $10$ |
$$\chi^2=\frac{(6-10)^2}{10}+\frac{(28-30)^2}{30}+\frac{(34-30)^2}{30}+\frac{(12-10)^2}{10}=1.6+0.133+0.533+0.4=2.67.$$
All expected values are at least $5$, so no classes are combined. The degrees of freedom are $4-1=3$ (critical value $7.815$); since $2.67<7.815$, do not reject $B(3,\,0.5)$. If $p$ had been estimated from the data, one more degree of freedom is lost: $\nu=4-1-1=2$.
Worked example: contingency table. $100$ students are classified by course and by whether they passed.
| Pass | Fail | Total | |
|---|---|---|---|
| Course A | $30$ | $20$ | $50$ |
| Course B | $20$ | $30$ | $50$ |
| Total | $50$ | $50$ | $100$ |
Each expected value is $\dfrac{\text{row total}\times\text{column total}}{\text{grand total}}=\dfrac{50\times50}{100}=25$, so
$$\chi^2=\frac{(30-25)^2+(20-25)^2+(20-25)^2+(30-25)^2}{25}=\frac{100}{25}=4.$$
There is $(2-1)(2-1)=1$ degree of freedom, and the $5\%$ critical value is $3.841$. Since $4>3.841$, reject $H_0$: there is evidence that the result is not independent of the course. (Yates' correction is not required in this syllabus.)
Explore
The chi-squared distribution and its 5% tail
The worked example on this page gives $\chi^2 = 2$ with $3$ degrees of freedom against a table value of $7.815$ — the widget reproduces both. Drag df to see why the critical value changes with the number of categories.
Explore
Chi-squared test route
Follow observed and expected counts to a test decision.
Vocabulary
Train
| English |
|---|
| chi-squared test/kaɪ skweəd test/ |
| theoretical distribution/θɪəˈretɪkl ˌdɪstrɪˈbjuːʃn/ |
| degrees of freedom/dɪˈɡriːz ɒv ˈfriːdəm/ |
| goodness of fit/ˈɡʊdnəs ɒv fɪt/ |
| independence/ˌɪndɪˈpendəns/ |
| contingency table/kənˈtɪndʒənsi ˈteɪbl/ |
4.4
Non-parametric tests

Syllabus
| Candidates should be able to: | Notes and examples |
|---|---|
| understand the idea of a non-parametric test and appreciate situations in which such a test might be useful | e.g. when sampling from a population which cannot be assumed to be normally distributed. |
| understand the basis of the sign test, the Wilcoxon signed-rank test and the Wilcoxon rank-sum test | Including knowledge that Wilcoxon tests are valid only for symmetrical distributions. |
| use a single-sample sign test and a single-sample Wilcoxon signed-rank test to test a hypothesis concerning a population median | Including the use of normal approximations where appropriate. Questions will not involve tied ranks or observations equal to the population median value being tested. |
| use a paired-sample sign test, a Wilcoxon matched-pairs signed-rank test and a Wilcoxon rank-sum test, as appropriate, to test for identity of populations. | Including the use of normal approximations where appropriate. Questions will not involve tied ranks or zero‑difference pairs. |
Source: Cambridge International syllabus
A non-parametric test 非参数检验 does not require a normal population, but still has sampling assumptions; the signed-rank test also needs a symmetric distribution of differences to test its centre. The basic ones are:
- the sign test 符号检验: count how many values fall above and below a proposed median, and test those counts with a binomial model;
- the Wilcoxon signed-rank test 威尔科克森符号秩检验 (the matched-pairs test for paired data), which also uses the sizes of the differences, not just their signs;
- the Wilcoxon rank-sum test 威尔科克森秩和检验, for comparing two separate samples.
Worked example. Test whether a median is $5$. In a sample of $10$ values (none equal to $5$), $9$ lie above $5$ and $1$ lies below. Test at the $5\%$ level (two-tailed).
Under $H_0$ (median $= 5$) the number above follows $B(10, 0.5)$. The observed result ($9$ above) is extreme, so find $P(X \geq 9) = \binom{10}{9}(0.5)^{10} + (0.5)^{10} = \dfrac{11}{1024} = 0.0107$. For a two-tailed test compare with $\tfrac{1}{2}(5\%) = 0.025$. Since $0.0107 < 0.025$, reject $H_0$: there is evidence the median is not $5$.
Worked example: Wilcoxon signed-rank test. A machine is set so that the median mass of a bag is $20$ g. Eight bags have masses $23.1$, $18.4$, $26.0$, $21.7$, $19.5$, $27.3$, $24.8$, $22.2$ g. Test at the $5\%$ level whether the median is greater than $20$ g, assuming the distribution is symmetric.
Subtract $20$, then rank the differences by size, ignoring sign:
| Difference | $-0.5$ | $-1.6$ | $1.7$ | $2.2$ | $3.1$ | $4.8$ | $6.0$ | $7.3$ |
|---|---|---|---|---|---|---|---|---|
| Rank | $1$ | $2$ | $3$ | $4$ | $5$ | $6$ | $7$ | $8$ |
The sum of the negative ranks is $P_-=1+2=3$; the positive ranks sum to $36-3=33$. Under $H_1$ (median $>20$) negative differences should be rare, so the test statistic is $T=3$. For $n=8$ the one-tailed $5\%$ critical value is $5$, and $3\leqslant5$, so reject $H_0$: there is evidence that the median mass is above $20$ g. A sign test on the same data ($6$ of $8$ above) gives $P(X\geqslant6)=0.145$ and would not reject: using the sizes can give the Wilcoxon test greater power under its symmetry assumption; this one sample does not establish a general power comparison.
For $n$ larger than the tables, a sum of positive ranks (or a sum of negative ranks) has the following approximate normal distribution under the null, when there are no zero differences or tied absolute differences. Use a continuity correction; ties need adjusted variance. The minimum of both rank sums is not itself distributed this way:
$$T\sim N\!\left(\frac{n(n+1)}{4},\ \frac{n(n+1)(2n+1)}{24}\right)\ \text{approximately}.$$
Worked example: Wilcoxon rank-sum test. Two independent samples of reaction times (ms). A: $12$, $15$, $18$, $21$, $25$. B: $14$, $19$, $22$, $26$, $28$, $30$. Test at the $5\%$ level (two-tailed) whether the populations are identical.
Rank all $11$ values together: $12(1)$, $14(2)$, $15(3)$, $18(4)$, $19(5)$, $21(6)$, $22(7)$, $25(8)$, $26(9)$, $28(10)$, $30(11)$. The smaller sample is A ($m=5$, $n=6$); its rank sum is $R_m=1+3+4+6+8=22$. Also find $m(m+n+1)-R_m=5(12)-22=38$, and take the smaller: $W=22$.
For $m=5$, $n=6$ the two-tailed $5\%$ critical value is $18$. Since $22>18$, do not reject $H_0$: there is insufficient evidence of a difference between the populations.
Explore
Non-parametric test chooser
Choose the rank-based test that matches the data situation.
Vocabulary
Train
| English |
|---|
| non-parametric test/nɒn ˌpærəˈmetrɪk test/ |
| sign test/saɪn test/ |
| Wilcoxon signed-rank test/ˈwɪlkɒksn saɪnd ræŋk test/ |
| Wilcoxon rank-sum test/ˈwɪlkɒksn ræŋk sʌm test/ |
4.5
Probability generating functions

Syllabus
| Candidates should be able to: | Notes and examples |
|---|---|
| understand the concept of a probability generating function (PGF) and construct and use the PGF for given distributions | Including the discrete uniform, binomial, geometric and Poisson distributions. |
| use formulae for the mean and variance of a discrete random variable in terms of its PGF, and use these formulae to calculate the mean and variance of a given probability distribution | |
| use the result that the PGF of the sum of independent random variables is the product of the PGFs of those random variables. |
Source: Cambridge International syllabus
The probability generating function 概率母函数 of a non-negative integer-valued variable $X$ is
$$G(t) = E(t^X) = \sum_x P(X = x)\,t^x.$$
It packs the whole distribution into one function. When the corresponding moments are finite, the mean and variance come from its derivatives at $t = 1$: $E(X) = G'(1)$ and $\mathrm{Var}(X) = G''(1) + G'(1) - \big(G'(1)\big)^2$. Also, the PGF of a sum of independent variables is the product of their PGFs.
Worked example. $X$ has $P(X=0) = 0.5$, $P(X=1) = 0.3$, $P(X=2) = 0.2$. Find $E(X)$ using the PGF.
Here $G(t) = 0.5 + 0.3t + 0.2t^2$, so $G'(t) = 0.3 + 0.4t$ and
$$E(X) = G'(1) = 0.3 + 0.4 = 0.7.$$
Differentiate again for the variance: $G''(t)=0.4$, so
$$\mathrm{Var}(X)=G''(1)+G'(1)-\big(G'(1)\big)^2=0.4+0.7-0.49=0.61.$$
(Check directly: $E(X^2)=0.3+0.8=1.1$ and $1.1-0.7^2=0.61$.)
Standard PGFs (with $q=1-p$): discrete uniform on $1,\dots,n$: $\dfrac{t(1-t^n)}{n(1-t)}$; binomial $B(n,p)$: $(q+pt)^n$; geometric $\mathrm{Geo}(p)$ on $1,2,\dots$: $\dfrac{pt}{1-qt}$; Poisson $\mathrm{Po}(\lambda)$: $e^{\lambda(t-1)}$.
Worked example: Poisson mean and variance. For $G(t)=e^{\lambda(t-1)}$: $G'(t)=\lambda e^{\lambda(t-1)}$ and $G''(t)=\lambda^2 e^{\lambda(t-1)}$, so $G'(1)=\lambda$ and $G''(1)=\lambda^2$. Then $E(X)=\lambda$ and $\mathrm{Var}(X)=\lambda^2+\lambda-\lambda^2=\lambda$.
Worked example: sum of independent variables. $X_1$ and $X_2$ are independent copies of the variable above. The PGF of $Y=X_1+X_2$ is the product:
$$G_Y(t)=\big(0.5+0.3t+0.2t^2\big)^2=0.25+0.3t+0.29t^2+0.12t^3+0.04t^4.$$
So, for example, $P(Y=2)=0.29$: the $t^2$ coefficient collects $0.5\times0.2$ twice and $0.3\times0.3$ once. The coefficients add to $1$, a quick check.

Explore
Probability generating function lab
G(x) = p0 + p1 x + p2 x^2 + ...
Change x and see how a PGF stores probabilities in powers of x.
Vocabulary
Train
| English |
|---|
| probability generating function/ˌprɒbəˈbɪlɪti ˈdʒenəreɪtɪŋ ˈfʌŋkʃn/ |
| Further Probability & Statistics/ˈfɜːðə ˌprɒbəˈbɪlɪti ænd stəˈtɪstɪks/ |
4.5
Exam tips
- For a continuous random variable, the pdf integrates to $1$ over its range, and $E(X) = \int x f(x)\,dx$.
- Use the $t$-distribution when the sample is small and the population variance is unknown; state the degrees of freedom.
- For a chi-squared test compute $\sum (O-E)^2/E$, compare with the critical value at the right degrees of freedom, and combine classes with $E < 5$.
- State $H_0$ and $H_1$ and give the conclusion in context for every test.
Interactive lessons on this topic
Work through it step by step, with instant-check exercises.