Skip to content · ⁨コンテンツへスキップ⁩

Supply and Demand · ⁨需給⁩

AP Microeconomics · ⁨AP 経済学⁩ · Topic 2 · ⁨トピック 2⁩

View Slides · ⁨查看幻灯片⁩ Train · ⁨練習する⁩
Video lesson for this topic · ⁨このトピックのビデオレッスン⁩ Open the video page · ⁨動画ページを開く⁩
10:39

需給

なぜコーヒー一杯の価格はそのようになっているのか? 誰かが決めたわけではない。委員会もあれば公式価格表もない。購入者だけがいて、価格が下がればより多く欲しがったり、…

English narration · English + 中文 subtitles burned in · ⁨英語ナレーション・英語+中文字幕 burning-in⁩

2.1

Demand · ⁨需要⁩

Syllabus · ⁨シラバス⁩
English

Enduring Understanding (MKT-3): Individuals and firms respond to incentives and face constraints.

Learning Objective MKT-3.A: a. Define (using graphs as appropriate) key terms and factors related to consumer decision making and the law of demand. b. Explain (using graphs as appropriate) the relationship between price and quantity demanded and how buyers respond to incentives and constraints.

  • MKT-3.A.1 A well-defined system of property rights is necessary for the market system to function well.
  • MKT-3.A.2 Economic agents respond to incentives.
  • MKT-3.A.3 Individuals often respond to incentives, such as those presented by prices, but also face constraints, such as income, time, and legal and regulatory frameworks.
  • MKT-3.A.4 The law of demand suggests that a change in the own-price causes a change in quantity demanded in the opposite direction and a movement along a demand (marginal benefit) curve.
  • MKT-3.A.5 The conceptual relationship between price and quantity stated by the law of demand leads to downward-sloping demand curves explained by the income effect and substitution effect and/or by diminishing marginal utility.
  • MKT-3.A.6 The market demand curve (schedule) is derived from the summation of individual demand curves (schedules).

Learning Objective MKT-3.B: Explain (using graphs as appropriate) buyers' responses to changes in incentives and constraints.

  • MKT-3.B.1 Changes in the determinants of consumer demand can cause the demand curve to shift.
日本語

永続的な理解(MKT-3): 個人および企業はインセンティブに反応し、制約に直面する。

学習目標 MKT-3.A: a. 消费者の意思決定と需要の法則に関連する主要な用語および要因を定義する(必要に応じてグラフを使用)。 b. 価格と需求量の関係、および買い手がインセンティブや制約にどのように反応するかを説明する(必要に応じてグラフを使用)。

  • MKT-3.A.1 市場システムが良好に機能するためには、明確に定義された財産権の体系が必要である。
  • MKT-3.A.2 経済主体はインセンティブに反応する。
  • MKT-3.A.3 個人は価格などのインセンティブに反応することが多いが、所得、時間、法的・規制枠組みなどの制約にも直面する。
  • MKT-3.A.4 需要の法則は、自己価格の変化が需求量の変化を引き起こし、その方向は逆であり、需要曲線(限界便益曲線)上での移動をもたらすことを示唆している。
  • MKT-3.A.5 需要の法則によって述べられた価格と需求量との概念的关系は、所得効果および代替効果、または限界効用逓減の原理によって説明される右下がりの需要曲線につながる。
  • MKT-3.A.6 市場需要曲線(表)は、個々の需要曲線(表)の総和として導かれる。

学習目標 MKT-3.B: 買い手がインセンティブや制約の変化にどのように反応するかを説明する(必要に応じてグラフを使用)。

  • MKT-3.B.1 消費者需要の決定要因の変化は、需要曲線のシフトを引き起こすことができる。
Source: College Board AP Course and Exam Description · ⁨出典: College Board AP コースおよび試験説明書⁩

English
Supply & demand: a shift raises P and Q

A market works only where property rights 产权 are well defined – owners can use, exclude others from, and trade their resources; without them, prices cannot coordinate exchange. Within that framework, the two forces are demand and supply.

Demand 需求 is the relationship between the price of a good and the quantity buyers are willing and able to buy. The law of demand 需求定律 says price and quantity demanded move in opposite directions, so the demand curve slopes downward. Two reasons: the substitution effect 替代效应 (when a good gets pricier, buyers switch to alternatives) and the income effect 收入效应 (a higher price shrinks real purchasing power).

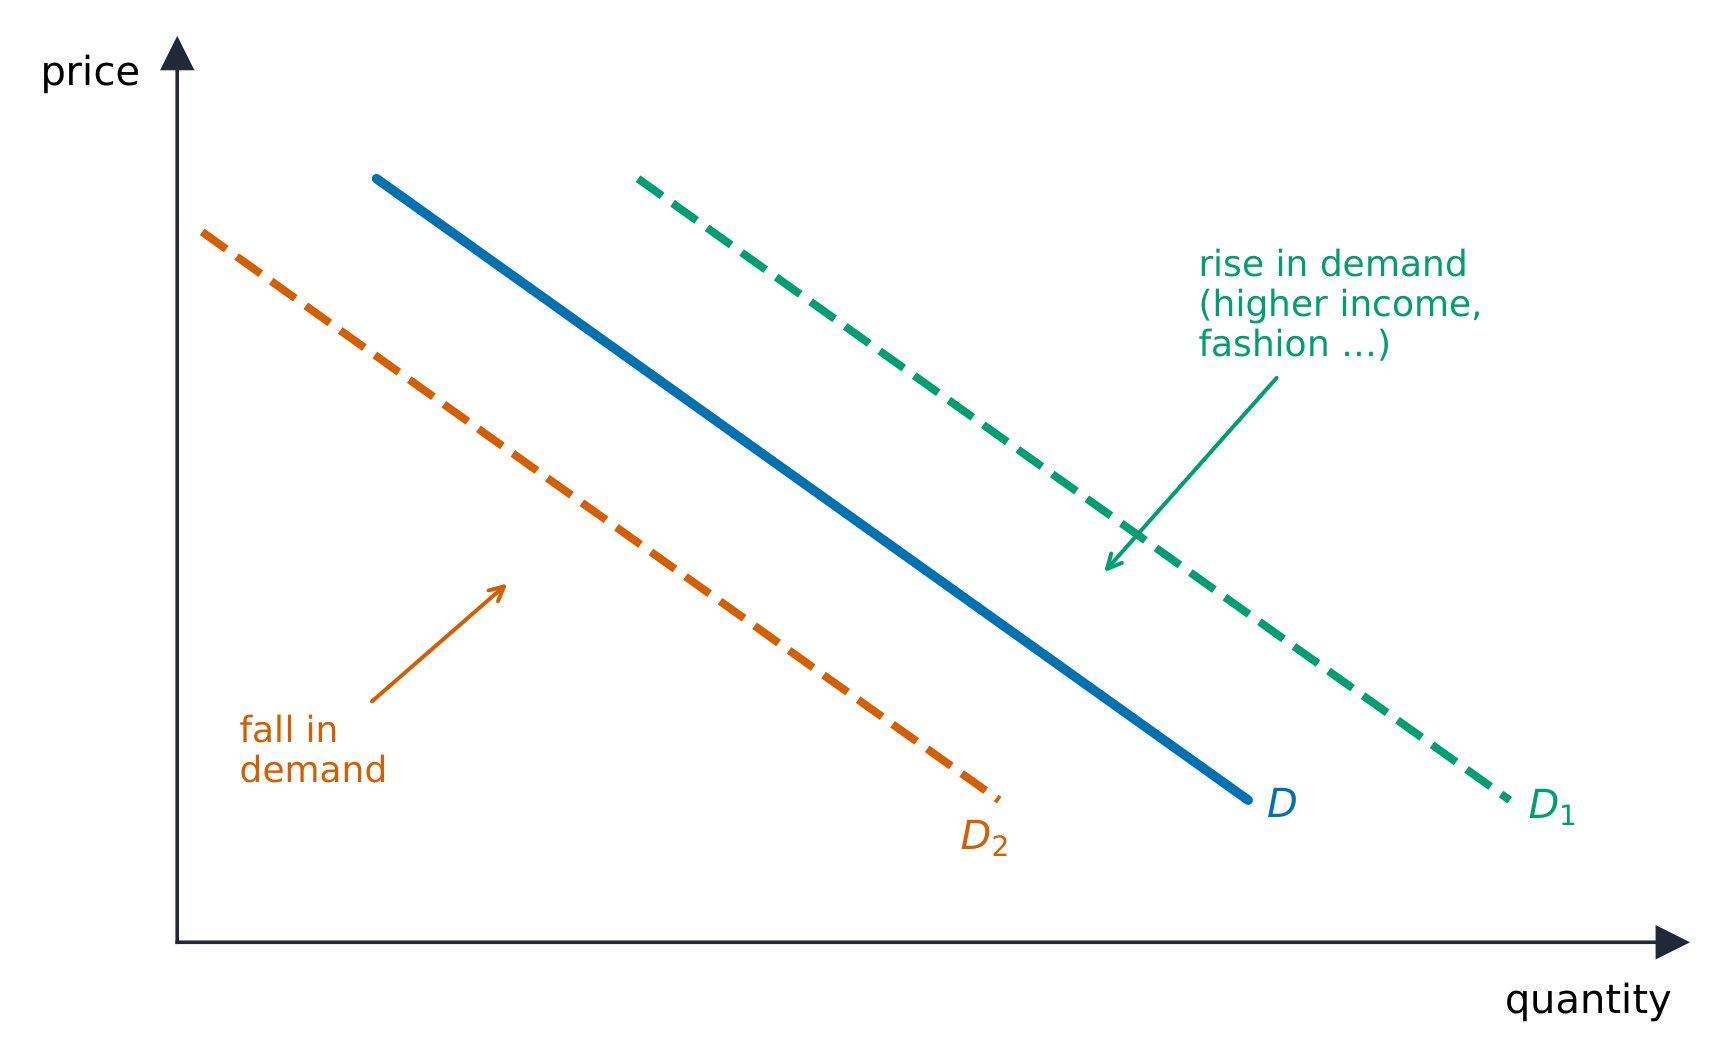
Distinguish a change in quantity demanded (a move along the curve, caused only by the good's own price) from a change in demand (a shift of the whole curve). Demand shifts with the determinants 决定因素, remembered as TRIBE:

  • Tastes/preferences,
  • Related goods – a rise in the price of a substitute 替代品 raises demand; a rise in the price of a complement 互补品 lowers it,
  • Income – for a normal good 正常商品 more income raises demand; for an inferior good 低档商品 it lowers it,
  • Buyers (number of consumers),
  • Expectations of future price or income.

The market demand curve is the horizontal summation 水平相加 of every individual buyer's demand curve – at each price, add up the quantities all buyers want. That is why more buyers (the B above) shifts the whole market curve to the right.

日本語
市場での買い物客:需要は、価格に対する需要量の反応を示す
市場の消費者:需要とは価格に対する需求量の反応度を示す
需給:シフトがPとQを上昇させる

市場が機能するのは 所有権 が明確に定義されている場所のみである所有者は資源を使用し、他者を排除し、取引できる。所有権がない場合、価格は交換を調整できない。その枠組みの中で2つの力は需要と供給である。

需要 は財の価格と買い手が買おうとして購入可能な数量との関係である。需要の法則 は価格と需求量が 逆方向 に動くことを示すため、需要曲線は 下向き になる。2つの理由がある:代替効果(財が高くなると買い手は代替品へ移行する)と 所得効果(高値は実質的な購買力を縮小させる)。

需要曲線は右下がりに傾き、所得、嗜好、関連価格がそれをシフトさせる
需要曲線は右下がりであり、所得、嗜好、関連価格がこれをシフトさせる

需求量の変化(曲線 上 の移動で、財の 自己価格 によって引き起こされるもの)と 需要の変化(曲線全体が ずれる こと)を区別する。需要は ** determinants(決定要因)** でシフトし、TRIBE と覚える:

  • Tastes/preferences(嗜好・好み)、
  • Related goods(関連財): substitute(代替財) の価格上昇は需要を増やし、 complement(補完財) の価格上昇は需要を減らす。
  • Income(所得): normal good(正常財) では所得増は需要を増やす; inferior good(劣等財) では減少させる。
  • Buyers(買い手の数)、
  • Expectations of future price or income(将来の価格や所得への見通し)。

市場需要曲線 は個々の買い手の需要曲線の 水平総和 である。各価格において、すべての買い手が求める数量を加算する。そのため、買い手が増えると(上記の B )市場全体の曲線が右へシフトする。

Explore · ⁨探索⁩

Shift demand and watch price and quantity · ⁨需要を変化させ、価格と量を観察する⁩

The demand curve slopes down: lower price, more wanted. A change in income, tastes or related-good prices shifts the whole curve, moving the equilibrium. · ⁨需要曲線は右下がりである:価格が下がれば需要量が増える。所得、嗜好、関連財の価格の変化は曲線全体をシフトさせ、均衡点を変更する。⁩

Vocabulary · ⁨語彙⁩ Train · ⁨練習する⁩
English 日本語
property rights/ˈprɒpəti raɪts/ 財産権
Demand/dɪˈmænd/ 需要
law of demand/lɔː ɒv dɪˈmænd/ 需要の法則
substitution effect/ˌsʌbstɪˈtjuːʃn ɪˈfekt/ 代替効果
income effect/ˈɪŋkʌm ɪˈfekt/ 所得効果によるため
determinants/dɪˈtɜːmɪnənts/ 決定要因
substitute/ˈsʌbstɪtjuːt/ 置換
complement/ˈkɒmplɪmənt/ 補完
normal good/ˈnɔːml ɡʊd/ 正常財への需要を増やす
inferior good/ɪnˈfɪərɪə ɡʊd/ 劣等財への需要を増やす
horizontal summation/ˌhɒrɪˈzɒntl sʌˈmeɪʃn/ 水平方向の合算
Supply/səˈplaɪ/ 供給
law of supply/lɔː ɒv səˈplaɪ/ 供給の法則
subsidies/ˈsʌbsɪdiz/ 補助金
Price elasticity of demand/praɪs ɪlæˈstɪsɪti ɒv dɪˈmænd/ 需要の価格弾性
2.2

Supply · ⁨供給⁩

Syllabus · ⁨シラバス⁩
English

Enduring Understanding (MKT-3): Individuals and firms respond to incentives and face constraints.

Learning Objective MKT-3.C: a. Define (using graphs as appropriate) the law of supply. b. Explain (using graphs as appropriate) the relationship between price and quantity supplied.

  • MKT-3.C.1 A change in own-price causes a change in quantity supplied in the same direction and a movement along a supply curve.
  • MKT-3.C.2 The market supply curve (schedule) is derived from the summation of individual supply curves (schedules). The market supply curve is upward-sloping.

Learning Objective MKT-3.D: Explain (using graphs as appropriate) producers' (sellers') responses to changes in incentives and technology.

  • MKT-3.D.1 Changes in the determinants of supply can cause the supply curve to shift.
日本語

永続的な理解(MKT-3): 個人および企業はインセンティブに反応し、制約に直面する。

学習目標 MKT-3.C: a. 供給の法則を定義する(グラフを使用する場合)。 b. 価格と供給量の関係を説明する(必要に応じてグラフを使用)。

  • MKT-3.C.1 自己価格の変化は、同じ方向への供給量の変化および供給曲線上での移動を引き起こす。
  • MKT-3.C.2 市場供給曲線(表)は、個々の供給曲線(表)の総和として導かれる。市場供給曲線は右上がりである。

学習目標 MKT-3.D: 生産者(売り手)がインセンティブや技術の変化にどのように反応するかを説明する(必要に応じてグラフを使用)。

  • MKT-3.D.1 供給の決定要因の変化は、供給曲線のシフトを引き起こすことができる。

Source: College Board AP Course and Exam Description · ⁨出典: College Board AP コースおよび試験説明書⁩

English
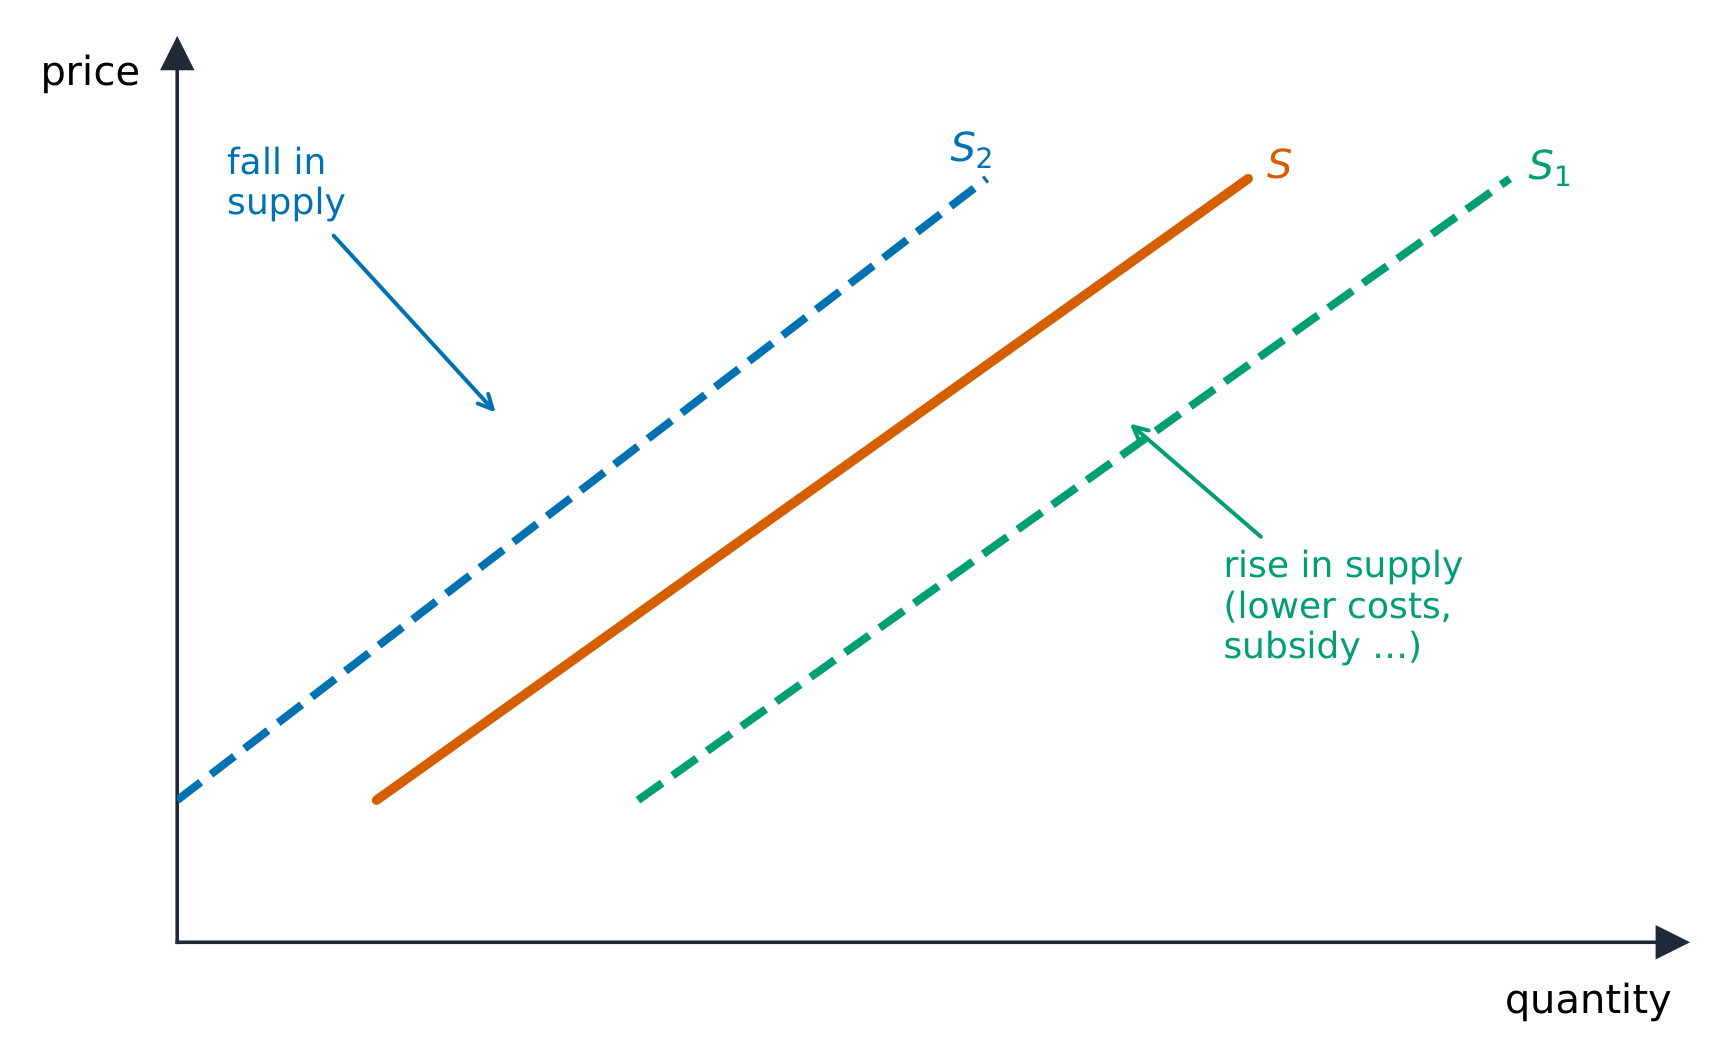
A shift in supply

Supply 供给 is the relationship between price and the quantity sellers will offer. The law of supply 供给定律: price and quantity supplied move in the same direction, so the supply curve slopes upward (higher prices cover higher marginal costs and reward more output).

Again separate a change in quantity supplied (movement along the curve, from the good's own price) from a change in supply (a shift). Supply shifts with input prices, technology, taxes and subsidies 补贴, prices of other goods a firm could make, number of sellers, and expectations. Just like demand, the market supply curve is the horizontal sum of individual firms' supply curves – add the quantities all firms offer at each price – so more sellers shifts market supply to the right.

Exam skill: on the free-response section you must draw correctly labeled supply-and-demand graphs and shift the right curve in the right direction – decide first whether the event changes an "own price" (move along) or a determinant (shift).

日本語
供給の変化

供給 は価格と売り手が提供しようとする数量との関係である。供給の法則 :価格と供給量は 同じ方向 に動くため、供給曲線は 上向き である(高い価格は高い限界費用をカバーし、より多くの生産に対して報酬を与える)。

供給曲線は右上がりに傾き、コスト、技術、税金、補助金がそれをシフトさせる
供給曲線は右上がりであり、コスト、技術、税、補助金がこれをシフトさせる

再び 供給量の変化 (曲線沿いの移動、財の自己価格によるもの)と 供給の変化 (シフト)を分ける。供給は 投入財の価格 、 技術 、税金と 補助金 、企業が製造可能な 他の財の価格 、 売り手の数 、そして 見通し でシフトする。需要と同じく、 市場供給曲線 は各企業の供給曲線の水平総和であり、各価格での全企業の供給量を合計するため、売り手が増えると市場供給曲線は右へシフトする。

試験技能: フリー回答部分では、正しくラベル付けされた需給グラフを描き、正しい 曲線を 正しい 方向へシフトさせなければならない。まず、その出来事が「自己価格」の変化(曲線沿い)なのか、それとも「決定要因」の変化(シフト)なのかを判断せよ。

2.3

Price Elasticity of Demand · ⁨需要の価格弾性⁩

Syllabus · ⁨シラバス⁩
English

Enduring Understanding (MKT-3): Individuals and firms respond to incentives and face constraints.

Learning Objective MKT-3.E: a. Define measures of elasticity. b. Explain (using graphs where appropriate) measures of elasticity and the impact of a given price change on total revenue or total expenditure. c. Calculate (using data from a graph or a table as appropriate) measures of elasticity.

  • MKT-3.E.1 Economists use the concept of elasticity to measure the magnitude of percentage changes in quantity owing to any given changes in the own-price, income, and prices of related goods.
  • MKT-3.E.2 Price elasticity of demand is measured by the percentage change in quantity demanded divided by the percentage change in price or the responsiveness of the quantity demanded to changes in price. Elasticity varies along a linear demand curve, meaning slope is not elasticity.
  • MKT-3.E.3 Ranges of values of elasticity of demand are described as elastic or inelastic with the separating benchmark being a magnitude of 1, where the change in the price and the change in the quantity demanded are proportional.
    • a. When the magnitude of the value of elasticity is greater than 1, the demand is described as being elastic with respect to that price in the range of the given change.
    • b. When the magnitude of the value of elasticity is less than 1, the demand is described as being inelastic with respect to that price in the range of the given change.
    • c. When the magnitude of the value of elasticity is equal to 1, the demand is described as being unit elastic with respect to that price in the range of the given change.
  • MKT-3.E.4 The price elasticity of demand depends on certain factors such as the availability of substitutes.
  • MKT-3.E.5 The impact of a given price change on total revenue or total expenditure will depend on whether demand is elastic, inelastic, or unit elastic.
日本語

永続的な理解(MKT-3): 個人および企業はインセンティブに反応し、制約に直面する。

学習目標 MKT-3.E: a. 弾力性の指標を定義する。 b. 弾力性の指標と、特定の価格変化が総収入または総支出に与える影響を説明する(適切な場合にグラフを使用して)。 c. 弾力性の指標を計算する(グラフまたは表のデータを使用して、適切な場合)。

  • MKT-3.E.1 経済学者は、弾力性の概念を用いて、自己価格、所得、関連商品の価格などのある特定の変化による需求量の百分率変化の大きさを測定する。
  • MKT-3.E.2 需要の価格弾力性は、需求量の百分率変化を価格の百分率変化で割った値、または価格の変化に対する需求量の応答度によって測定される。弾力性は直線的な需要曲線上で異なるため、傾きとは弾力性を意味しない。
  • MKT-3.E.3 需要の弾力性の値の範囲は、弾力的か非弾力的かに分類され、その境界となる基準値は1であり、このとき価格の変化と需求量の変化は比例する。
    • a. 弾力性の値の絶対値が1より大きい場合、その価格について、指定された変化の範囲では需要は弾力的であるとされる。
    • b. 弾力性の値の絶対値が1より小さい場合、その価格について、指定された変化の範囲では需要は非弾力的であるとされる。
    • c. 弾力性の値の絶対値が1に等しい場合、その価格について、指定された変化の範囲では需要は単一弾力的であるとされる。
  • MKT-3.E.4 需要の価格弾力性は、代替財の可用性などの特定の要因に依存する。
  • MKT-3.E.5 特定の価格変化が総収入または総支出に与える影響は、需要が弾力的か非弾力的か、あるいは単一弾力的かによって異なる。

Source: College Board AP Course and Exam Description · ⁨出典: College Board AP コースおよび試験説明書⁩

English
Price elasticity of demand

Price elasticity of demand 需求价格弹性 measures how responsive quantity demanded is to a price change:

$$E_d=\left|\frac{\%\ \Delta\ \text{quantity demanded}}{\%\ \Delta\ \text{price}}\right|.$$

  • $E_d>1$: elastic 富有弹性 (quantity responds strongly);
  • $E_d<1$: inelastic 缺乏弹性 (quantity barely responds);
  • $E_d=1$: unit elastic.

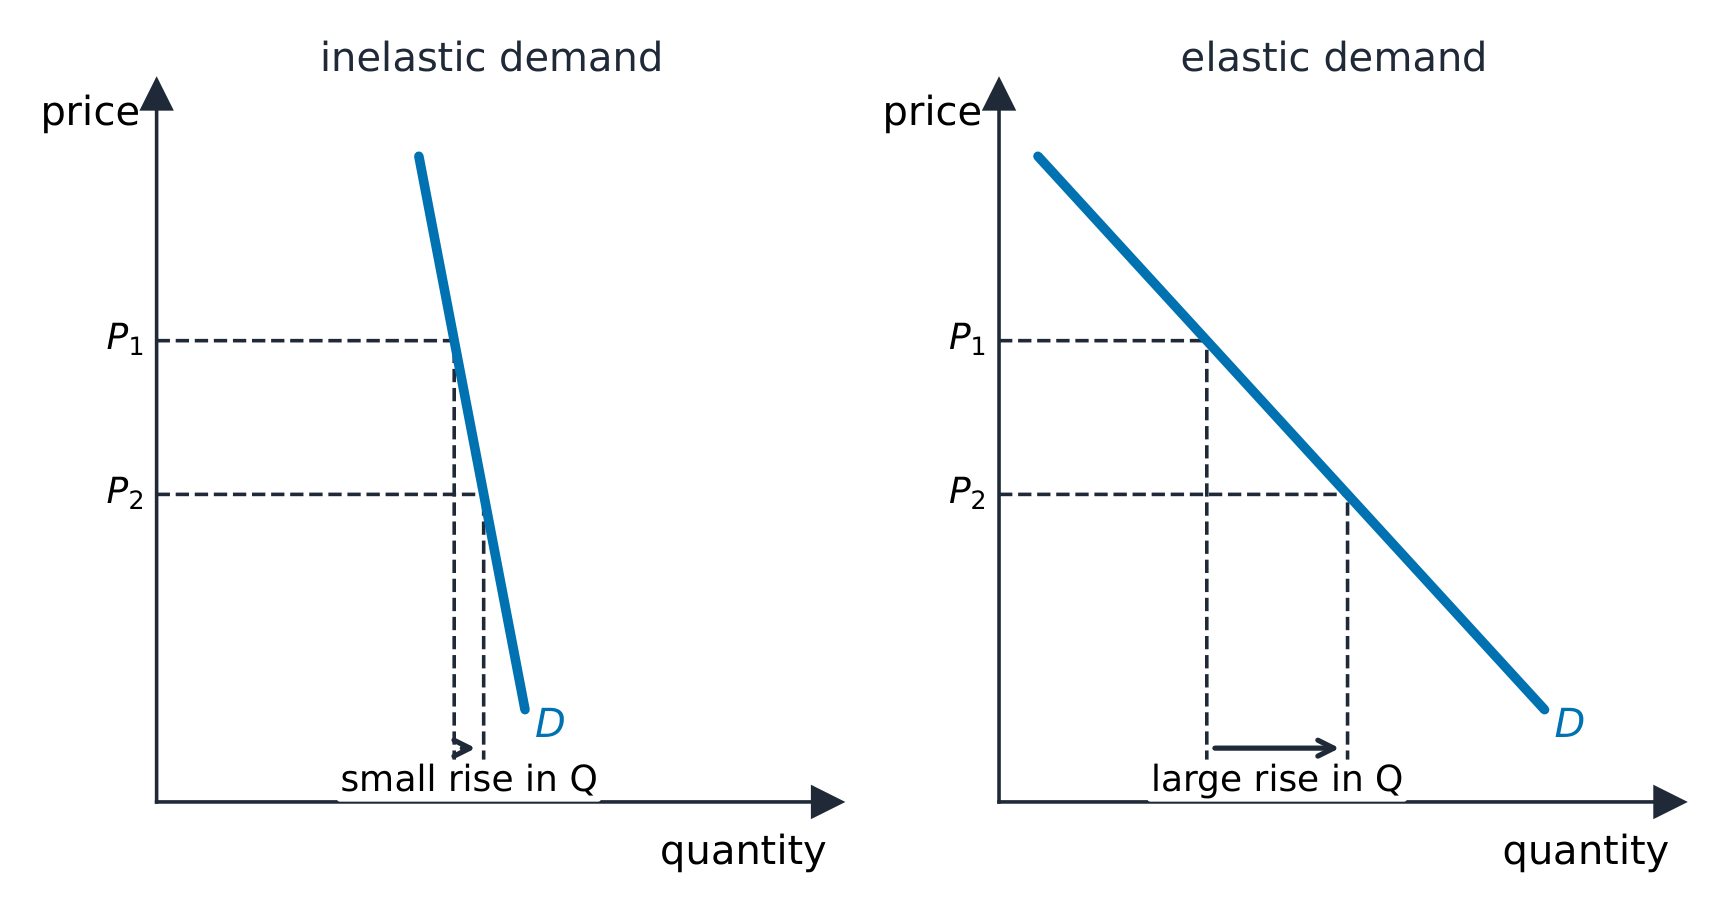
Demand is more elastic when there are more substitutes, the good is a luxury, it takes a large share of income, or buyers have more time to adjust. Elasticity links to total revenue 总收入 ($P\times Q$): if demand is elastic, a price cut raises revenue; if inelastic, a price cut lowers it. Along a straight-line demand curve, elasticity falls as you move down (elastic on top, inelastic at the bottom).

Worked example. A price rise from $\$10$ to $\$12$ (a $+20\%$ change) cuts quantity demanded from $100$ to $85$ (a $-15\%$ change). Then $E_d=\left|\dfrac{-15\%}{20\%}\right|=0.75<1$, so demand is inelastic. Because it is inelastic, the price rise raises total revenue: from $\$10\times100=\$1000$ to $\$12\times85=\$1020$.

日本語
需要の価格弾性

需要の価格弾性 は、価格変化に対する需求量の反応度を測る:

$$E_d=\left|\frac{\%\ \Delta\ \text{quantity demanded}}{\%\ \Delta\ \text{price}}\right|.$$

非弾力的 vs 弾力的な需要:価格変化に対する小さな反応と大きな反応
  • $E_d>1$: 弾力大(elastic)(数量が強く反応する)。
  • $E_d<1$: 非弾力(inelastic)(数量がほとんど反応しない)。
  • $E_d=1$: 単一弾力(unit elastic) 。

代替財が多くある場合、財が 高級財 である場合、所得に占める割合が大きい場合、または買い手が調整に より多くの時間 がある場合に需要はより弾力大となる。弾性は 総収益 ($P\times Q$)と関連する:需要が弾力大であれば、値下げは収益を 上げる ;非弾力であれば、値下げは収益を 下げる 。直線的な需要曲線では、下に移動するにつれて弾性は低下する(上部は弾力大、下部は非弾力)。

演習例。 価格が $\$10$ to $\$12$ ($+20\%$ の変化)から上昇し、需要量が $100$ から $85$ ($-15\%$ の変化)へ減少しました。すると $E_d=\left|\dfrac{-15\%}{20\%}\right|=0.75<1$ となるため、需要は非弾力的です。非弾力的であるため、価格の上昇は総収益を引き上げます:$\$10\times100=\$1000$ から $\$12\times85=\$1020$ へ。

Explore · ⁨探索⁩

Stretch price and measure elasticity · ⁨価格を変化させて弾性度を測定する⁩

Price elasticity of demand is how strongly quantity responds to price. A steep curve is inelastic (small response); a shallow one is elastic (large response). · ⁨需給価格弾性とは、価格変化に対する需要量の反応の度合いである。急な曲線は非弾力的(反応が小さい)、緩やかな曲線は弾力的(反応が大きい)。⁩

Vocabulary · ⁨語彙⁩ Train · ⁨練習する⁩
English 日本語
elastic/ɪˈlæstɪk/ 弾性
inelastic/ɪnɪˈlæstɪk/ 非弾力的
total revenue/ˈtəʊtl ˈrevənjuː/ 総収益
Price elasticity of supply/praɪs ɪlæˈstɪsɪti ɒv səˈplaɪ/ 供給の価格弾性
Cross-price elasticity/krɒs praɪs ɪlæˈstɪsɪti/ 代替財価格弾力性
Income elasticity/ˈɪŋkʌm ɪlæˈstɪsɪti/ 所得弾力性
2.4

Price Elasticity of Supply · ⁨供給の価格弾性⁩

Syllabus · ⁨シラバス⁩
English

Enduring Understanding (MKT-3): Individuals and firms respond to incentives and face constraints.

Learning Objective MKT-3.E: a. Define measures of elasticity. b. Explain (using graphs where appropriate) measures of elasticity and the impact of a given price change on total revenue or total expenditure. c. Calculate (using data from a graph or a table as appropriate) measures of elasticity.

  • MKT-3.E.6 Price elasticity of supply is measured by the percentage change in quantity supplied divided by the percentage change in price, or the responsiveness of the quantity supplied to changes in price.
  • MKT-3.E.7 Ranges of values of elasticity of supply are described as elastic or inelastic with the separating benchmark being a magnitude of 1, where the change in the price and the change in the quantity supplied are proportional.
    • a. When the magnitude of the value of elasticity is greater than 1, the supply is described as being elastic with respect to that price in the range of the given change.
    • b. When the magnitude of the value of elasticity is less than 1, the supply is described as being inelastic with respect to that price in the range of the given change.
    • c. When the magnitude of the value of elasticity is equal to 1, the supply is described as being unit elastic with respect to that price in the range of the given change.
  • MKT-3.E.8 The price elasticity of supply depends on certain factors such as the price of alternative inputs.
日本語

永続的な理解(MKT-3): 個人および企業はインセンティブに反応し、制約に直面する。

学習目標 MKT-3.E: a. 弾力性の指標を定義する。 b. 弾力性の指標と、特定の価格変化が総収入または総支出に与える影響を説明する(適切な場合にグラフを使用して)。 c. 弾力性の指標を計算する(グラフまたは表のデータを使用して、適切な場合)。

  • MKT-3.E.6 供給の価格弾力性は、供給量の百分率変化を価格の百分率変化で割った値、または価格の変化に対する供給量の応答度によって測定される。
  • MKT-3.E.7 供給の弾力性の値の範囲は、弾力的か非弾力的かに分類され、その境界となる基準値は1であり、このとき価格の変化と供給量の変化は比例する。
    • a. 弾力性の値の絶対値が1より大きい場合、その価格について、指定された変化の範囲では供給は弾力的であるとされる。
    • b. 弾力性の値の絶対値が1より小さい場合、その価格について、指定された変化の範囲では供給は非弾力的であるとされる。
    • c. 弾力性の値の絶対値が1に等しい場合、その価格について、指定された変化の範囲では供給は単一弾力的であるとされる。
  • MKT-3.E.8 供給の価格弾力性は、代替投入財の価格などの特定の要因に依存する。

Source: College Board AP Course and Exam Description · ⁨出典: College Board AP コースおよび試験説明書⁩

English

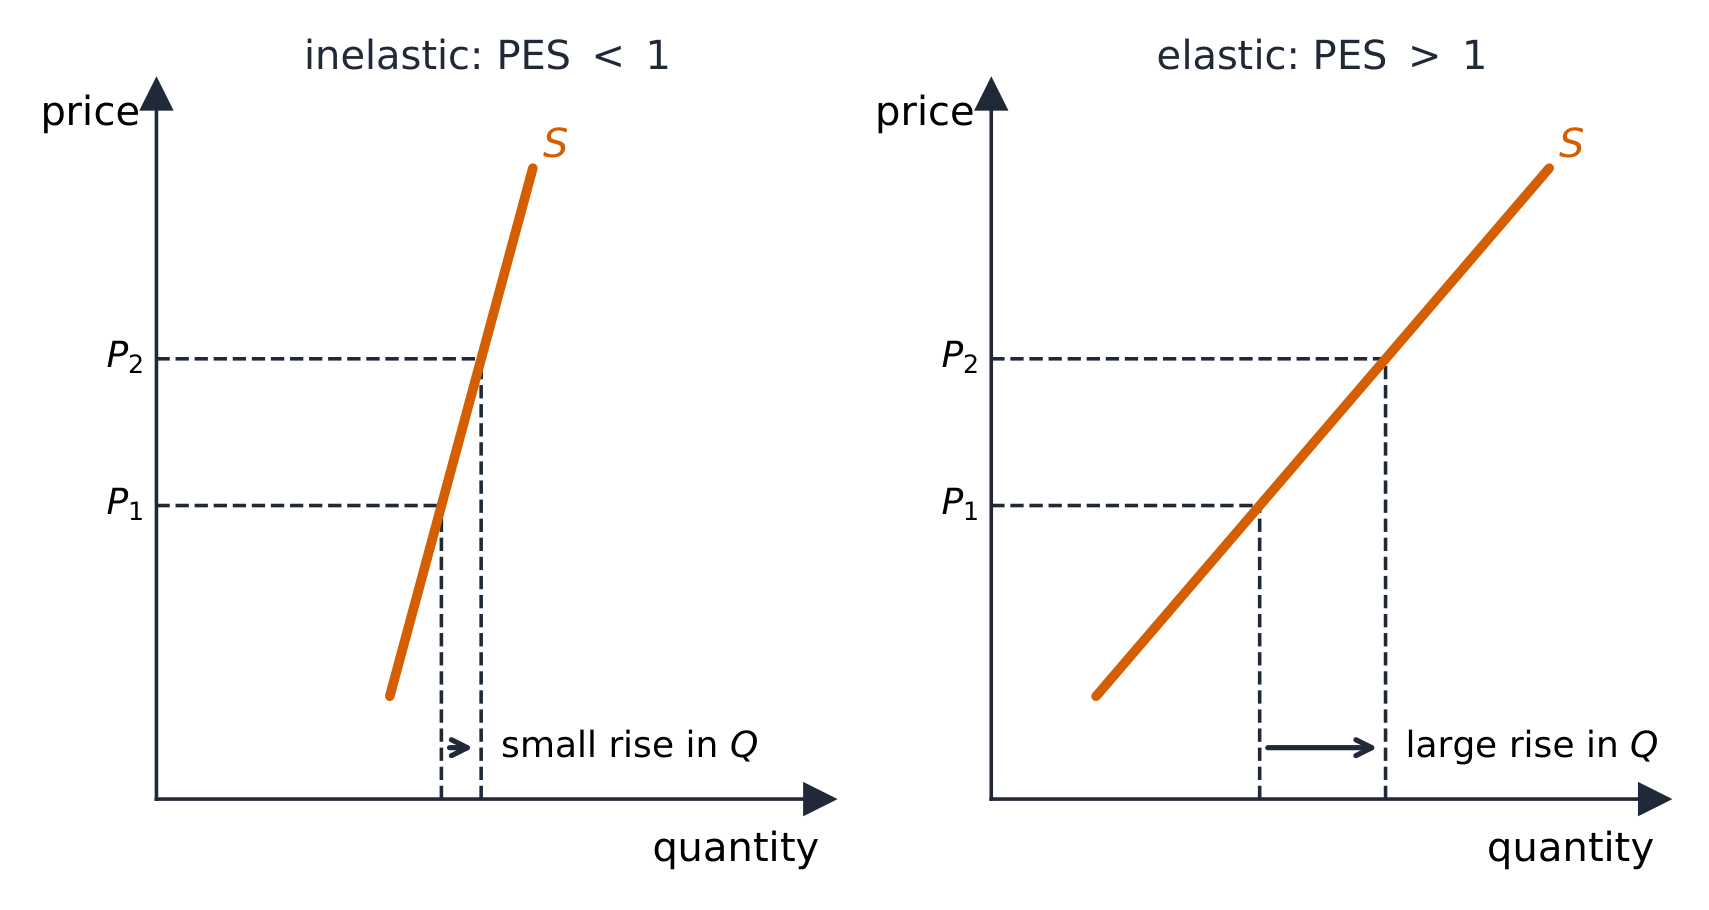
Price elasticity of supply 供给价格弹性, $E_s=\dfrac{\%\ \Delta\ Q_s}{\%\ \Delta\ P}$, measures how responsive sellers are. Supply is more elastic when firms can adjust output easily – spare capacity, storable goods, and above all more time (supply is more elastic in the long run than the short run).

日本語

供給の価格弾性 、$E_s=\dfrac{\%\ \Delta\ Q_s}{\%\ \Delta\ P}$、は売り手の反応度を測る。企業が生産量調整が容易な場合、供給はより弾力大となる:余剰生産能力、保管可能な商品、そして何より より多くの時間 (長期的には短期的よりも供給は弾力大である)。

同じ価格上昇でも、PES が 1 未満の場合は供給への反応は小さく、1 を超える場合は大きい
PESが1未満の場合は同じ価格上昇でも供給反応は小さく、1超えなら大きい
2.5

Other Elasticities · ⁨その他の弾性⁩

Syllabus · ⁨シラバス⁩
English

Enduring Understanding (MKT-3): Individuals and firms respond to incentives and face constraints.

Learning Objective MKT-3.E: a. Define measures of elasticity. b. Explain (using graphs where appropriate) measures of elasticity and the impact of a given price change on total revenue or total expenditure. c. Calculate (using data from a graph or a table as appropriate) measures of elasticity.

  • MKT-3.E.9 Elasticity can be measured for any determinant of demand or supply, not just the price.
  • MKT-3.E.10 Income elasticity of demand is measured by the percentage change in the quantity demanded divided by the percentage change in consumers' income. Economists use the income elasticity of demand to determine whether a good is normal or inferior.
  • MKT-3.E.11 Cross-price elasticity of demand is measured by the percentage change in the quantity demanded of one good divided by the percentage change in the price of another good. Economists use the cross-price elasticity of demand to determine whether goods are substitutes, complements, or not related.
日本語

永続的な理解(MKT-3): 個人および企業はインセンティブに反応し、制約に直面する。

学習目標 MKT-3.E: a. 弾力性の指標を定義する。 b. 弾力性の指標と、特定の価格変化が総収入または総支出に与える影響を説明する(適切な場合にグラフを使用して)。 c. 弾力性の指標を計算する(グラフまたは表のデータを使用して、適切な場合)。

  • MKT-3.E.9 弾力性は、価格だけでなく、需要または供給のあらゆる決定要因に対して測定できる。
  • MKT-3.E.10 需要の所得弾力性は、需求量の百分率変化を消費者の所得の百分率変化で割ることで測定される。経済学者は、需要の所得弾力性を用いて、ある財が正常財か劣等財かを判定する。
  • MKT-3.E.11 代替財・補完財の需要の相互価格弾力性は、ある財の需要量の百分率変化を、別の財の価格の百分率変化で割ることで測定される。経済学者は、財が代替財、補完財、あるいは無関係かを確認するために、需要の相互価格弾力性を使用する。

Source: College Board AP Course and Exam Description · ⁨出典: College Board AP コースおよび試験説明書⁩

English
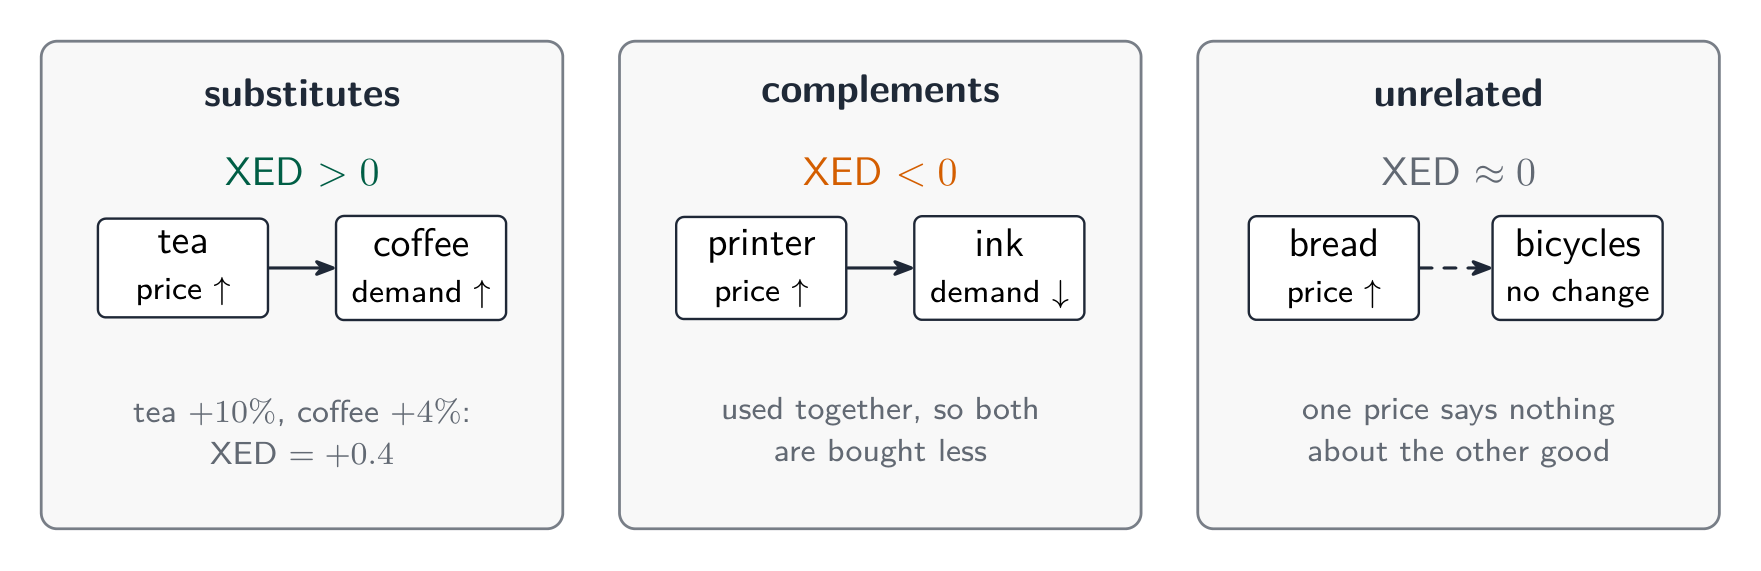
  • Cross-price elasticity 交叉价格弹性 $=\dfrac{\%\ \Delta\ Q_x}{\%\ \Delta\ P_y}$: positive for substitutes, negative for complements – the sign tells you the relationship.
  • Income elasticity 收入弹性 $=\dfrac{\%\ \Delta\ Q}{\%\ \Delta\ \text{income}}$: positive for normal goods (and $>1$ for luxuries), negative for inferior goods.

Worked example. When the price of coffee rises $10\%$, the quantity of tea demanded rises $6\%$: cross-price elasticity $=\dfrac{+6\%}{+10\%}=+0.6$. The positive sign confirms coffee and tea are substitutes. If instead a $5\%$ rise in incomes raised restaurant-meal demand $10\%$, income elasticity $=\dfrac{10\%}{5\%}=+2$ – a normal good, and a luxury since it exceeds $1$.

Exam skill: you are expected to compute an elasticity, classify it, and read a sign as evidence of substitute/complement or normal/inferior.

日本語
  • 相互価格弾性 $=\dfrac{\%\ \Delta\ Q_x}{\%\ \Delta\ P_y}$: positive(正) は代替財、 negative(負) は補完財 – 符号が関係性を示す。
  • 所得弾性 $=\dfrac{\%\ \Delta\ Q}{\%\ \Delta\ \text{income}}$: positive(正) は正常財(および luxuries(高級財) では $>1$ 以上)、 negative(負) は劣等財。

** worked example.** コーヒーの価格が $10\%$上昇すると、お茶の需要量は $6\%$増加する:代替財の交叉価格弾力性 $=\dfrac{+6\%}{+10\%}=+0.6$。 正の符号は、コーヒーとお茶が 代替財であることを裏付けている。逆に、所得が $5\%$上昇してレストランでの食事需要が $10\%$増加する場合、所得弾力性 $=\dfrac{10\%}{5\%}=+2$ は — 正常財であり、かつ $1$ を超えるため、高級財である。

代替財では正、補完財では負の交叉弾力性
代替財では正、補完財では負の交叉弾力性

試験技能: 弾力性を計算し、分類し、符号を代替・補完財または正常・劣等財の証拠として読み取る能力が求められる。

2.6

Market Equilibrium, Consumer Surplus, and Producer Surplus · ⁨市場均衡、消費者余剰、生産者余剰⁩

Syllabus · ⁨シラバス⁩
English

Enduring Understanding (MKT-4): Although equilibria are stable, an economy can move from one equilibrium to another if market conditions change.

Learning Objective MKT-4.A: a. Define (using graphs as appropriate) market equilibrium, consumer surplus, and producer surplus. b. Explain (using graphs as appropriate) how equilibrium price, quantity, consumer surplus, and producer surplus for a good or service are determined. c. Calculate (using data from a graph or table as appropriate) areas of consumer surplus and producer surplus at equilibrium.

  • MKT-4.A.1 The supply-demand model is a tool for understanding what factors influence prices and quantities and why prices and quantities might differ across markets or change over time.
  • MKT-4.A.2 In a perfectly competitive market, equilibrium is achieved (and markets clear with no shortages or surpluses) when the price of a good or service brings the quantity supplied and quantity demanded into balance, in the sense that buyers wish to purchase the same quantity that sellers wish to provide.
  • MKT-4.A.3 Equilibrium price provides information to economic decision-makers to guide resource allocation.
  • MKT-4.A.4 Economists use consumer surplus and producer surplus to measure the benefits markets create to buyers and sellers and understand market efficiency.
  • MKT-4.A.5 Market equilibrium maximizes total economic surplus in the absence of market failures, meaning that perfectly competitive markets are efficient.
日本語

持続的理解(MKT-4): 均衡は安定しているものの、市場条件が変われば経済は一つの均衡から別の均衡へ移行することがある。

学習目標 MKT-4.A: a. 市場均衡、消費者余剰、生産者余剰を定義せよ(必要に応じて図表を用いること)。 b. 財やサービスの均衡価格、均衡数量、消費者余剰、生産者余剰がどのように決定されるかを説明せよ(必要に応じて図表を用いること)。 c. 均衡における消費者余剰および生産者余剰の面積を計算せよ(必要に応じて図表または数値表のデータを用いること)。

  • MKT-4.A.1 需給モデルは、どのような要因が価格と数量に影響を与えるか、そしてなぜ価格と数量が市場間や時間の経過とともに異なるのかを理解するための道具である。
  • MKT-4.A.2 完全競争市場において、ある財やサービスの価格が供給量と需要量を整合させ、買い手が購入したい数量が売り手が提供したい数量と同じになる場合、均衡が達成され(不足も過剰もなく)、市場は清算される。
  • MKT-4.A.3 均衡価格は、経済意思決定者が資源配分を指導するための情報となる。
  • MKT-4.A.4 経済学者は、市場が生み出す買い手および売手の便益を測定し、市場の効率性を理解するために、消費者余剰および生産者余剰を使用する。
  • MKT-4.A.5 市場の失敗がない限り、市場均衡は総経済余剰を最大化するため、完全競争市場は効率的である。

Source: College Board AP Course and Exam Description · ⁨出典: College Board AP コースおよび試験説明書⁩

English
Consumer & producer surplus

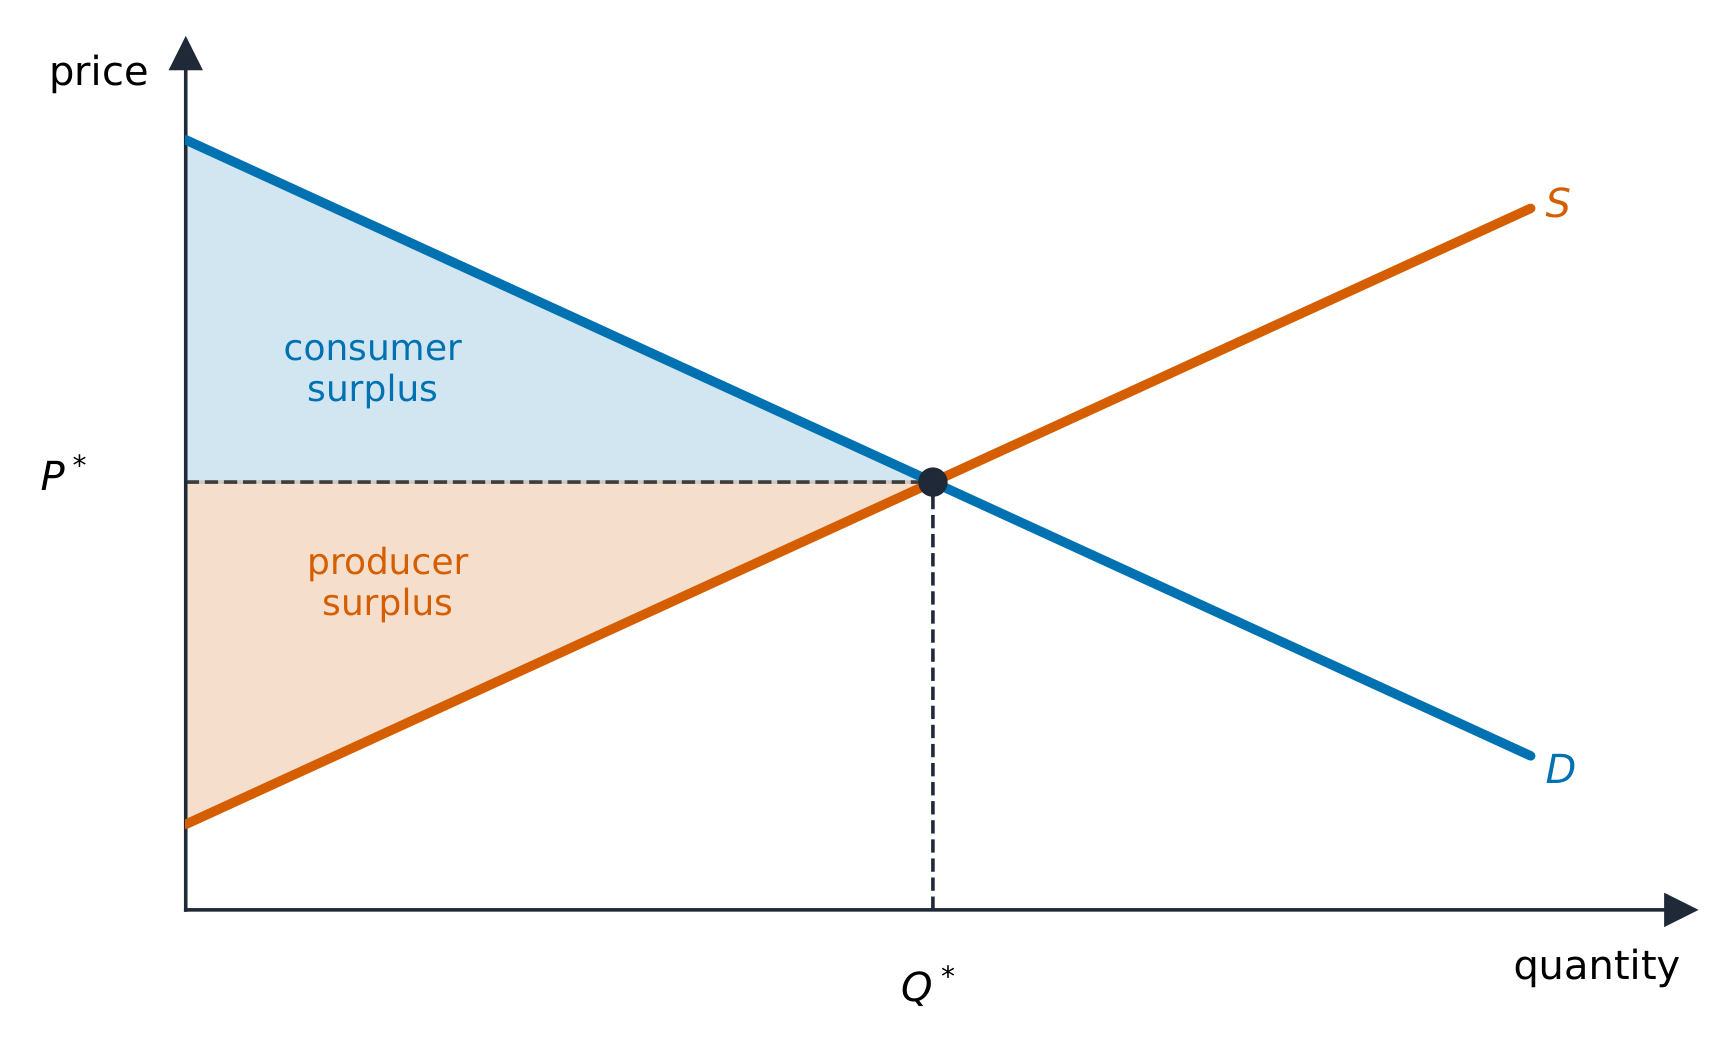
Equilibrium 均衡 is where supply meets demand: the equilibrium price clears the market, so quantity demanded equals quantity supplied and there is no shortage or surplus.

  • Consumer surplus 消费者剩余 is the area below the demand curve and above the price – the gap between what buyers would pay and what they do pay.
  • Producer surplus 生产者剩余 is the area above the supply curve and below the price – the gap between the price and sellers' minimum acceptable price.
  • Their sum is total surplus 总剩余, and the competitive equilibrium maximizes it – this is why free markets are called allocatively efficient 配置有效率.
日本語
消費者余剰と生産者余剰

均衡とは供給と需要が一致する点である:均衡価格は市場を適正化させるため、需要量と供給量が等しくなり、不足や過剰は生じない。

市場均衡における消費者余剰と生産者余剰
市場均衡における消費者余剰と生産者余剰
  • 消費者余剰は、需要曲線より下で価格より上にある領域 — 買い手が支払う意思のある金額と実際支払う金額の差額。
  • 生産者余剰は、供給曲線より上で価格より下にある領域 — 価格と売り手の最低許容価格との差額。
  • これらの合計は 総余剰 であり、競争的均衡はこれを 最大化 する — これが自由市場が 「配置効率性」 が高いと言われる理由である。
果物と野菜を販売する市場の屋台
実際の市場:多くの買い手と売り手が集まり、希望数量と提供数量が一致する価格で収束する
Explore · ⁨探索⁩

See consumer and producer surplus · ⁨消費者余剰と生産者余剰を見る⁩

At equilibrium the market clears. The gap between what buyers would pay and the price is consumer surplus; the gap above sellers' costs is producer surplus. · ⁨均衡において市場は清算される。買い手が出資できる価格と実際の価格との差が消費者余剰であり、売り手のコストより高い部分が生産者余剰である。⁩

Vocabulary · ⁨語彙⁩ Train · ⁨練習する⁩
English 日本語
Producer surplus/prəˈdjuːsə ˈsɜːpləs/ 生産者余剰
total surplus/ˈtəʊtl ˈsɜːpləs/ 総余剰
allocatively efficient/ˈæləkətɪvli ɪˈfɪʃənt/ 配置効率性が達成される。
surplus/ˈsɜːpləs/ 余剰を生む
shortage/ˈʃɔːtɪdʒ/ 不足を生む
2.7

Market Disequilibrium and Changes in Equilibrium · ⁨市場不均衡と均衡の変化⁩

Syllabus · ⁨シラバス⁩
English

Enduring Understanding (MKT-4): Although equilibria are stable, an economy can move from one equilibrium to another if market conditions change.

Learning Objective MKT-4.B: a. Define a surplus and shortage. b. Explain (using graphs where appropriate) how changes in underlying conditions and shocks to a competitive market can alter price, quantity, consumer surplus, and producer surplus. c. Calculate (using data from a graph or table as appropriate) changes in price, quantity, consumer surplus, and producer surplus in response to changes in market conditions or market disequilibrium.

  • MKT-4.B.1 Whenever markets experience imbalances—creating disequilibrium prices and quantities, surpluses, and shortages—market forces drive price and quantity toward equilibrium.
  • MKT-4.B.2 Factors that shift the market demand and market supply curves cause price, quantity, consumer surplus, producer surplus, and total economic surplus (within that market) to change. The impact of the change depends on the price elasticities of demand and supply.
日本語

持続的理解(MKT-4): 均衡は安定しているものの、市場条件が変われば経済は一つの均衡から別の均衡へ移行することがある。

学習目標 MKT-4.B: a. 過剰と不足を定義する。 b. 基礎となる条件の変化や完全競争市場へのショックが、価格、数量、消費者余剰、生産者余剰にどのように影響するかを説明せよ(必要に応じて図表を用いること)。 c. 市場条件の変化や市場の不均衡に対する対応として、価格、数量、消費者余剰、生産者余剰の変化を計算せよ(必要に応じて図表または数値表のデータを用いること)。

  • MKT-4.B.1 市場に不均衡が発生し、不均衡な価格や数量、過剰、不足が生じた場合、市場の力が価格と数量を均衡に向かわせる。
  • MKT-4.B.2 市場需要曲線および市場供給曲線をシフトさせる要因により、価格、数量、消費者余剰、生産者余剰、およびその市場内の総経済余剰が変化する。この変化の影響は、需要および供給の価格弾力性に依存する。

Source: College Board AP Course and Exam Description · ⁨出典: College Board AP コースおよび試験説明書⁩

English

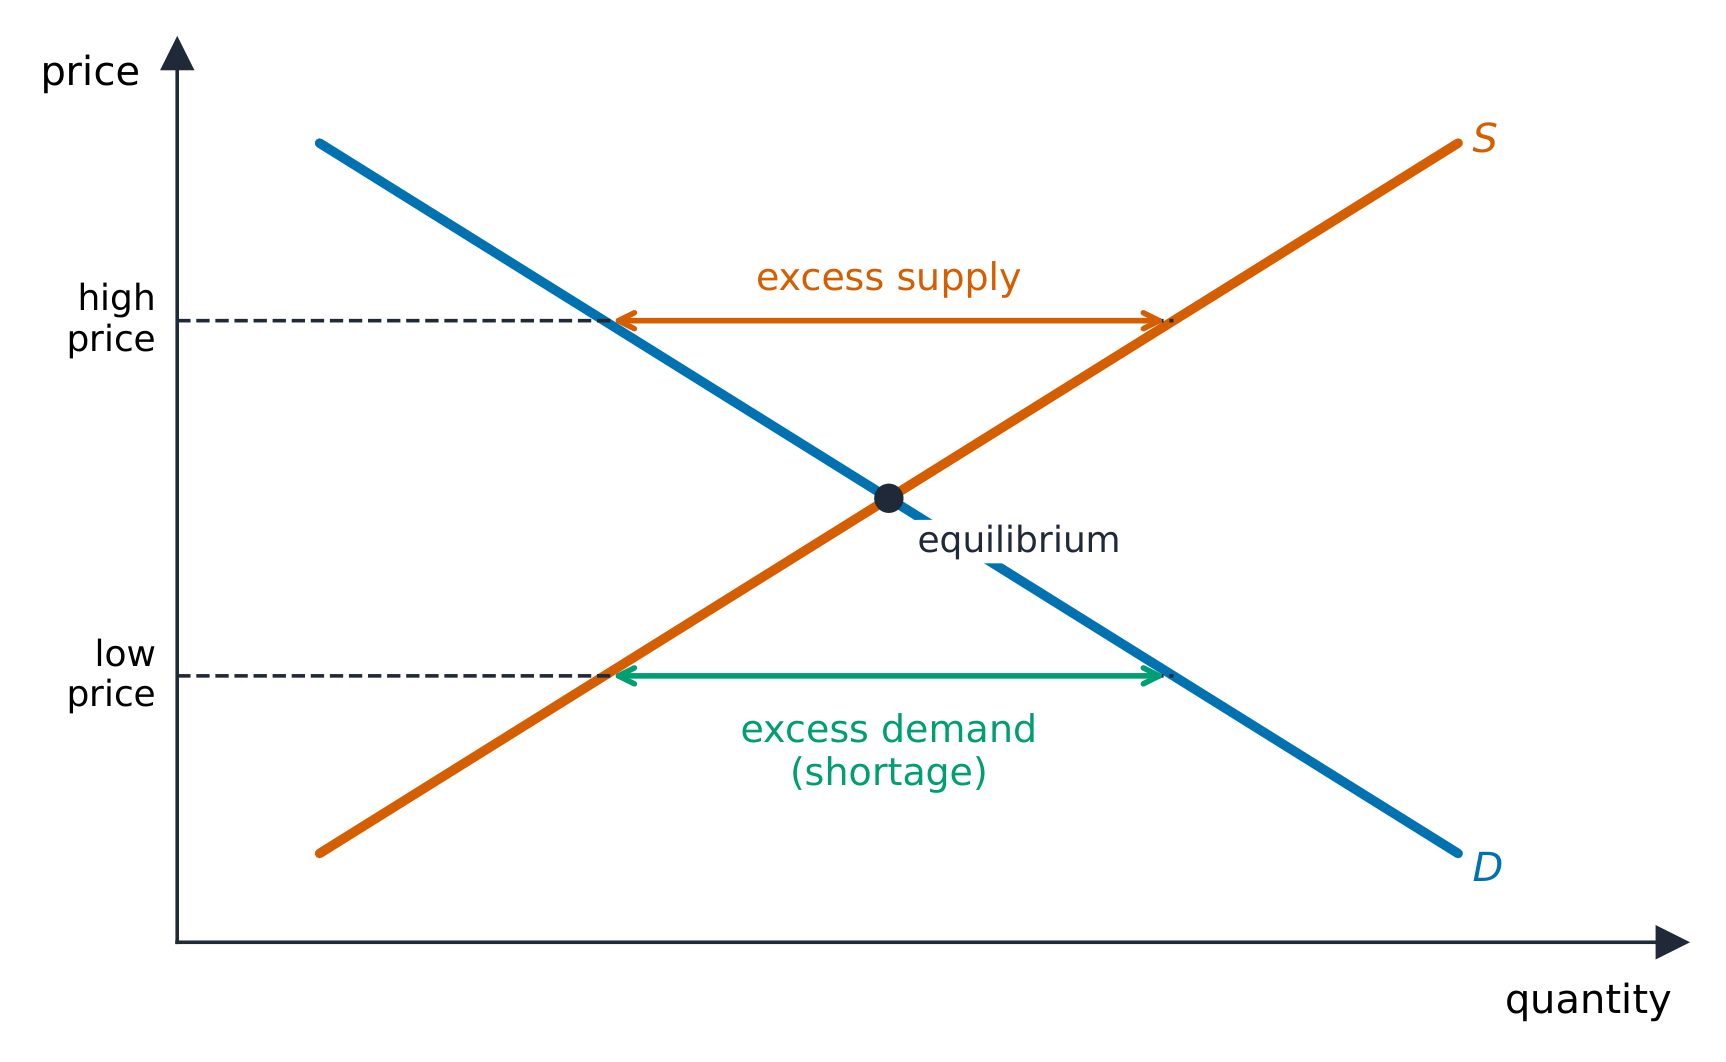
Away from equilibrium the market self-corrects: above the equilibrium price there is a surplus 过剩 (excess supply) that pushes price down; below it a shortage 短缺 (excess demand) that pushes price up.

When a determinant shifts a curve, the equilibrium moves predictably. A single shift gives a definite result for both price and quantity. When both curves shift, one of price or quantity is indeterminate (depends on the relative sizes of the shifts) – a favorite exam trap. Work these out by drawing the shifts.

日本語

均衡から外れた場合、市場は自己修正する:均衡価格より上では 過剰(供給超過) が生じ、価格を下押しする;下では 不足(需要超過) が生じ、価格を上押しする。

均衡より上は供給超過、下は需要超過
均衡より上は供給超過、下は需要超過

決定要因が曲線をシフトさせると、均衡は予測可能に動く。単一のシフトでは価格と数量の両方に明確な結果が出る。両方の曲線がシフトする場合、価格か数量のいずれかが 不明瞭(シフトの相対的な大きさによる)— これはよく出る試験の罠である。これらの問題は図にシフトを描くことで解ける。

Vocabulary · ⁨語彙⁩ Train · ⁨練習する⁩
English 日本語
Equilibrium/ˌiːkwɪˈlɪbrɪəm/ 平衡
Consumer surplus/kənˈsuːmə ˈsɜːpləs/ 消費者余剰
2.8

The Effects of Government Intervention in Markets · ⁨市場への政府介入の効果⁩

Syllabus · ⁨シラバス⁩
English

Enduring Understanding (POL-1): Government policies influence consumer and producer behavior and therefore affect market outcomes.

Learning Objective POL-1.A: a. Define forms of government price and quantity intervention. b. Explain (using graphs where appropriate) how government policies alter consumer and producer behaviors that influence incentives and therefore affect outcomes. c. Calculate (using data from a graph or table where appropriate) changes in market outcomes resulting from government policies.

  • POL-1.A.1 Some government policies, such as price floors, price ceilings, and other forms of price and quantity regulation, affect incentives and outcomes in all market structures.
  • POL-1.A.2 Governments use taxes and subsidies to change incentives in ways that influence consumer and producer behavior, shifting the supply and demand curves accordingly.
  • POL-1.A.3 Taxes and subsidies affect government revenues or costs.
  • POL-1.A.4 Government intervention in a market producing the efficient quantity through taxes, subsidies, price controls, or quantity controls can only decrease allocative efficiency.
  • POL-1.A.5 Deadweight loss represents the losses to buyers and sellers as a result of government intervention in an efficient market.
  • POL-1.A.6 The incidence of taxes and subsidies imposed on goods traded in perfectly competitive markets depends on the elasticity of supply and demand.
日本語

持続的理解(POL-1): 政府政策は消費者および生産者の行動に影響を与え、したがって市場の結果に影響を及ぼす。

学習目標 POL-1.A: a. 政府による価格および数量の介入の形態を定義せよ。 b. 政府政策がインセンティブに影響を与えて結果に変化をもたらすように、消費者および生産者の行動をどのように変更するかを説明せよ(必要に応じて図表を用いること)。 c. 政府政策によって生じる市場結果の変化を計算せよ(必要に応じて図表または数値表のデータを用いること)。

  • POL-1.A.1 最低価格、最高価格、その他の価格および数量の規制などの一部の政府政策は、すべての市場構造におけるインセンティブと結果に影響を与える。
  • POL-1.A.2 政府は、消費者および生産者の行動に影響を与え、それに応じて需給曲線をシフトさせるために、税制および補助金を使用してインセンティブを変化させる。
  • POL-1.A.3 税制および補助金は、政府の収入またはコストに影響を与える。
  • POL-1.A.4 税制、補助金、価格統制、または数量統制を通じて効率的な数量を生出する市場への政府介入は、必ず配分効率を低下させるのみである。
  • POL-1.A.5 死荷重は、効率的な市場における政府介入による、買い手および売手の損失を表す。
  • POL-1.A.6 完全競争市場で取引される財に課された税制および補助金の負担(実質負担)は、需要および供給の価格弾力性に依存する。

Source: College Board AP Course and Exam Description · ⁨出典: College Board AP コースおよび試験説明書⁩

English
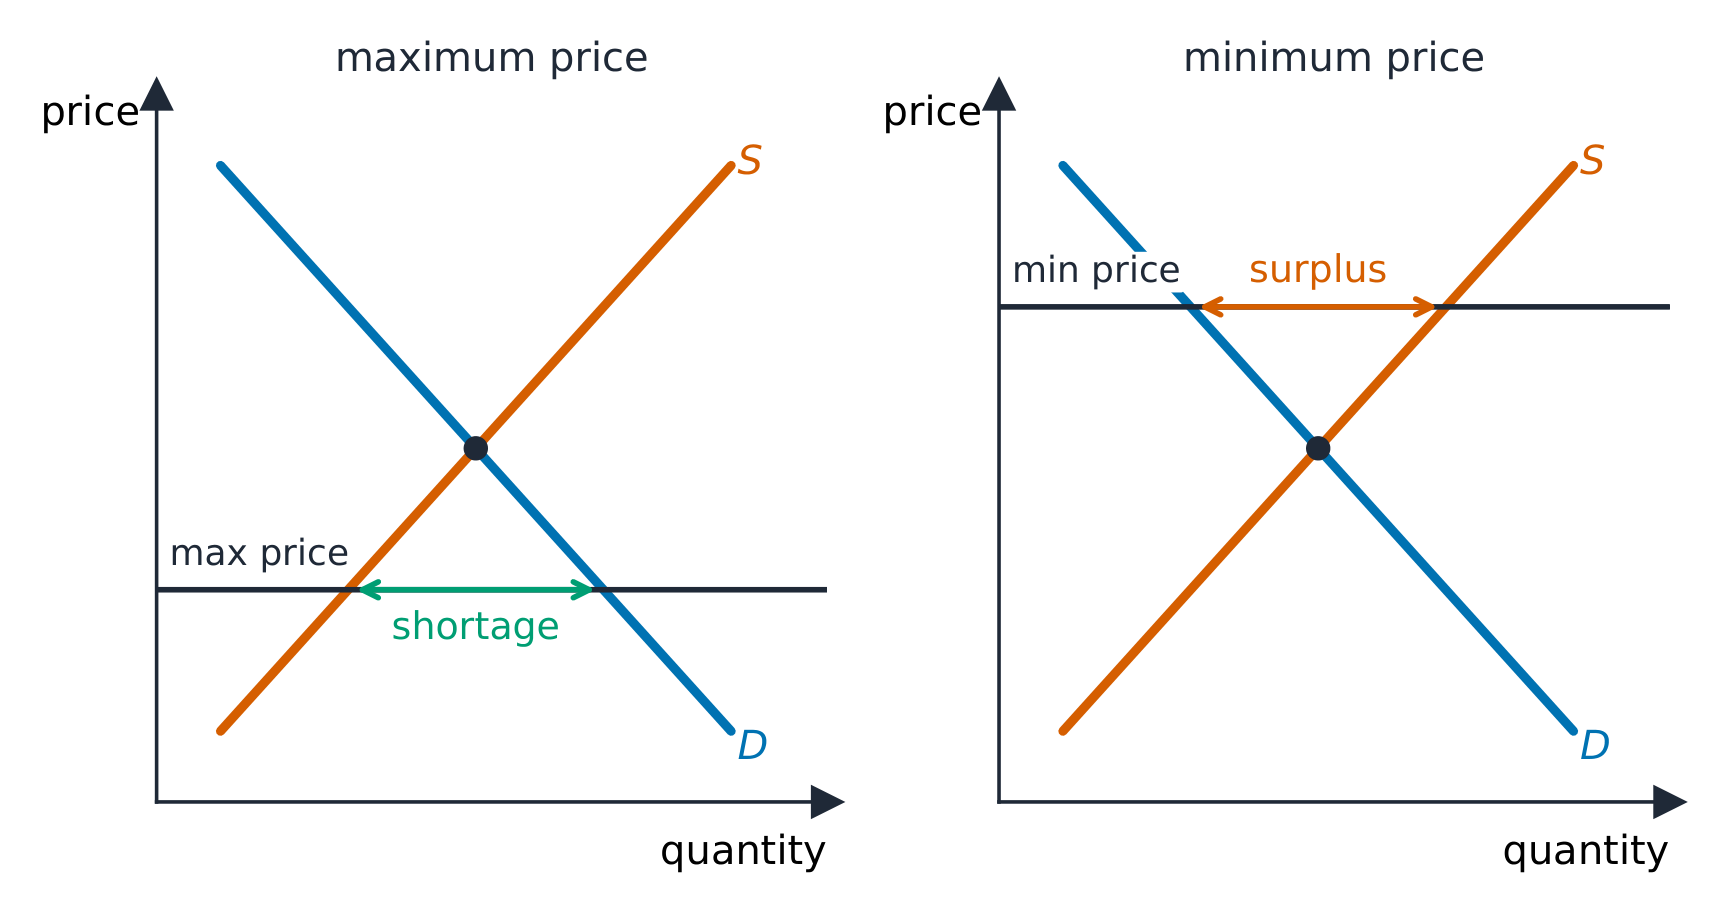
A price ceiling causes a shortage
A tax and the deadweight loss

Governments intervene, usually reducing total surplus:

  • A price ceiling 价格上限 (a legal maximum, like rent control) below equilibrium causes a persistent shortage.
  • A price floor 价格下限 (a legal minimum, like a minimum wage) above equilibrium causes a persistent surplus.
  • An excise tax 消费税 shifts supply up by the tax; the burden (tax incidence 税收归宿) falls more heavily on whichever side is more inelastic.
  • A subsidy shifts supply down, raising quantity.

Each of these creates deadweight loss 无谓损失 – mutually beneficial trades that no longer happen, shown as a triangle between the curves at the new quantity.

Exam skill: on a graph, be able to shade consumer surplus, producer surplus, government revenue from a tax, and deadweight loss, and say who bears the tax and why.

日本語
価格上限が不足を生む
税と無効損失

政府は介入し、通常は総余剰を減少させる:

アニメーション:価格上限が不足を生み、価格下限が過剰を生む
価格上限が不足を生み、価格下限が過剰を生む
  • 価格上限(法律上の最高価格、家賃規制など)が均衡より低い場合、永続的な 不足 が生じる。
  • 価格下限(法律上の最低価格、最低賃金など)が均衡より高い場合、永続的な 過剰 が生じる。
  • 消費税は供給曲線を税額分上方へシフトさせ、負担(税負担の帰着)はより 非弾力的 な側により重くのしかかる。
  • 補助金は供給曲線を下方へシフトさせ、数量を増加させる。

これらすべては 無効損失 を生む — 互いに有益な取引が行われなくなり、新しい数量における曲線間の三角形として示される。

試験技能: グラフ上で消費者余剰、生産者余剰、税からの政府収入、および無効損失に陰影をつけ、誰が税を負担しているか、その理由を説明できること。

Explore · ⁨探索⁩

Add a tax or price control · ⁨税金または価格規制を追加する⁩

A price ceiling below equilibrium causes shortages; a tax drives a wedge between what buyers pay and sellers get, shrinking the quantity traded. · ⁨価格上限が均衡より低いと不足が生じる。税金は買い手が支払う金額と売り手が受け取る金額の間にギャップを生じさせ、取引量を縮小させる。⁩

Vocabulary · ⁨語彙⁩ Train · ⁨練習する⁩
English 日本語
price ceiling/praɪs ˈsiːlɪŋ/ 価格上限設定
price floor/praɪs flɔː/ 価格下限
excise tax/ekˈsaɪz tæks/ 消費税
tax incidence/tæks ˈɪnsɪdəns/ 課税帰属
deadweight loss/ˈdedweɪt lɒs/ 死荷重を生ずる
world price/wɜːld praɪs/ 世界価格
imports/ɪmˈpɔːts/ 輸入
exports/ˈekspɔːts/ 輸出
2.9

International Trade and Public Policy · ⁨国際貿易と公的政策⁩

Syllabus · ⁨シラバス⁩
English

Enduring Understanding (POL-1): Government policies influence consumer and producer behavior and therefore affect market outcomes.

Learning Objective POL-1.B: a. Define tariffs and quotas. b. Explain (using graphs where appropriate) how markets are affected by public policy related to international trade. c. Calculate (using data from a graph or table as appropriate) changes in market outcomes resulting from public policy related to international trade.

  • POL-1.B.1 Equilibria in competitive markets may be altered by the decision to open an economy to trade with other countries; equilibrium price can be higher or lower than under autarky, and the gap between domestic supply and demand is filled by trade. Opening an economy to trade with other countries affects consumer surplus, producer surplus, and total economic surplus.
  • POL-1.B.2 Tariffs, which governments sometimes use to influence international trade, affect domestic price, quantity, government revenue, and consumer surplus and total economic surplus.
  • POL-1.B.3 Quotas can be used to alter quantities produced and therefore affect price, consumer surplus, and total economic surplus.
    • Exclusion statement: The graphing of quotas is beyond the scope of the course and the AP Exam, but understanding how quotas affect quantities produced is within the scope.
日本語

持続的理解(POL-1): 政府政策は消費者および生産者の行動に影響を与え、したがって市場の結果に影響を及ぼす。

学習目標 POL-1.B: a. 関税および輸出入制限を定義せよ。 b. 国際貿易に関する公共政策が市場にどのように影響するかを説明せよ(必要に応じて図表を用いること)。 c. 国際貿易に関する公共政策によって生じる市場結果の変化を計算せよ(必要に応じて図表または数値表のデータを用いること)。

  • POL-1.B.1 完全競争市場の均衡は、他の国との貿易のために経済を開くという意思決定によって変動する可能性がある;均衡価格は自閉下よりも高くなる也可能低くなる可能性があり、国内の供給と需要のギャップは貿易によって埋められる。他の国との貿易のために経済を開くことは、消費者余剰、生産者余剰、および総経済余剰に影響を与える。
  • POL-1.B.2 政府がsometimes国际贸易に影響を与えるために使用する関税は、国内の価格、数量、政府の収入、消費者余剰、および総経済余剰に影響を与える。
  • POL-1.B.3 輸出入制限は生産数量を変更するために使用でき、したがって価格、消費者余剰、および総経済余剰に影響を与える。
    • 除外声明: 輸出入制限の図示は課程およびAP試験の範囲外であるが、輸出入制限が生産数量に与える影響を理解することは範囲内である。

Source: College Board AP Course and Exam Description · ⁨出典: College Board AP コースおよび試験説明書⁩

English

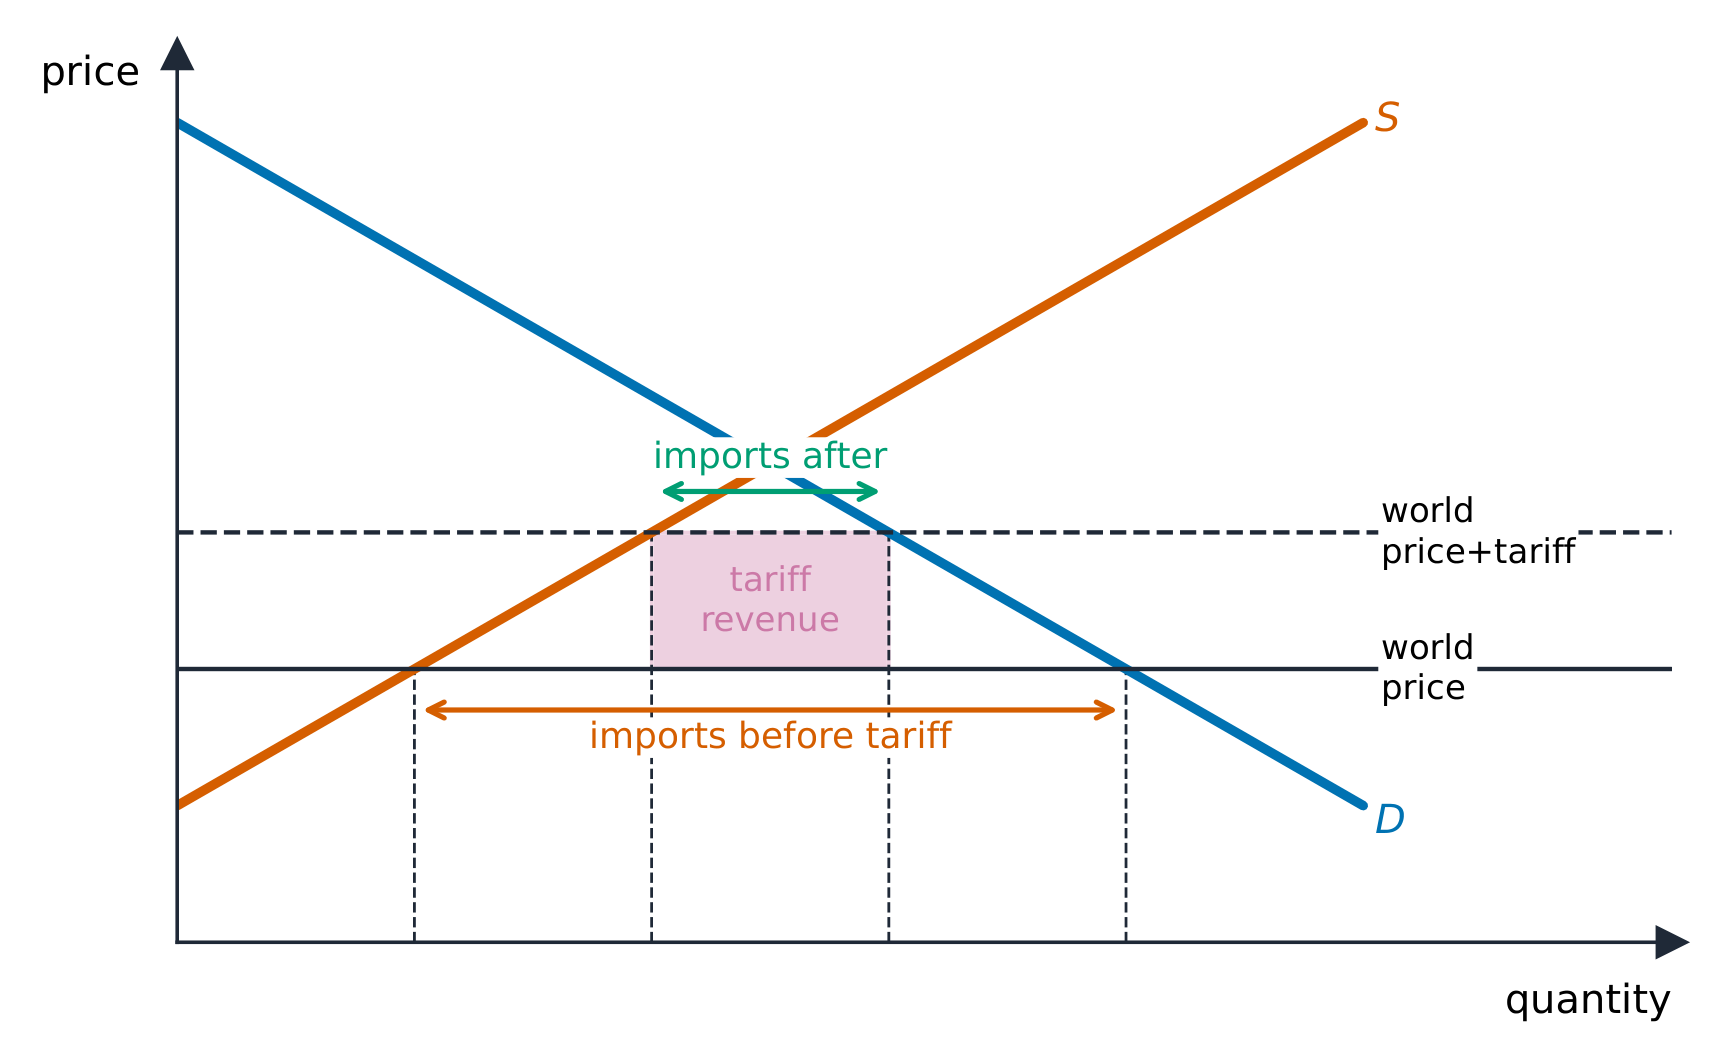
When a country opens to trade at a world price 世界价格:

  • If the world price is below the domestic price, the country imports 进口 – consumers gain more than producers lose, so total surplus rises.
  • If the world price is above the domestic price, the country exports 出口 – producers gain more than consumers lose.

A tariff 关税 (a tax on imports) or a quota 配额 (a limit on imports) raises the domestic price, helps domestic producers, hurts consumers more, and creates deadweight loss. Free trade maximizes total surplus, which is the core efficiency argument for it.

日本語

一国が 世界価格 で貿易を開放した場合:

関税は国内供給を増やし、需要を減らし、輸入を縮小させる
  • 世界価格が国内価格より 低い 場合、国は 輸入 する — 消費者の受益が生産者の損失を上回り、総余剰が増加する。
  • 世界価格が国内価格より 高い 場合、国は 輸出 する — 生産者の受益が消費者の損失を上回る。

関税(輸入に対する税)や 輸入割当(輸入制限)は国内価格を引き上げ、国内生産者を助け、消費者に更大的な被害を与え、無効損失を生む。自由貿易は総余剰を最大化するため、これがその核心的な効率性の根拠である。

Vocabulary · ⁨語彙⁩ Train · ⁨練習する⁩
English 日本語
tariff/ˈtærɪf/ 関税
quota/ˈkwəʊtə/ 勘定科目
2.9

Exam tips · ⁨試験対策⁩

English
  • Separate a movement along a curve (own price) from a shift (a determinant); a single shift gives a definite result, a double shift leaves one variable indeterminate.
  • Compute elasticity $E_d=|\%\Delta Q \div \%\Delta P|$; elastic ($>1$) means a price cut raises total revenue, inelastic ($<1$) lowers it.
  • Read the sign of cross-price elasticity (substitutes $+$, complements $-$) and income elasticity (normal $+$, inferior $-$).
  • Shade consumer/producer surplus and the deadweight loss from a tax or price control; incidence falls on the more inelastic side.
  • A price ceiling below equilibrium causes a shortage; a price floor above causes a surplus.
日本語
  • 曲線上の 移動(自身の価格)と シフト(決定要因)を区別すること;単一のシフトは明確な結果をもたらすが、二つのシフトでは変数の一つが不明瞭となる。
  • 弾力性を $E_d=|\%\Delta Q \div \%\Delta P|$ 計算する;弾力的($>1$)であれば価格引き下げは総収益を増やし、非弾力的($<1$)であれば減少させる。
  • 代替財・補完財の交叉価格弾性(代替財 $+$、補完財 $-$)および所得弾性(正常財 $+$、劣等財 $-$)の符号を読む。
  • 税や価格管理による 消費者/生産者余剰 と 無効損失 に陰影をつけ、帰着はより 非弾力的 な側に落ちることを理解する。
  • 均衡より下の価格上限は不足を生み、均衡より上の価格下限は過剰を生む。

Interactive lessons on this topic · ⁨このトピックのインタラクティブ授業⁩

Work through it step by step, with instant-check exercises. · ⁨一歩ずつ進め、即時チェック付きの問題で学習します。⁩

Past Papers · ⁨過去問⁩

More topics in AP Microeconomics · ⁨AP 経済学⁩ · ⁨AP Microeconomics · ⁨AP 経済学⁩ の他のトピック⁩

Log in or create account · ⁨ログインまたはアカウント作成⁩

IGCSE, A-Level & AP