Spread and grouped data · Dispersão e dados agrupados
| English | Português |
|---|---|
| grouped data/ɡruːpt ˈdeɪtə/ | dados agrupados |
| modal class/ˈməʊdl klæs/ | classe modal |
| quartiles/ˈkwɔːtaɪlz/ | quartis |
When data comes in groups
- A survey records the heights of 200 students. Instead of listing all 200 values, the data is grouped: $140$–$150$ cm ($15$ students), $150$–$160$ cm ($45$ students), and so on.
- Grouped data 分组数据 loses the individual values — so you can only estimate the mean.
Quando os dados vêm em grupos
- Uma pesquisa registra as alturas de 200 alunos. Em vez de listar todos os 200 valores, os dados são agrupados: $140$–$150$ cm ($15$ alunos), $150$–$160$ cm ($45$ alunos), e assim por diante.
- Dados agrupados perdem os valores individuais — portanto você só pode estimar a média.
Spread measure lab · Laboratório de medida de dispersão
Classify data summaries by what they tell you about spread. · Classificar resumos de dados pelo que eles dizem sobre a dispersão.
Estimating the grouped mean
- Use the midpoint of each class as the representative value:
The class $10$ to $20$ has midpoint $\dfrac{10 + 20}{2} = 15$.
- The modal class 众数组 is the group with the highest frequency.
A bar chart shows the frequency of each group
Estimando a média agrupada
- Use a ponto médio de cada classe como valor representativo:
A classe $10$ até $20$ tem ponto médio $\dfrac{10 + 20}{2} = 15$.
- A classe modal é o grupo com a maior frequência.
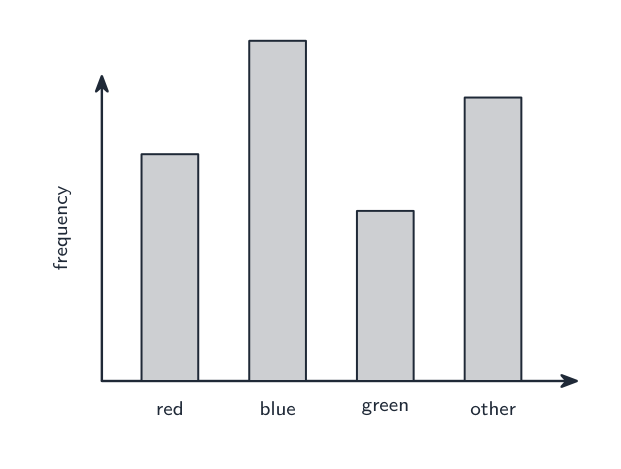
Um gráfico de barras mostra a frequência de cada grupo
A grouped class runs from 10 to 20. What midpoint do you use as its value? · Uma classe agrupada vai de 10 a 20. Que ponto médio você usa como seu valor?
(10 + 20)/2 = 15.
The modal class in grouped data is: · A classe modal em dados agrupados é:
The modal class is simply the group with the most data points. · A classe modal é simplesmente o grupo com mais pontos de dados.
A class runs from 30 to 50. What midpoint do you use? · Uma classe vai de 30 a 50. Que ponto médio você usa?
(30 + 50)/2 = 40.
Quartiles 四分位数 and the IQR
- Put the data in order. The quartiles cut it into four equal parts:
- Lower quartile (LQ) at the $\dfrac{1}{4}$ position.
- Upper quartile (UQ) at the $\dfrac{3}{4}$ position.
IQR, not range. The IQR measures the spread of the middle half of the data, ignoring the extremes. It's more reliable than the range when outliers are present.
Quartis e o IQR
- Coloque os dados em ordem. Os quartis dividem-no em quatro partes iguais:
- Quartil inferior (QI) na posição $\dfrac{1}{4}$.
- Quartil superior (QS) na posição $\dfrac{3}{4}$.
QRI, não amplitude. O QRI mede a dispersão da metade central dos dados, ignorando os extremos. É mais confiável que a amplitude quando há outliers.
Box-and-whisker plot · Diagrama de caixa e bigodes
Build a box plot from the five-number summary: the box is the middle 50% (the interquartile range) and the median's position shows the skew. · Construir um diagrama de caixa a partir do resumo de cinco números: a caixa representa o meio de 50% (a amplitude interquartil) e a posição da mediana mostra a assimetria.
A data set has upper quartile 15 and lower quartile 7. Find the interquartile range. · Um conjunto de dados tem quartil superior 15 e quartil inferior 7. Encontrar a amplitude interquartil.
IQR = UQ − LQ = 15 − 7 = 8. · AIQ = QS − QI = 15 − 7 = 8.
The interquartile range ignores extreme values, unlike the range. · A amplitude interquartil ignora valores extremos, diferentemente da amplitude.
The IQR uses only the middle half, so outliers do not affect it. · A AIQ usa apenas a metade central, então outliers não a afetam.
The IQR measures the spread of the middle ______ of the data. · A AIQ mede a dispersão do meio ______ dos dados.
The IQR is the range of the middle 50% of values (between LQ and UQ). · A AIQ é a amplitude do meio de 50% de valores (entre QI e QS).
Worked example
- UQ $= 15$, LQ $= 7$: $\text{IQR} = 15 - 7 = 8$.
- This means the middle $50\%$ of the data spans a range of $8$ units.
Exemplo resolvido
- QS $= 15$, QI $= 7$: $\text{IQR} = 15 - 7 = 8$.
- Isso significa que a metade central $50\%$ dos dados abrange uma faixa de $8$ unidades.
Compare spread fairly
- Compare IQRs when you want the spread of the middle half; a smaller IQR means that middle group is more consistent.
- Compare medians as well: equal IQRs do not mean equal typical values.
Compare a dispersão de forma justa
- Compare os IQRs quando quiser a dispersão do meio; um IQR menor indica que esse grupo central é mais consistente.
- Compare também as medianas: IQRs iguais não significam valores típicos iguais.
Calculate a grouped estimate
- Classes $0\le x<10,10\le x<20,20\le x<40$ have frequencies 4,6,5. Midpoints are 5,15,30; weighted total is $T=4(5)+6(15)+5(30)=260$.
- Estimated mean $\bar x\approx260/15=17.3$ to one decimal place. The modal class is $10\le x<20$, with highest frequency 6. The mean is an estimate because the individual values are unknown.
Calcule uma estimativa agrupada
- As classes $0\le x<10,10\le x<20,20\le x<40$ têm frequências 4,6,5. Os pontos médios são 5,15,30; o total ponderado é $T=4(5)+6(15)+5(30)=260$.
- Média estimada $\bar x\approx260/15=17.3$ arredondada para uma casa decimal. A classe modal é $10\le x<20$, com a maior frequência 6. A média é uma estimativa porque os valores individuais são desconhecidos.
Class midpoints 5,15,30 have frequencies 4,6,5. Find the estimated mean to 1 dp. · Pontos médios das classes 5,15,30 têm frequências 4,6,5. Encontre a média estimada com 1 casas decimais.
Weighted total = 260 and frequency total = 15, so mean ≈ 17.3. · Total ponderado = 260 e total de frequência = 15, logo média ≈ 17.3.
Quartiles for individual data
- For ordered values $2,4,5,7,8,10,12,14$, median is $(7+8)/2=7.5$. Medians of the lower and upper halves give $Q_1=(4+5)/2=4.5$ and $Q_3=(10+12)/2=11$.
- $\text{IQR}=Q_3-Q_1=11-4.5=6.5$. State the convention used when working from a list; graph questions use the quarter and three-quarter cumulative positions.
Quartis para dados individuais
- Para valores ordenados $2,4,5,7,8,10,12,14$, a mediana é $(7+8)/2=7.5$. As medianas das metades inferior e superior fornecem $Q_1=(4+5)/2=4.5$ e $Q_3=(10+12)/2=11$.
- $\text{IQR}=Q_3-Q_1=11-4.5=6.5$. Declare a convenção usada ao trabalhar com uma lista; questões gráficas usam as posições cumulativas de quarto e três quartos.
Quartiles are 4.5 and 11. Find the IQR. · Os quartis são 4.5 e 11. Encontre o QI.
IQR = 11 − 4.5 = 6.5. · QI = 11 − 4.5 = 6.5.
You've got it
- estimate a grouped mean using each class midpoint; modal class $=$ highest frequency
- IQR $=$ UQ $-$ LQ (spread of the middle half)
- the IQR ignores extreme values, unlike the range
Entendeu?
- estimar uma média agrupada usando o ponto médio de cada classe; classe modal $=$ maior frequência
- QRI $=$ QS $-$ QI (dispersão da metade central)
- o QRI ignora valores extremos, diferentemente da amplitude