Correlation and elasticity · 相关性与弹性
| English | 中文 | Pinyin · 拼音 |
|---|---|---|
| correlation/ˌkɒrɪˈleɪʃn/ | 相关性 | xiāng guān xìng |
| scatter graph/ˈskætə ɡræf/ | 散点图 | sàn diǎn tú |
| positive/ˈpɒzɪtɪv/ | 正相关 | zhèng xiāng guān |
| negative/ˈneɡətɪv/ | 负相关 | fù xiāng guān |
| causation/kɔːˈseɪʃn/ | 因果关系 | yīn guǒ guān xì |
| income elasticity/ˈɪŋkʌm ɪlæˈstɪsɪti/ | 收入弹性 | shōu rù tán xìng |
| promotional/prəˈməʊʃənl/ | 促销 | cù xiāo |
Does spending more actually sell more?
- A firm doubles its advertising — do sales follow? To answer, it looks for a relationship between the two.
- Correlation 相关性 measures how strongly two variables move together.
花更多真的卖更多吗?
- 一个企业把它的广告翻倍——销售跟上了吗?要回答,它寻找两者之间的一个关系。
- 相关性(correlation)测量两个变量多么强烈地一起移动。
If sales rise as advertising rises, the two show: · 如果销售随广告上升而上升,两者显示:
Both moving up together is positive correlation. · 两者一起上升是正相关。
A graph that plots paired data points to show a relationship is a ______ graph. · 一张把成对数据点作图以显示一个关系的图是一张______图。
A line of best fit summarises the correlation. · 一条最佳拟合线总结相关性。
Scatter graphs 散点图 and correlation
- A scatter graph plots paired data (e.g. advertising vs sales).
- Positive 正相关 correlation: both rise together. Negative 负相关: one rises as the other falls. None: no pattern.
A line of best fit summarises the relationship — here, positive correlation.
散点图与相关性
- 一张散点图(scatter graph)把成对的数据作图(例如广告对销售)。
- 正(positive)相关:两者一起上升。负(negative):一个上升而另一个下降。无:没有模式。
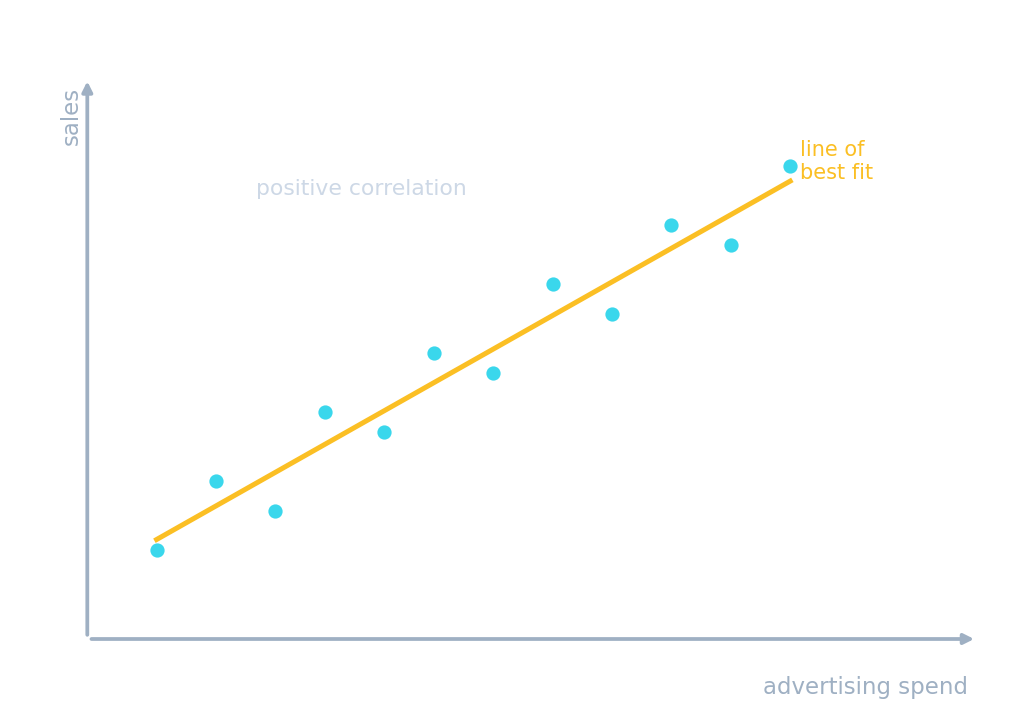
一条最佳拟合线总结这个关系——这里,正相关。
Correlation · 相关性
r measures the link · r 测量这个联系
Correlation r shows how closely two variables move together — but it isn't causation. · 相关性 r 显示两个变量多么紧密地一起移动——但它不是因果关系。
A strong correlation between two variables: · 两个变量之间的一个强相关:
Correlation is not causation — a third factor may explain it. · 相关性不是因果关系——一个第三因素可能解释它。
Two variables can be strongly correlated because of a third, hidden factor. · 两个变量能因为一个第三的、隐藏的因素而强烈相关。
A lurking variable can drive both. · 一个潜伏的变量能驱动两者。
Correlation is not causation 因果关系
- A strong correlation does not prove one thing causes the other.
- A third factor, or coincidence, may explain it — always think about why.
Positive and negative correlation between two variables
相关性不是因果关系
- 一个强相关不证明一个东西导致另一个。
- 一个第三因素,或巧合,可能解释它——总是想想为什么。
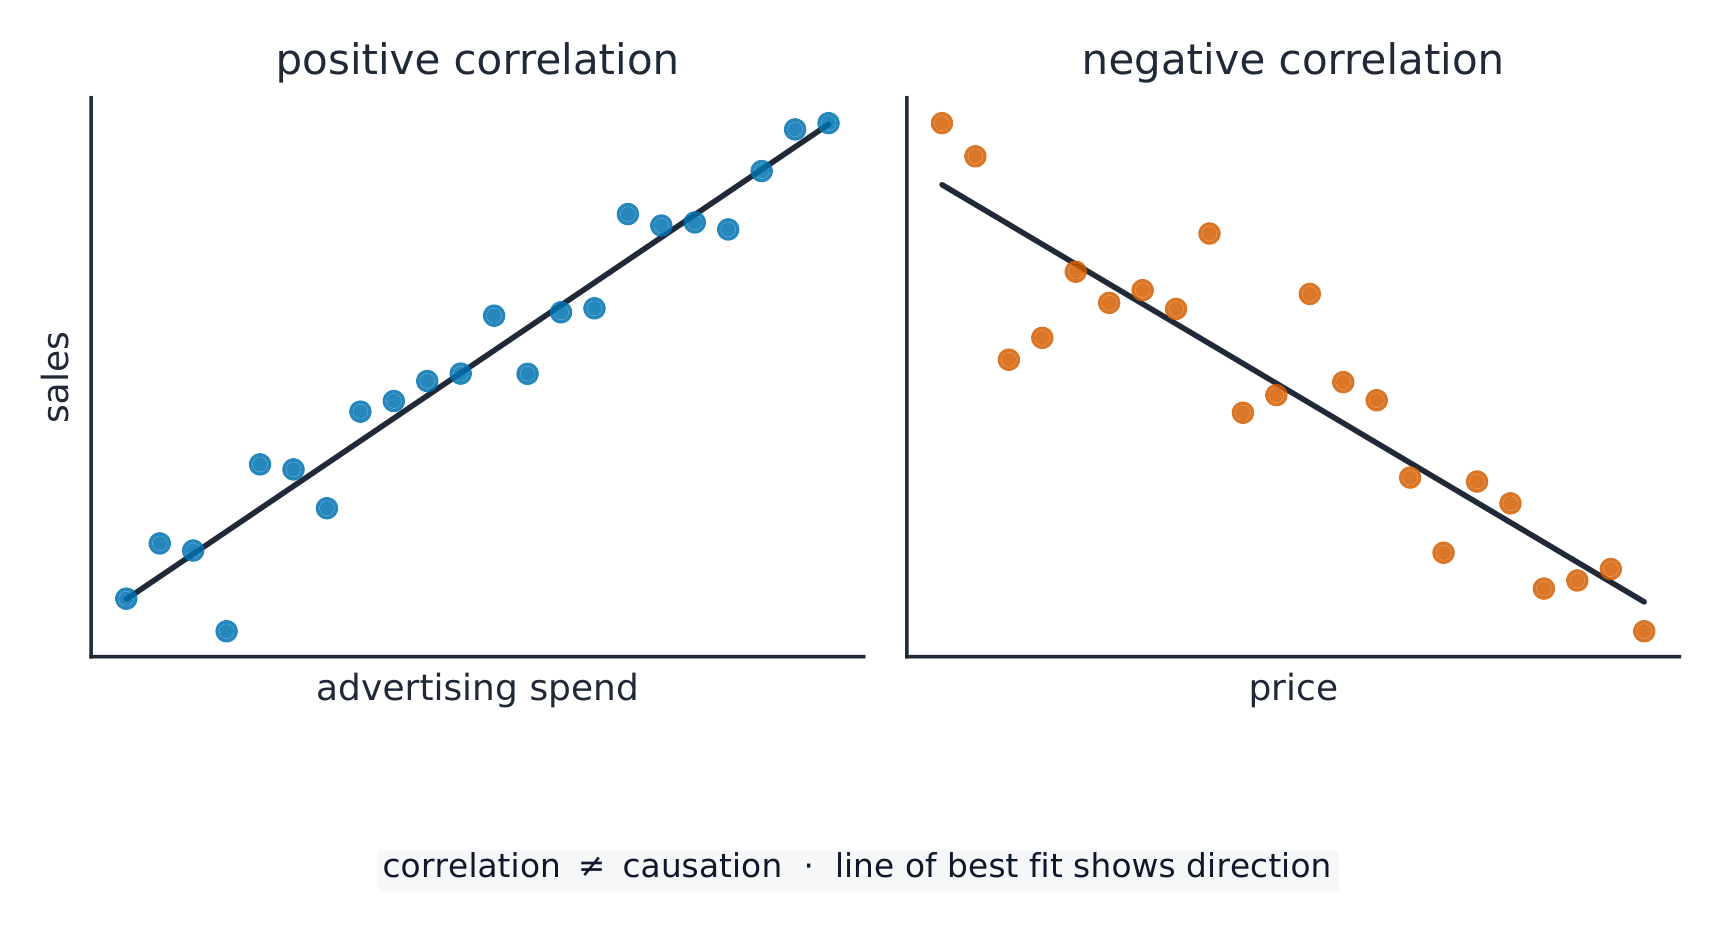
两个变量之间的正相关和负相关
Income elasticity of demand measures how demand responds to a change in: · 需求的收入弹性测量需求如何对以下的一个变化反应:
Income elasticity relates demand to income. · 收入弹性把需求与收入联系。
Other elasticities
- Income elasticity 收入弹性: how demand responds to a change in income.
- Promotional 促销 (advertising) elasticity: how demand responds to a change in promotion spend.
Correlation ≠ causation. Ice-cream sales and drownings both rise in summer, but ice cream doesn't cause drowning — hot weather drives both. Never assume a relationship is causal without good reason.
Elastic demand is flat; inelastic demand is steep
其他弹性
- 收入弹性(income elasticity):需求如何对收入的一个变化反应。
- 促销(广告)弹性(promotional / advertising elasticity):需求如何对促销支出的一个变化反应。
相关性 ≠ 因果关系。 冰淇淋销售和溺水都在夏天上升,但冰淇淋不导致溺水——炎热的天气驱动两者。没有好的理由,永远不要假设一个关系是因果的。
You've got it
- a scatter graph shows positive, negative or no correlation
- correlation does not prove causation — a third factor may be at work
- income and promotional elasticity measure demand's response to income and advertising
你掌握了
- 一张散点图显示正、负或无相关
- 相关性不证明因果关系——一个第三因素可能在起作用
- 收入和促销弹性测量需求对收入和广告的反应