Collecting and showing data · Coleta e apresentação de dados
| English | Português |
|---|---|
| tally table/ˈtælɪ ˈteɪbl/ | tabela de contagem |
| two-way table/tuː weɪ ˈteɪbl/ | tabela de contingência |
| correlation/ˌkɒrɪˈleɪʃn/ | correlação |
| causation/kɔːˈseɪʃn/ | causalidade |
| qualitative/ˈkwɒlɪteɪtɪv/ | qualitativa |
| quantitative/ˈkwɒntɪteɪtɪv/ | quantitativa |
| discrete/dɪˈskriːt/ | discretos |
| continuous/kənˈtɪnjuːəs/ | contínua |
"Statistics" — the word that means both data and lies
- "There are three kinds of lies: lies, damned lies, and statistics." — often attributed to Mark Twain.
- Good statistics tells the truth about data. Bad statistics misleads. The skill is telling them apart.
"Estatística" — a palavra que significa tanto dados quanto mentiras
- "Existem três tipos de mentiras: mentiras, mentiras condenadas e estatísticas." — frequentemente atribuído a Mark Twain.
- Boas estatísticas dizem a verdade sobre os dados. Más estatísticas enganam. A habilidade é distinguí-las.
Data handling cycle · Ciclo de tratamento de dados
Follow a statistical question from collection to display.
Tally tables 计数表 and two-way tables 双向表
- A tally table records each value with a mark ($\mid$), grouping them in fives for easy counting.
- A two-way table sorts data by two features at once (e.g. boys/girls against walk/bus/car).
A two-way table of 60 students by gender and transport might show: 15 boys walk, 10 boys take the bus; 12 girls walk, 23 girls take the bus. Each cell is a count.
Data is collected from people, a sample drawn from a population
Tabelas de contagem e tabelas de contingência
- Uma tabela de marcação registra cada valor com uma marca ($\mid$), agrupando-os em cinco para facilitar a contagem.
- Uma tabela bidirecional organiza dados por duas características ao mesmo tempo (ex: meninos/meninas contra caminhada/ônibus/carro).
Uma tabela bidirecional de 60 alunos por gênero e transporte pode mostrar: 15 meninos caminham, 10 meninos pegam o ônibus; 12 meninas caminham, 23 meninas pegam o ônibus. Cada célula é uma contagem.

Os dados são coletados de pessoas, uma amostra retirada de uma população
A two-way table sorts data by how many features at once?
A two-way table cross-tabulates two features (e.g. gender vs transport).
A table where you make a mark for each value, then count, is a ______ table.
A tally table records each value with a mark before counting.
Reading data honestly
- Only draw conclusions the data actually supports.
- Don't assume a trend that isn't shown, or causes that aren't proven.
- Correlation 相关性 is not causation 因果: two things can rise together without one causing the other.
Check the axes. A graph with a truncated $y$-axis can make small differences look huge. Always check the scale before drawing conclusions.
A Galton board shows how data piles up into a distribution
Lendo dados honestamente
- Tire conclusões que os dados realmente suportem.
- Não assuma tendências que não apareçam, ou causas que não estejam provadas.
- Correlação não implica causalidade: duas coisas podem aumentar juntas sem uma causar a outra.
Verifique os eixos. Um gráfico com um eixo $y$ truncado pode fazer pequenas diferenças parecerem enormes. Verifique sempre a escala antes de tirar conclusões.

Uma placa de Galton mostra como os dados se acumulam em uma distribuição
You should only draw conclusions that the data really supports.
Over-claiming beyond the data is a common exam error to avoid.
If two quantities both increase together, one must cause the other.
Correlation does not prove causation. Both could be influenced by a third factor.
Types of data
- Qualitative 定性 (categorical): colours, opinions, brands.
- Quantitative 定量 (numerical): height, age, score.
- Quantitative data is discrete 离散的 (counted: number of siblings) or continuous 连续的 (measured: height, time).
Tipos de dados
- Qualitativo (categórico): cores, opiniões, marcas.
- Quantitativo (numérico): altura, idade, nota.
- Dados quantitativos são discretos (contados: número de irmãos) ou contínuos (medidos: altura, tempo).
The number of siblings a student has is what type of data?
Number of siblings is counted (not measured), so it is discrete quantitative.
Height is an example of ______ quantitative data.
Height is measured (not counted), so it is continuous.
Why data matters
- Governments use census data to plan schools and hospitals. Companies use sales data to decide what to stock. Medical researchers use trial data to approve new drugs.
Two-way tables split data into parts, just like a bar model splits a total into proportional sections.
Por que os dados importam
- Governos usam dados censitários para planejar escolas e hospitais. Empresas usam dados de vendas para decidir o estoque. Pesquisadores médicos usam dados de ensaios para aprovar novos medicamentos.
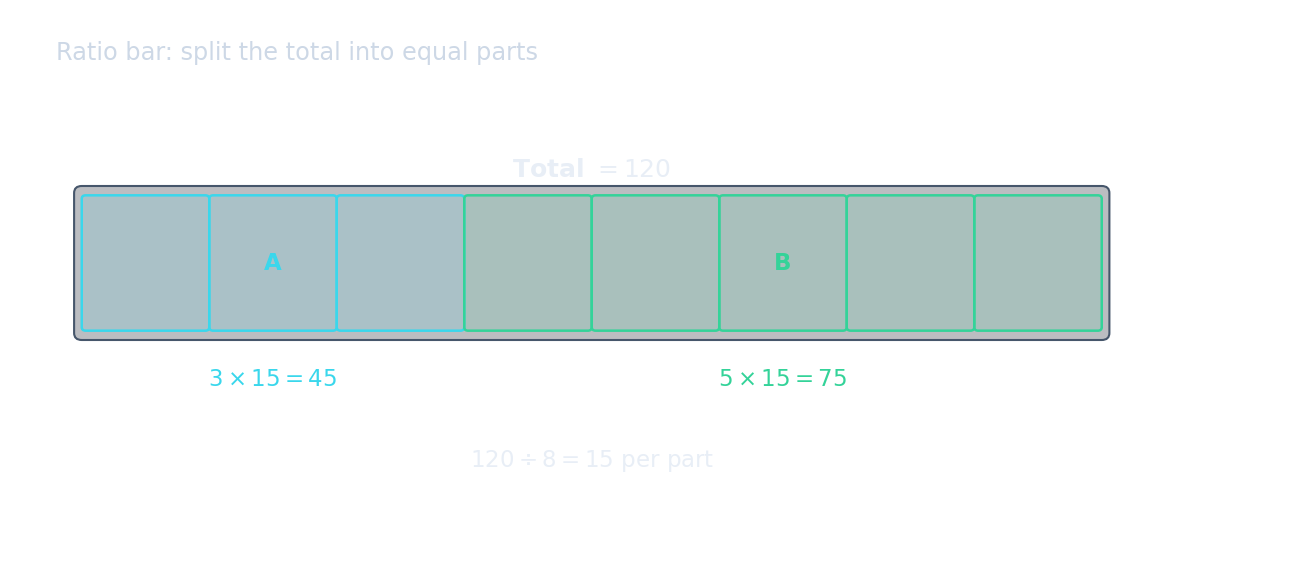
Tabelas bidirecionais dividem os dados em partes, assim como um modelo de barra divide um total em seções proporcionais.
Complete and interpret a two-way table
- In a survey, junior bus 6, junior walk 4, senior bus 3 and senior walk 7 give row totals 10,10; column totals 9,11; grand total 20. Check totals in both directions.
- To compare two samples, use both an average and a spread. Scores A: $4,6,8$ and B: $5,6,7$ have equal means 6 but ranges 4 and 2. B is more consistent in this sample; three scores per group cannot establish a general population claim.
Completar e interpretar uma tabela de contingência
- Em uma pesquisa, busão júnior 6, caminhada júnior 4, busão sênior 3 e caminhada sênior 7 resultam em totais por linha 10,10; totais por coluna 9,11; total geral 20. Verifique os totais em ambas as direções.
- Para comparar duas amostras, use tanto uma medida de tendência central quanto uma de dispersão. Notas A: $4,6,8$ e B: $5,6,7$ têm médias iguais 6, mas amplitudes 4 e 2. B é mais consistente nesta amostra; três notas por grupo não podem sustentar uma afirmação sobre a população geral.
A survey has junior bus 6, junior walk 4, senior bus 3, senior walk 7. Find the total who walk.
Add the walk column: 4 + 7 = 11.
You've got it
- a tally table counts values with marks; a two-way table sorts by two features at once
- only conclude what the data actually shows — correlation $\neq$ causation
- data types: qualitative (categories) or quantitative (numbers: discrete or continuous)
Entendeu?
- uma tabela de marcação conta valores com marcas; uma tabela bidirecional organiza por duas características ao mesmo tempo
- conclua apenas o que os dados realmente mostram — correlação $\neq$ causalidade
- tipos de dados: qualitativo (categorias) ou quantitativo (números: discretos ou contínuos)