Representing a Categorical Variable with Graphs
Introduced| English | Meaning |
|---|---|
| bar chart/bɑː tʃɑːt/ | A graph using separate bars whose lengths represent the frequencies or amounts of categories. |
| pie chart/paɪ tʃɑːt/ | A circular chart whose sectors represent proportions of a total. |
| association/əˌsəʊsɪˈeɪʃn/ | A relationship between two variables. |
Picturing categories
- A table of counts is fine, but a picture makes patterns jump out.
- For a categorical variable, the two workhorses are the bar chart 条形图 and the pie chart 饼图.
- Both show how individuals split across categories — bar charts by height, pie charts by slice.
- Choosing and reading them correctly is a core skill.
Bar charts
- A bar chart draws one bar per category, its height the frequency or relative frequency.
- Bars are separated (categories are distinct groups, not a continuous scale).
- The tallest bar is the most common category; comparing heights compares groups.
- Bars can be ordered any way — often tallest-to-shortest for clarity.
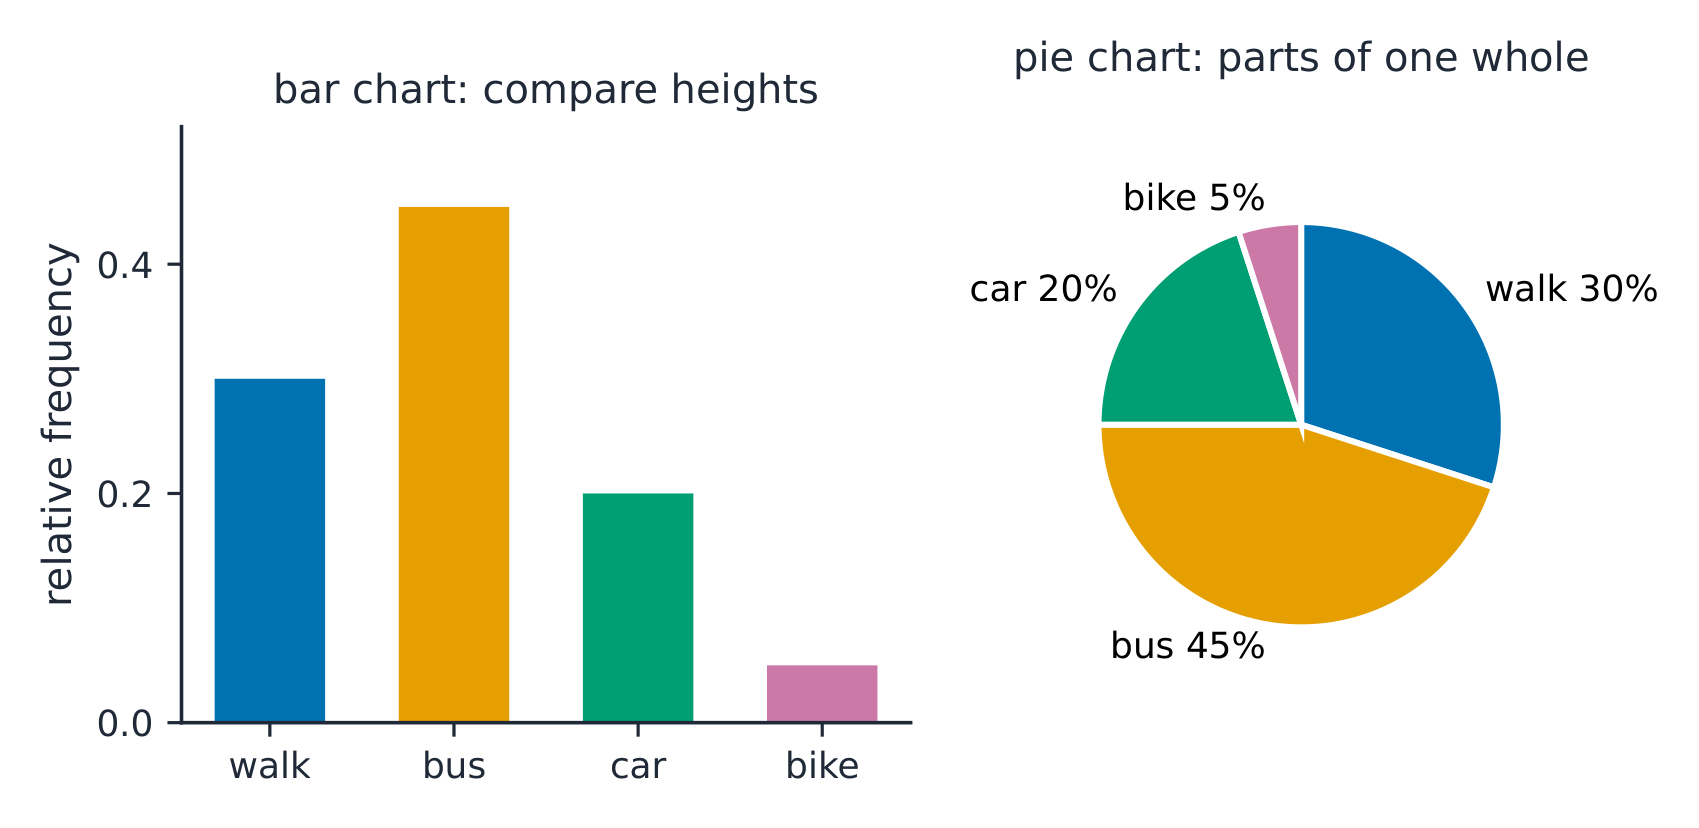
The same data as a bar chart and as a pie chart
In a bar chart, the height of each bar represents...
Difficulty 1/5 · 100 coins + a small bonus on first completion today
Bar height = count (or proportion) in that category.
Bar chart bars are separated, unlike a histogram's touching bars.
Difficulty 1/5 · 100 coins + a small bonus on first completion today
Categorical bars are separated; quantitative histogram bars touch.
In a bar chart, the most common category is the one with the...
Difficulty 1/5 · 100 coins + a small bonus on first completion today
Tallest bar = highest frequency.
Pie charts
- A pie chart shows each category as a slice of the whole circle.
- Slice size = that category's share (relative frequency) of the total.
- It's best when you care about parts of a whole and there are only a few categories.
- All slices add to $100\%$ — a pie always represents one complete group.
Categories as slices
A pie chart shows each category as a share of the whole — all slices sum to 100%.
All the slices of a pie chart add up to ____ percent.
Difficulty 1/5 · 100 coins + a small bonus on first completion today
A pie represents one complete whole.
Comparing two categorical variables
- To compare a categorical variable across groups, use a side-by-side or segmented (stacked) bar chart.
- Side-by-side puts groups' bars next to each other; segmented stacks the categories within one bar per group.
- Look for an association 关联: do the category proportions differ between groups?
- If the proportions look the same across groups, there's little association.
To judge an association between two categorical variables, compare...
Difficulty 1/5 · 100 coins + a small bonus on first completion today
Different group sizes make counts misleading; compare proportions.
Which charts display two categorical variables together?
Difficulty 2/5 · 140 coins + a small bonus on first completion today
Side-by-side and segmented bars show two categorical variables.
Bar charts are for categorical data — their bars are separated, unlike a histogram's touching bars for quantitative data. Don't confuse the two. And to judge association between two categorical variables, compare proportions (relative frequencies) across groups, not raw counts — different group sizes make counts misleading.
$120$ students: maths $30$, science $50$, arts $40$.
- Bar chart: three separated bars of heights $30$, $50$, $40$ — science is tallest.
- Pie chart: slices of $25\%$, $\approx42\%$, $\approx33\%$ of the circle.
- Split by grade with a segmented bar chart, differing slice proportions would suggest an association with grade.
Display a categorical variable with a bar chart (separated bars, height = frequency or relative frequency) or a pie chart (slices = share of the whole). For two categorical variables, use side-by-side or segmented bar charts, and compare proportions across groups to spot an association.
Write from gaps between category bars
- A chart shows favourite sports as separate bars.
- The bars do not touch.
Why are there gaps?
Categorical bars are separated on purpose.
Why do these bars have gaps?
Difficulty 1/5 · 100 coins + a small bonus on first completion today
Separate labels are drawn as separate bars.