Representing a Quantitative Variable with Graphs
Introduced| English | Meaning |
|---|---|
| histogram/ˈhɪstəɡræm/ | A graph of grouped numerical data using adjoining bars whose areas represent frequencies. |
| dotplot/ˈdɒtplɒt/ | A graph placing a dot for each observation at its value on a number line, stacking repeated values. |
| stem-and-leaf plot/stem ænd liːf plɒt/ | A display splitting each numerical value into a leading part and a final digit while retaining the individual values. |
| bins/bɪnz/ | bins |
| ogive/ˈɒɡɪv/ | ogive |
Seeing the shape of numbers
- For a quantitative variable, we want to see how the values are distributed — clustered, spread, symmetric?
- Three standard displays reveal this: the histogram 直方图, dotplot 点图, and stem-and-leaf plot 茎叶图.
- Each shows the same data differently, but all reveal the overall shape.
- Reading these plots is where "describing a distribution" begins.
Histograms and bins
- A histogram groups values into intervals called bins 组距, then draws a bar for each bin's count.
- Unlike a bar chart, the bars touch — the scale is continuous.
- Bin choice matters: too few bins hide the shape; too many make it noisy. Aim for a number that reveals the real pattern.
- Taller bars = more data in that interval.
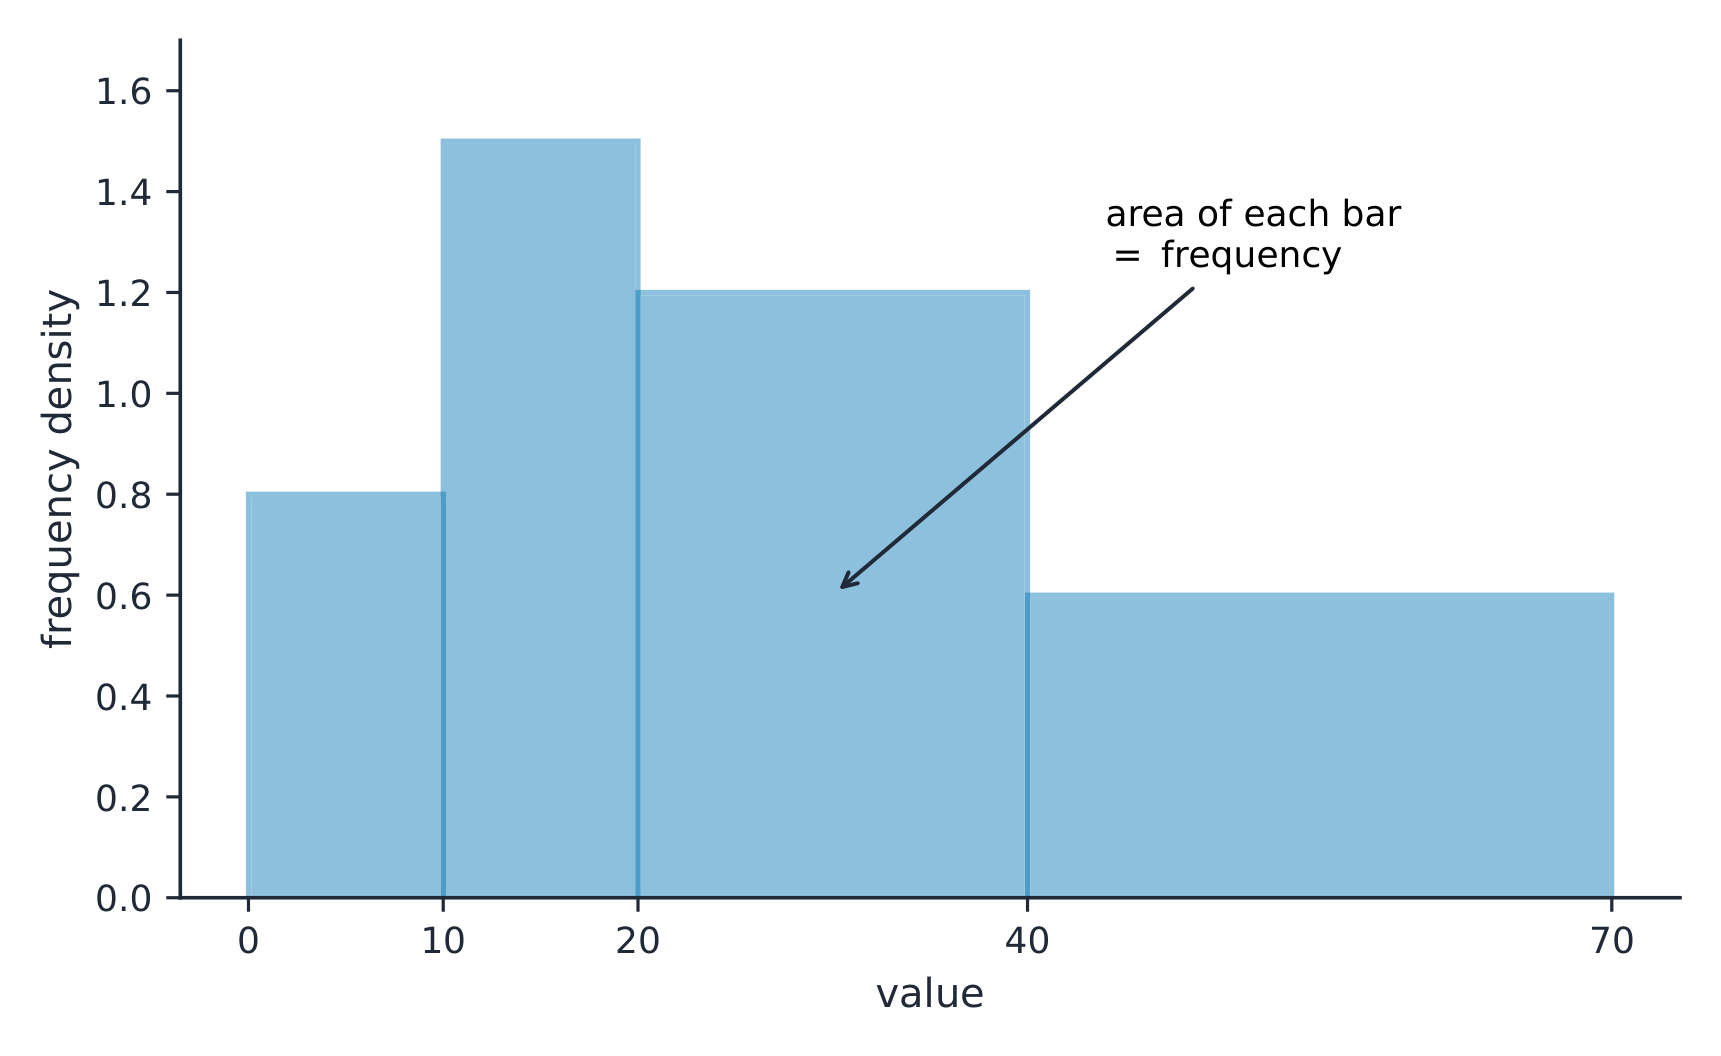
On a histogram with unequal class widths the bar area is the frequency
A histogram's shape
A histogram groups values into touching bins — the bar heights reveal where the data pile up.
A histogram's bars touch because the scale is continuous.
Difficulty 1/5 · 100 coins + a small bonus on first completion today
Touching bars distinguish it from a categorical bar chart.
Choosing too few bins in a histogram tends to...
Difficulty 1/5 · 100 coins + a small bonus on first completion today
Too few bins over-smooth and hide features.
The intervals that group a histogram's values are called ____.
Difficulty 1/5 · 100 coins + a small bonus on first completion today
Each bin becomes one bar.
Dotplots and stem-and-leaf
- A dotplot stacks one dot per value above a number line — great for small data sets, keeps every value.
- A stem-and-leaf plot splits each number into a stem (leading digits) and leaf (last digit), so you see shape and the actual values.
- Both are best for small-to-moderate data; a histogram handles large sets.
- All three answer "where do the values pile up?"
A stem-and-leaf plot shows the shape and keeps the actual data values.
Difficulty 1/5 · 100 coins + a small bonus on first completion today
The leaves are the actual last digits.
Cumulative graphs (ogives)
- A cumulative relative frequency graph (ogive 累积频率图) plots the running total proportion up to each value.
- It rises from $0$ to $1$ (or $0\%$ to $100\%$).
- Read a percentile from it: go up to a value, read across to the proportion below it.
- Great for questions like "what score is the $75$th percentile?"
A cumulative relative frequency graph (ogive) is used to read...
Difficulty 1/5 · 100 coins + a small bonus on first completion today
Read across from a proportion to find a percentile.
An ogive (cumulative relative frequency graph) rises from...
Difficulty 1/5 · 100 coins + a small bonus on first completion today
It accumulates proportions from $0$ up to $1$.
A histogram is for quantitative data — its bars touch (a continuous scale), unlike a categorical bar chart's separated bars. And your bin width shapes the picture: too wide erases features, too narrow adds noise. Try a sensible number of bins that shows the true shape, and state the bin width you used.
Test scores: $62, 65, 71, 71, 73, 78, 82, 85, 91$.
- Stem-and-leaf (stems = tens): $6\,|\,2\,5$; $7\,|\,1\,1\,3\,8$; $8\,|\,2\,5$; $9\,|\,1$.
- The shape is roughly symmetric, centered around the $70$s.
- A histogram with bins of width $10$ would show the same clustering.
Display a quantitative variable with a histogram (bars touch; choose sensible bins), a dotplot, or a stem-and-leaf plot — all reveal the shape. A cumulative relative frequency graph (ogive) rises from $0$ to $1$ and lets you read percentiles. Histogram bars touch, unlike categorical bar charts.
Write from bins on a histogram
- Quiz scores are numbers from 0 to 20.
- The display groups them into intervals.
What display is this, and why?
Histograms group numbers into adjoining intervals.
What groups the quiz scores?
Difficulty 1/5 · 100 coins + a small bonus on first completion today
Numerical scores belong in bins.