Representing a Categorical Variable with Tables
Introduced| English | Meaning |
|---|---|
| frequency table/ˈfriːkwənsi ˈteɪbl/ | A table showing how often each value, category or interval occurs in a dataset. |
| relative frequencies/ˈrelətɪv ˈfriːkwənsiz/ | relative frequencies |
| two-way table/tuː weɪ ˈteɪbl/ | A table showing frequencies or other data classified by two categorical variables. |
| joint frequency/dʒɔɪnt ˈfriːkwənsi/ | joint frequency |
| marginal/ˈmɑːdʒɪnl/ | marginal |
Counting categories
- The simplest way to summarize a categorical variable is to count how many fall in each group.
- A frequency table 频数表 lists each category with its count (frequency).
- It turns a long list of labels into a compact, readable summary.
- From counts, you can compute proportions and compare groups.
Relative frequencies
- Raw counts don't show share of the whole — for that, use relative frequencies 相对频数.
- Divide each count by the total to get a proportion (or ×100 for a percentage).
- $30$ out of $120$ students prefer maths → relative frequency $\tfrac{30}{120}=0.25=25\%$.
- Relative frequencies let you compare data sets of different sizes fairly.
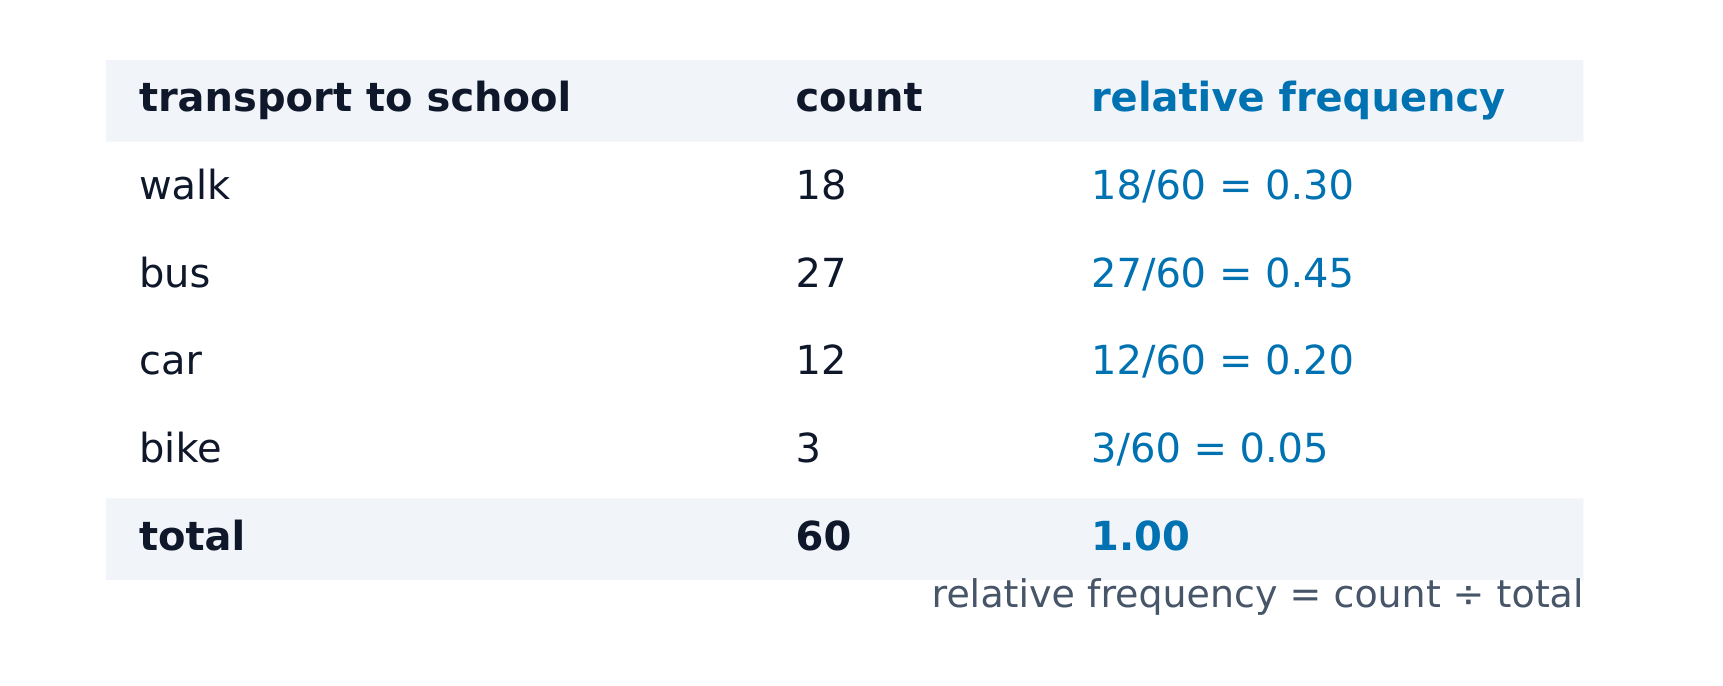
A frequency table lists counts; relative frequency is each count divided by the total
Shares of the whole
Relative frequencies are each category's share of the total — exactly what a pie chart of the frequency table shows.
Of $120$ students, $30$ prefer maths. What is the relative frequency (as a decimal)?
Difficulty 2/5 · 140 coins + a small bonus on first completion today
$30/120=0.25$.
Of $120$ students, $40$ prefer arts. What percent is that (to the nearest whole)?
Difficulty 2/5 · 140 coins + a small bonus on first completion today
$40/120\approx33\%$.
Relative frequencies let you fairly compare groups of different sizes.
Difficulty 1/5 · 100 coins + a small bonus on first completion today
Proportions remove the effect of group size.
Two-way tables
- To show two categorical variables at once, use a two-way table 双向表 (contingency table).
- Rows are one variable's categories, columns the other's; each cell is a joint frequency 联合频数 (count in both).
- Example: rows = grade level, columns = favorite subject; each cell counts students in that combination.
- It reveals how the two variables relate.
A two-way table is used to display...
Difficulty 1/5 · 100 coins + a small bonus on first completion today
It cross-tabulates two categorical variables.
Marginal vs. joint frequencies
- Joint frequency: a single inner cell — individuals in both categories.
- Marginal frequency 边际频数: a row or column total — the count for one variable, found in the margins.
- The margins recover each variable's own distribution; the inner cells show the combinations.
- Reading which is which is a common exam skill.
In a two-way table, a single inner cell count (both categories at once) is a...
Difficulty 1/5 · 100 coins + a small bonus on first completion today
Inner cell = joint frequency.
A row or column total in a two-way table is a ____ frequency.
Difficulty 1/5 · 100 coins + a small bonus on first completion today
Marginal = the total for one variable.
Keep marginal and joint frequencies distinct: a joint frequency is one inner cell (both categories at once), while a marginal frequency is a row/column total (one variable only). And relative frequencies are counts ÷ total — decide whether "the total" is the grand total, a row total, or a column total, because each gives a different proportion.
$120$ students: $30$ prefer maths, $50$ science, $40$ arts.
- Frequency table: maths $30$, science $50$, arts $40$.
- Relative frequencies: $25\%$, $\approx41.7\%$, $\approx33.3\%$ (each count ÷ $120$).
- If also split by grade, a two-way table's cell "Grade 11 ∩ science" would be a joint frequency.
Summarize a categorical variable with a frequency table of counts, then compute relative frequencies (count ÷ total) as proportions/percentages. A two-way table shows two categorical variables: inner cells are joint frequencies, and row/column totals are marginal frequencies.
Write from a relative frequency of 0.2
- 8 of 40 students prefer tea.
- The lesson relative frequency 0.25 and the percent 33 come from other counts.
What is the relative frequency who prefer tea?
Relative frequency is the count divided by the total.
What is the relative frequency?
Difficulty 1/5 · 100 coins + a small bonus on first completion today
8 divided by 40 is 0.2. Other options — 0.25 (the other class); 8 (the raw count).