What this course is, and how to use it
This is the twelfth course in University Business: strategic management 战略管理 — the discipline of choosing what the business will be, testing that the choice hangs together, and turning it into Monday morning. Eleven courses built the pieces; this course spends them.
The running case is Nimbus Kitchen at the crossroads: the festival contract is won, the second site runs (course 10), the legal file is tidy (course 11), and now the founder must choose between growing what works, adding products, or buying a café. Every framework is scored, every score is arithmetic, and every number recomputes from the project sheet.
- Units 12.1–12.2 analyse: the industry's structure and the firm's right to win.
- Units 12.3–12.4 choose and implement: where to grow, and what has to be true for it to work.
- Units 12.5–12.6 decide under uncertainty and put the whole case on one page.
How to read each unit: the decision first, then the framework, then two escalating worked analyses, the mistakes people actually make, and a three-line summary.
Industry and internal analysis
Why it matters. The founder thinks the craft-bakery segment is "obviously attractive" because queues are long. Structure says otherwise half the time — and the difference between an opinion and an analysis is a score.
The idea, with a picture. Five forces 五力模型, each scored 1–5 (higher = worse for us): rivalry 4 (two craft bakers per high street), new entrants 3 (a bakery is leaseable), substitutes 4 (supermarket in-store + coffee chains), supplier power 2 (many mills, course 10.5 dual-sourced), buyer power 3 (festivals negotiate, walk-ins don't). Total 16 of 25 ✓ — a structurally middling industry where the STRATEGY, not the industry, must make the money.
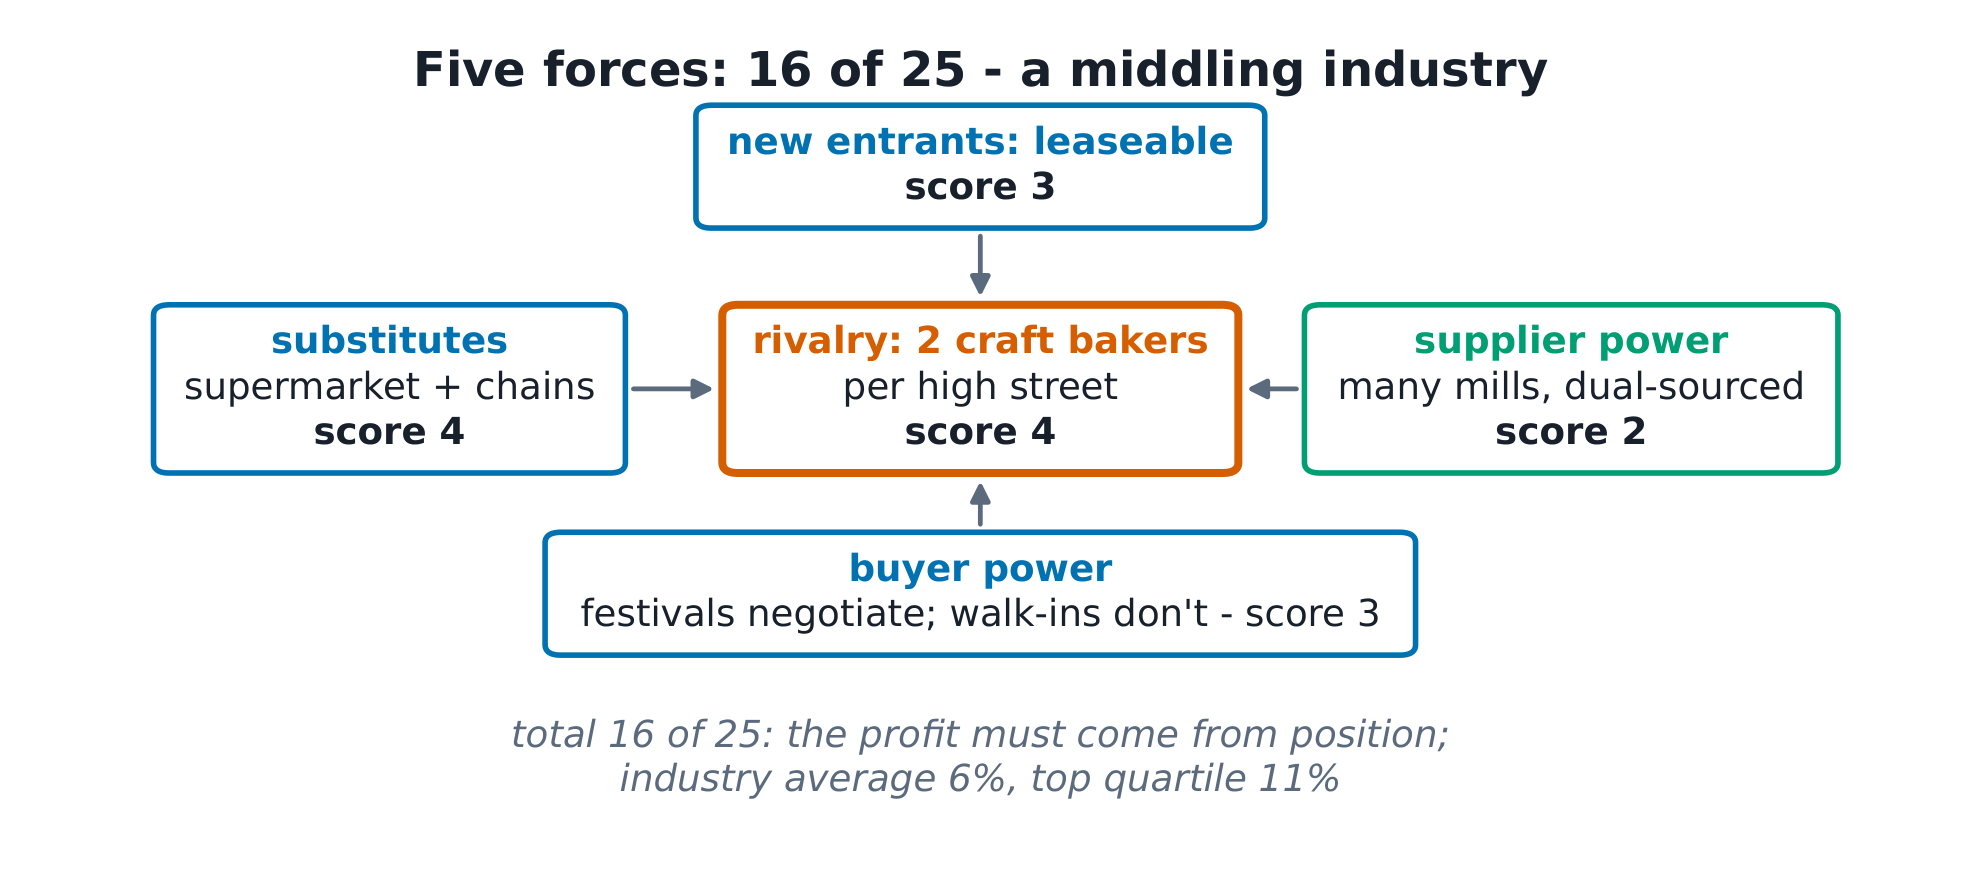
The definitions. Five forces: rivalry, entrants, substitutes, supplier power, buyer power — industry profit is their residue. VRIO VRIO分析: is the resource Valuable, Rare, difficult to Imitate, and Organised for capture — the last question separates competitive parity from sustained advantage. Value chain 价值链: margin decomposed along the activities.
The derivation. The value chain of the 2.50 bun: materials 0.95, labour 0.70, energy 0.20, distribution 0.15, overhead 0.30 → cost 2.30, margin 0.20 = 8.0% ✓ — above the 6% industry average and below the 11% top quartile, which is exactly where a middling-industry differentiator sits. VRIO on five resources: the ovens (valuable, not rare → parity), the crew (valuable, not rare → parity), the recipe (valuable, rare, but reverse-engineerable → temporary), the loyalty data (valuable, rare, partly organised → temporary), the festival brand (valuable, rare, built on nine years of history — causally ambiguous, organised through the contract → sustained). One resource carries the strategy; the other four are the tax.
Worked example 1 — score the force, then find the lever. Buyer power scores 3: festivals negotiate hard (few, large, concentrated) but walk-ins don't. The lever hiding inside the score: contract design (course 11.2's licence terms) converts one negotiator into a relationship, and the loyalty app (course 10's 14,000 records) makes the walk-ins measurable — the score is a diagnosis, and every diagnosis names a treatment or it is decoration.
Worked example 2 — escalate to the margin bridge. To reach the top quartile's 11%, Nimbus needs +0.08 a bun (0.03 price on the festival line, 0.03 materials through the pooling of course 10.5's safety stock, 0.02 labour through the second mixer's 1.67 batches an hour). Frameworks do not close that gap; they locate it — and the bridge above is three line items long, each owned by a unit of this course.
Common mistakes. Scoring forces with adjectives instead of evidence. Reading VRIO as a checklist (the I question is about imitation COST, including time). And treating industry attractiveness as destiny — 16 of 25 industries contain 11% quartiles.
Summary. Forces total 16 of 25: the industry is middling; the margin bridge from 8 to 11% is three line items. VRIO: one sustained resource (the brand), two temporary, two parity. Analysis names levers or it is decoration.
Competitive strategy
Why it matters. "Premium quality at a value price" is not a strategy; it is a wish with two adjectives. A strategy is a POSITION — premium or value, not both — and a system of activities that only makes sense in that position.
The idea, with a picture. Nimbus's choice against the supermarket in-store bakery: its cost is 1.60 a bun at 200,000 a week; Nimbus's is 2.30 at 19,200. Nimbus cannot win cost; it can win willingness to pay — 2.50 against 1.20, a premium of 108% ✓ carried by the festival brand.
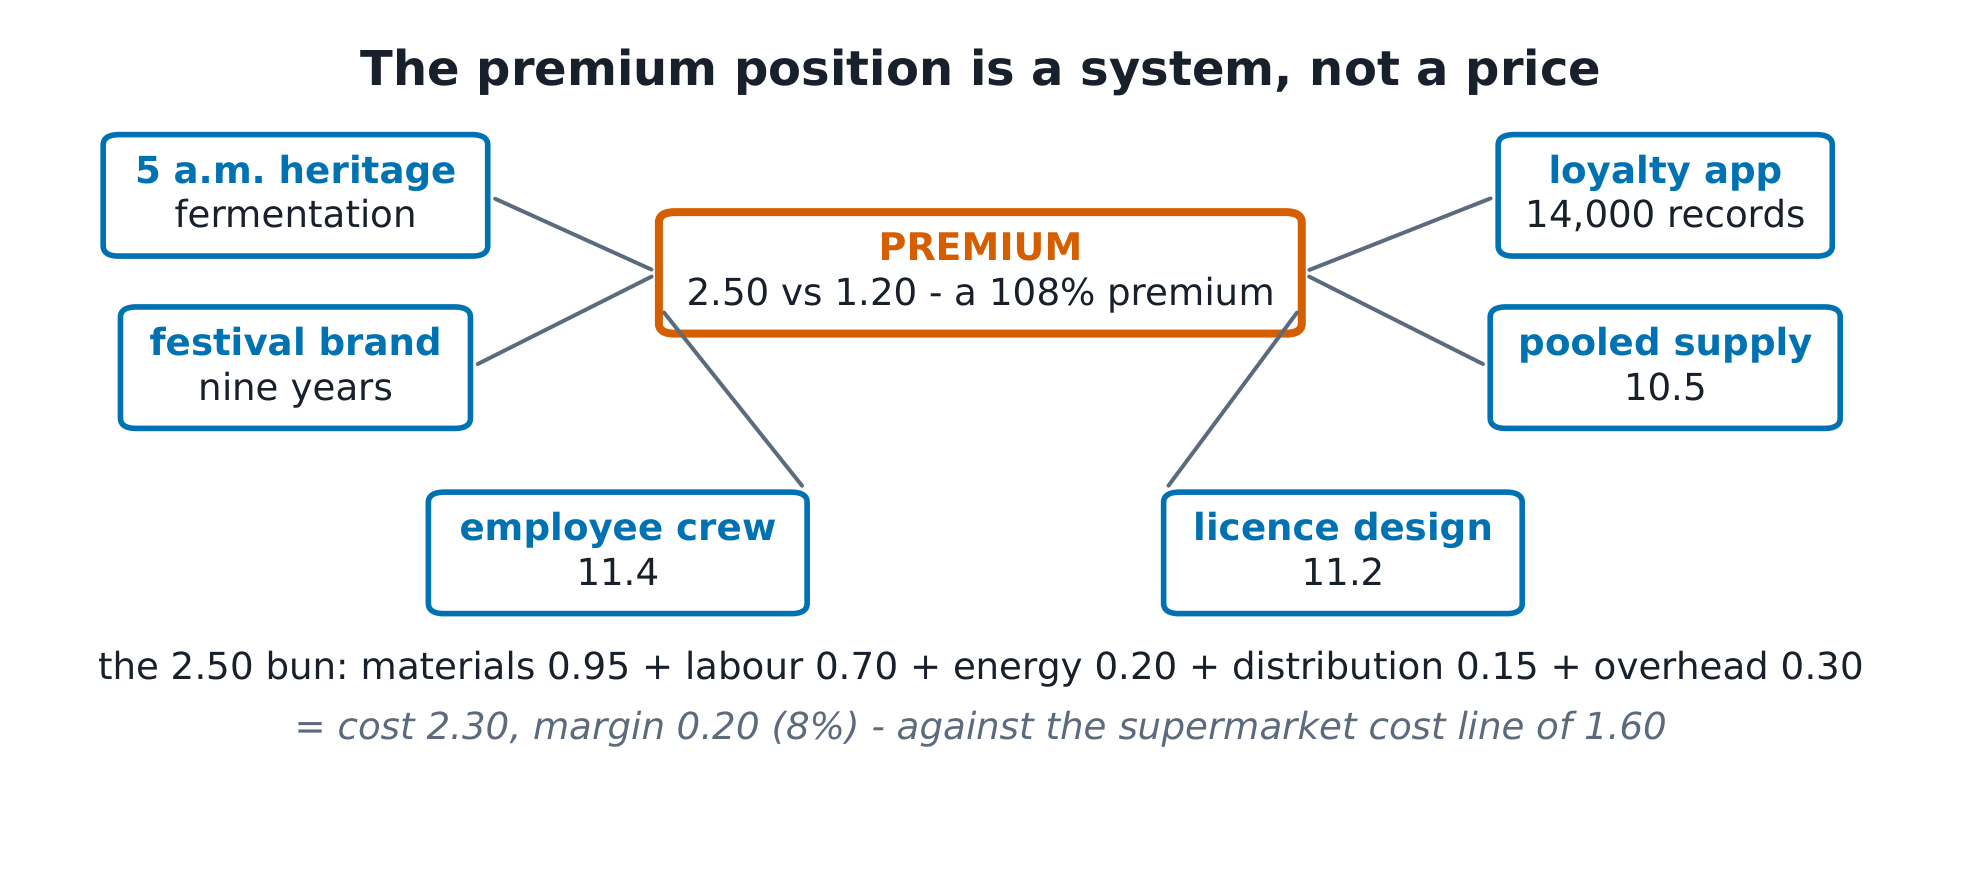
The definitions. Cost leadership 成本领先: win on the cost curve. Differentiation 差异化: win on willingness to pay. Stuck in the middle 夹在中间: neither — the profitless place. Activity system 活动系统: the map of reinforcing activities that delivers the position; fit makes the system hard to imitate even when every activity is visible. Dominant strategy 占优策略: a move best whatever the rival does.
The derivation. The game (weekly contribution, Nimbus / rival, in thousands): Nimbus Premium against rival Ignore 22 / 14; Premium against Match 12 / 10; Standard against Ignore 15 / 12; Standard against Match 13 / 9. Rival: Ignore beats Match against both of Nimbus's moves (14 > 10, 12 > 9) — Ignore is dominant. Nimbus: Premium is NOT dominant — it wins against Ignore (22 > 15) but loses against Match (12 < 13) — so Nimbus's answer must wait on the rival's. The rival's dominance resolves it: Ignore is coming, and against a rival who Ignores, Premium 22 beats Standard 15. The unique equilibrium: (Premium, Ignore), 22 / 14 ✓.
Worked example 1 — the value line that loses money. The founder floats a "Nimbus Value" bun at 1.80 to catch the supermarket shopper. Arithmetic: the value line's cost is 1.95 (smaller batches, separate packaging, no festival subsidy) → margin −0.15 ✓ per bun. Worse than unprofitable: it spends the brand's scarcity (course 12.1's only sustained resource) to attack the one rival whose cost curve Nimbus cannot beat. This is the stuck-in-the-middle trap wearing a growth costume — the analysis kills it in one subtraction.
Worked example 2 — escalate to the fit that defends. Suppose the rival MATCHES the premium: weekend festival stalls of its own. The activity map is the defence: the rival can copy the buns (activity one) but not profitably carry the rest — the 5 a.m. heritage fermentation needs the crew (course 11.4's employee tests found loyalty), the contract terms (course 11.2's licence design), the pooled supply (course 10.5), the brand's nine years. Matching one activity buys the cost without the willingness to pay — which is exactly why the payoff matrix says Match pays the rival 10 against Ignore's 14. Fit, not secrecy, is the moat.
Common mistakes. Reading the activity map as a list (the ARROWS are the strategy). Playing the game without asking what the rival's dominant move is. And pricing a value line before subtracting its own cost.
Summary. Position first: premium at a 108% premium, carried by fit. The equilibrium is (Premium, Ignore) — 22 against 14. A value line at −0.15 is the middle, and the middle is where margins die.
Corporate and international strategy
Why it matters. Growth is not a strategy; it is four different bets with different risks (Ansoff), and one of them — buying the café — is a number, not a feeling. The same for the export idea: distance is measurable, and measured distance usually says license, don't ship.
The idea, with a picture. The four bets, each with an expected value: penetration 11.6k, market development 9.6k, product development 8.5k, diversification 7.0k ✓ — and the twist the table forces you to see: the highest-EV bet is the safest one, and the most exciting one has the worst EV and the biggest tail.
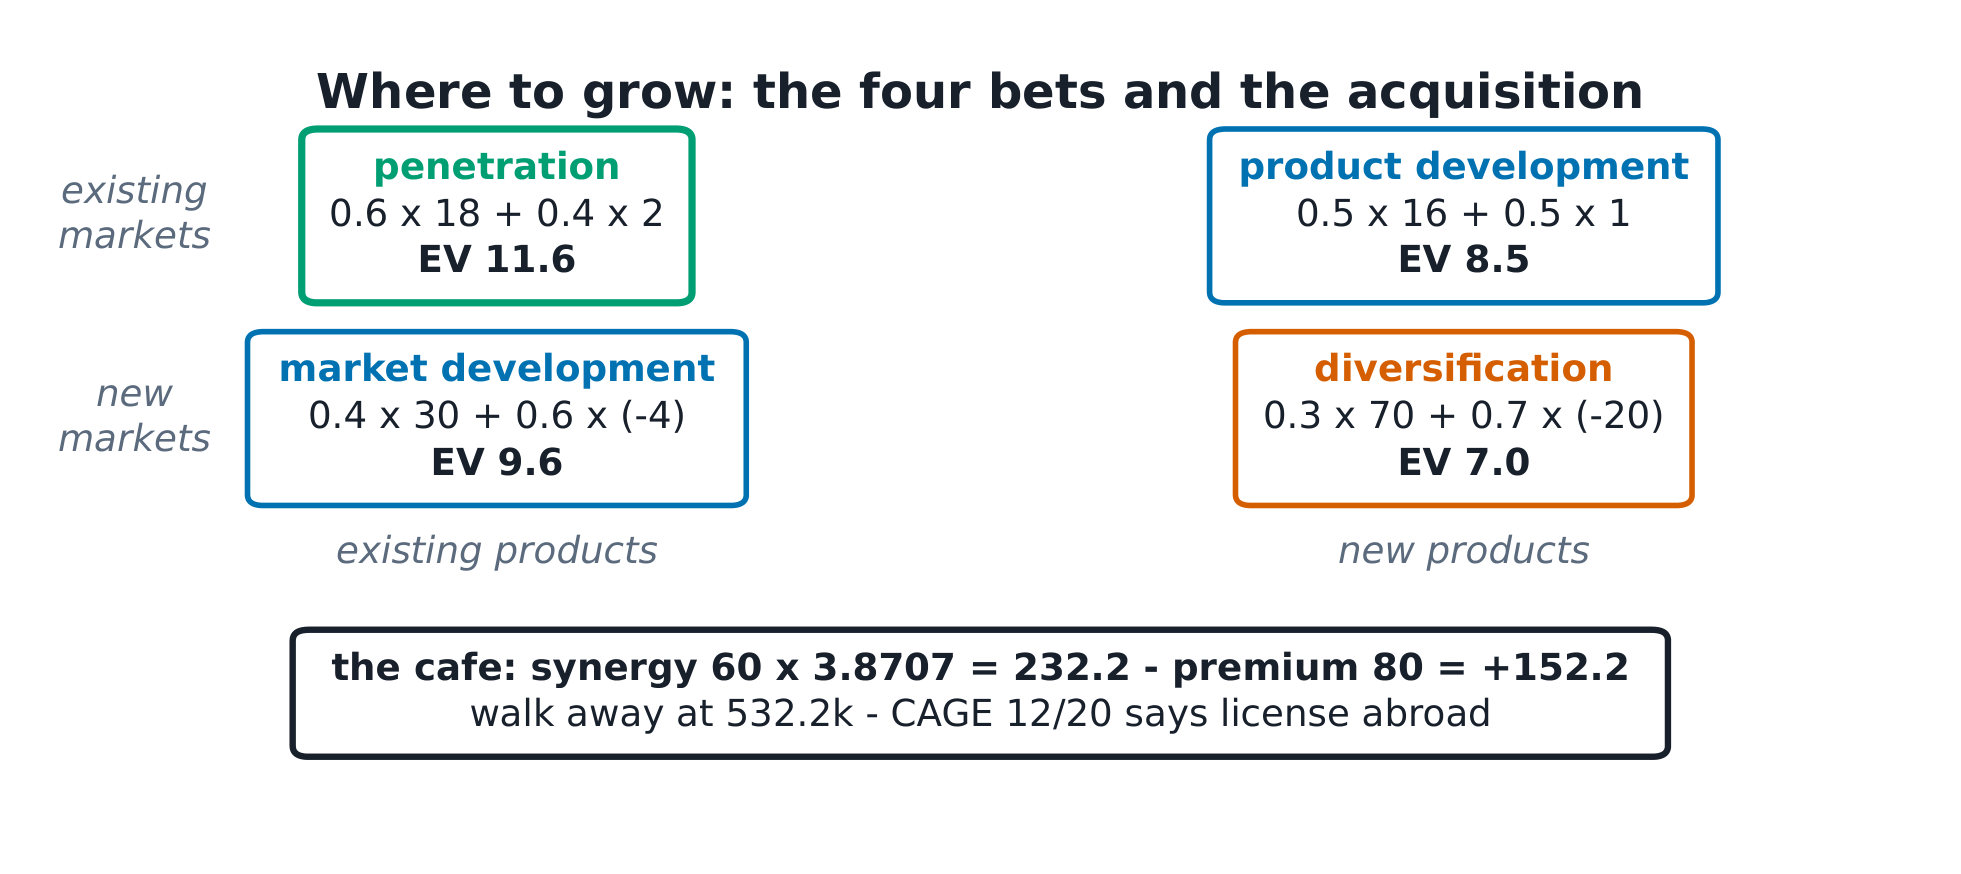
The definitions. Ansoff matrix 安索夫矩阵: market/product, old and new — penetration, development, diversification, each step out raising risk. CAGE distance CAGE距离: cultural, administrative, geographic, economic distance — the corrective to "the world is flat". Synergy 协同效应: value only if 2 + 2 > 5 after the premium is paid. Parenting advantage: HQ must add more value than it costs.
The derivation. The EVs: penetration $0.6 \times 18 + 0.4 \times 2 = 11.6$k ✓; market development $0.4 \times 30 + 0.6 \times (-4) = 9.6$k ✓; product development $0.5 \times 16 + 0.5 \times 1 = 8.5$k ✓; diversification $0.3 \times 70 + 0.7 \times (-20) = 7.0$k ✓. The acquisition: the café standalone is worth 300k; Nimbus offers 380k — an 80k premium. Synergies (festival outlet, pooled flour, the loyalty list) 60k a year for five years at the course-9 WACC 9.19%: annuity factor 3.8707, PV 232.2k ✓. The deal creates value for Nimbus if the premium is below the synergy PV: $232.2 - 80 = \mathbf{+152.2}$k ✓ — the arithmetic says buy, and the CAGE table on the export idea says license (cultural 3 + administrative 4 + geographic 3 + economic 2 = 12 of 20 ✓: far; export dies in the admin, licensing keeps the recipe home).
Worked example 1 — the premium is the price of the synergy. Two boards argue: "the synergies are 232k, buy at any price" against "acquisitions destroy value". Both are wrong by the same arithmetic: value created = synergy PV − premium, and the premium is the negotiation. At 380k the deal is worth +152.2k; at 550k it is worth −17.8k (232.2 − 250) ✓; the walk-away number is 300 + 232.2 = 532.2k ✓. The board that does not know its walk-away number is not negotiating; it is hoping.
Worked example 2 — escalate to the parent's own test. If Nimbus buys the café, HQ (the founder) must run two businesses. The parenting test: what does HQ actually add — the flour pooling (real, course 10.5's numbers), the brand licence (real, priced in the synergy), the founder's sixteen-hour days (a COST, and the scarcest resource in the file). The honest answer in the case: buy only with the Saturday supervisor promoted to café manager (course 11.4's status tests already classify her as an employee with the skills), because a parent that adds management hours it does not have is subtracting.
Common mistakes. Reading Ansoff as a menu of equal squares (risk rises left to right and top to bottom). Valuing synergies gross and premiums net. And calling licensing a defeat — with CAGE at 12 of 20 it is the highest-EV form of the international bet.
Summary. EVs: 11.6 / 9.6 / 8.5 / 7.0 — penetration funds the future. The café: value = 232.2 − premium; walk away at 532.2k. CAGE 12 of 20: license the brand, don't ship the buns.
Implementation and organisation
Why it matters. The best strategy in this file fails at 6 a.m. if the crew, the measures and the money point somewhere else. Implementation is not the soft part; it is the part with the scorecard and the arithmetic.
The idea, with a picture. The balanced scorecard 平衡计分卡: financial 82, customer 76, process 68, learning 61 — weighted 30/30/ 25/15 (past results get weight; the future gets some) → index 73.6 ✓. And the gap the index hides: the strategy needs 32 supervisory hours a week; the roster has 28. Four hours a week is the whole execution plan.
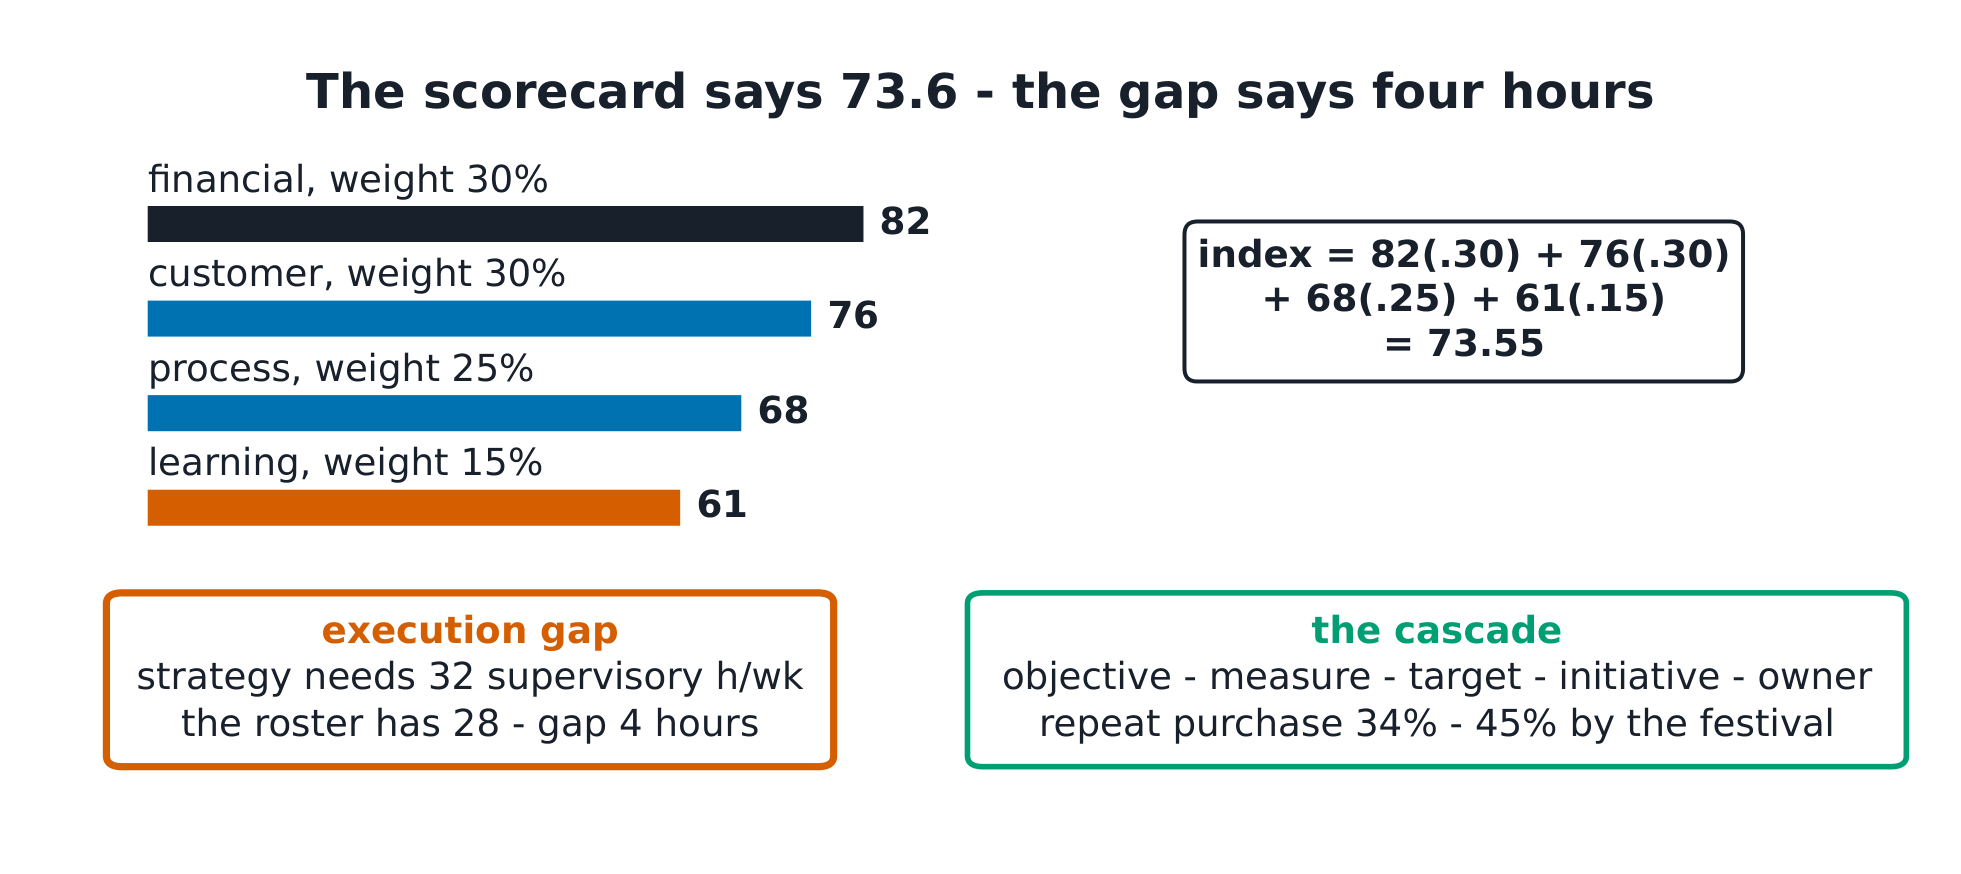
The definitions. Balanced scorecard: financial, customer, process, learning — measures chained by cause (learning → process → customer → financial). Strategy map: those chains drawn. The cascade: objective → measure → target → initiative → owner, down to the Saturday roster. Execution gap 执行差距: resources the strategy needs minus resources the organisation has — stated in hours and pounds.
The derivation. The index: $82(0.30) + 76(0.30) + 68(0.25) + 61(0.15) = 24.6 + 22.8 + 17.0 + 9.15 = 73.55$ ✓. The weakest perspective (learning 61) is the leading indicator: the process score 68 follows it by a quarter, the customer score 76 by two. The cascade's arithmetic: premium position needs 32 supervisory hours (5 a.m. fermentation checks, festival logistics, the café walk-through); the roster supplies 28; the gap of 4 hours ✓ is bought three ways in the case — promote and train (+3, the course-11 supervisor), cut one low-value activity (−1, the value line is dead anyway), and measure the rest.
Worked example 1 — find the gap before the plan. A strategy review that never states the gap produces calendars, not change. The case writes it as one sentence: the premium position requires 32 hours of supervision and the organisation has 28 — every initiative that does not close, buy or shrink those four hours is theatre. Compare: the balanced scorecard's 73.6 looks healthy and predicts nothing; the 4-hour gap predicts the August collapse that follows in the case, which is why the gap, not the index, goes on the wall.
Worked example 2 — escalate to the measure that changes behaviour. The cascade's customer objective: "the festival brand means the best bun" → measure: repeat purchase in the loyalty app (currently 34%) → target 45% by the festival → initiative: the 5 a.m. fermentation log, owned by the head baker. The test of a good measure: the owner can move it this month. "Brand equity" fails the test; "34% repeat" passes — and the scorecard's customer 76 becomes auditable one number at a time.
Common mistakes. Weighting the scorecard to flatter (financial at 70% is last year wearing a scorecard). Cascading to measures nobody owns. And writing the implementation plan before finding the execution gap.
Summary. Scorecard 73.6 — and the 4-hour supervisory gap is the real headline. Cascade every objective to an owner who can move the number this month. Learning 61 is the leading indicator; fund it first.
Strategy under uncertainty
Why it matters. The founder does not know whether the festival doubles, stalls or dies — and "we'll adapt" is not a plan. Uncertainty has arithmetic: expected values, the value of information, and the price of staging.
The idea, with a picture. Three scenarios for the festival year: grows (p 0.5, payoff 45k), stalls (p 0.3, 18k), dies (p 0.2, −12k). Expected value 期望值 = $22.5 + 5.4 - 2.4 = \mathbf{25.5}$k ✓. EVPI: with perfect information you act only on the first two → $0.5 \times 45 + 0.3 \times 18 = 27.9$k; the information is worth $27.9 - 25.5 = \mathbf{2.4}$k ✓ — that is the most any research study may cost.
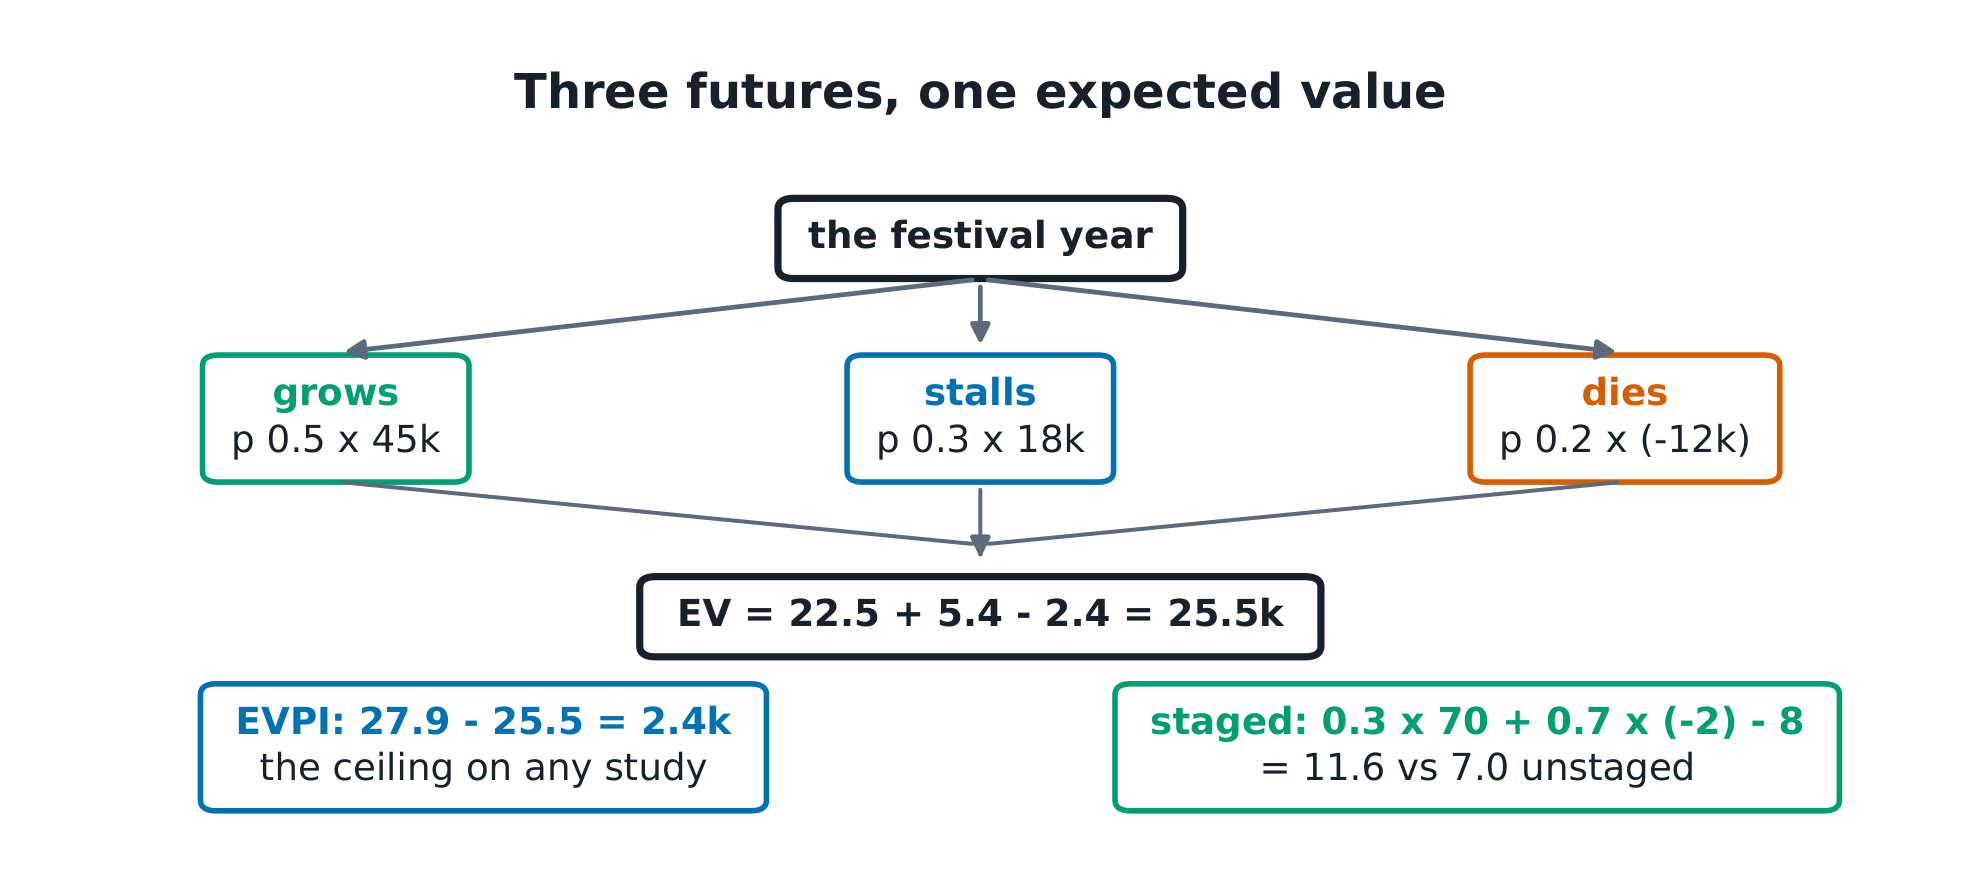
The definitions. Scenario 情景: a coherent future, not a forecast. EV: probability-weighted payoff. EVPI 完全信息期望价值: the ceiling value of information — what perfect foresight would add. Real option 实物期权: paying to keep a decision open; the pilot is a call option on expansion. Trigger 触发条件: the pre-committed number that forces the review.
The derivation. The staged café: pilot the takeover with an 8k festival-weekend trial. Staged: $0.3 \times 70 + 0.7 \times (-2) - 8 = \mathbf{11.6}$k ✓ against the unstaged 7.0 — staging adds +4.6 by cutting the tail, not by raising the head. The scenario arithmetic above gives EV 25.5 and EVPI 2.4; the trigger written into the case: if festival pre-orders fall 20% below plan by week 4, the expansion option lapses unexercised — a decision made in daylight, revisited by rule.
Worked example 1 — price the study before commissioning it. A consultant offers a festival-demand study for 6k. The EVPI arithmetic caps ALL information about the scenarios at 2.4k — the study is unbuyable at any price above that, however good. The reframe that is actually worth 2.4k: a week of loyalty-app data (course 10's 14,000 records) is nearly free and moves the probabilities. Most "research" dies at the EVPI line, and the discipline is one subtraction.
Worked example 2 — escalate to the option portfolio. The case's three options: the café pilot (cost 8, value added 4.6), the school contract pilot (cost 2, adds 1.1 by the same staging arithmetic), the second-oven expansion (already committed — course 10's capacity maths). The portfolio view: options are bought when cheap and uncertainty is high, exercised when the trigger hits, abandoned without grief when it doesn't — the opposite of the plan that is defended because it was written. The founder's one-line summary: spend 10k on options, 2.4k maximum on knowing, and nothing on pretending.
Common mistakes. Treating the EV as a forecast (it is a weighted average of futures that will not happen). Buying information above its EVPI. And confusing flexibility with indecision — the option has a trigger, a price and an expiry or it is procrastination.
Summary. EV 25.5; EVPI 2.4 — the ceiling on research. Staging the café: 7.0 → 11.6 for an 8k pilot; the tail is where options pay. Write the trigger before the uncertainty resolves.
Integrated case
Why it matters. Twelve courses built one bakery. The case pulls the file together — and the test of everything above is whether one page can carry it.
The idea, with a picture. The logic map: the industry (16/25) → the position (premium, one sustained resource) → the fit (six activities) → the growth bets (11.6 / 9.6 / 8.5 / 7.0) → the execution (73.6 index, 4-hour gap) → the uncertainty (EV 25.5, staged to 11.6) → the decision.
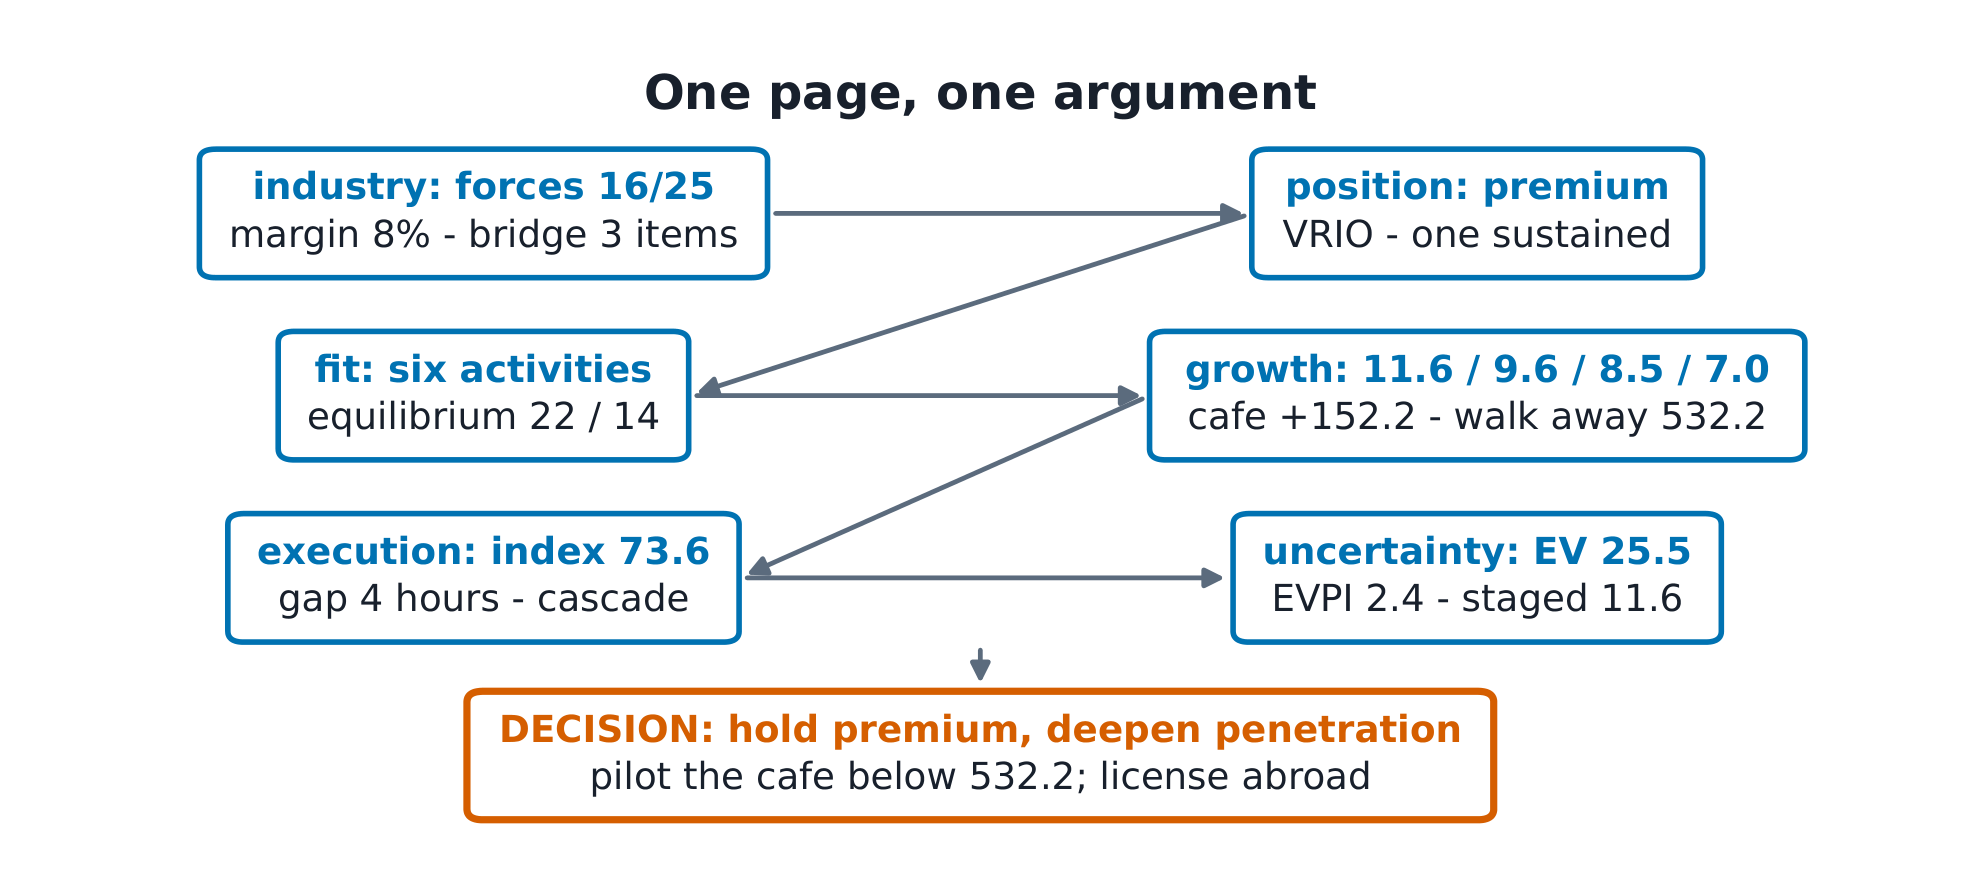
The definitions. A case analysis 案例分析: situation → frameworks (chosen, scored) → options (numbered) → decision → risks and review. The discipline from course 1 still holds: evidence for every claim, a number for every argument.
The derivation. The page's spine, recomputed: forces 16 of 25 and margin 8% against a bridge to 11%; VRIO one sustained; the equilibrium (Premium, Ignore) at 22/14 and the value line at −0.15; growth EVs 11.6/9.6/8.5/7.0 with the café at +152.2 and a 532.2 walk-away; the scorecard 73.6 with the 4-hour gap; uncertainty at EV 25.5, EVPI 2.4, staged 11.6. Every number traces to a unit and a line of arithmetic — that is what makes it a case and not a story.
Worked example 1 — the decision memo. Forty words: "We hold the premium position and deepen it (penetration EV 11.6): the second stage, the pooled supply, the fermentation log. We buy the café only at or below 532.2k with the supervisor as manager, piloted first (staged 11.6). We license abroad (CAGE 12). We do not ship buns, and we do not launch the value line." Every clause carries a number from the file — which is why it survives a board.
Worked example 2 — escalate to the review. The memo ends with its own falsification: repeat purchase 34% → 45% by the festival (owner: head baker); supervisory gap 4 → 0 hours by June (owner: founder); festival pre-orders −20% by week 4 triggers the option's lapse (rule). A strategy that cannot say what would prove it wrong is a belief; this one names three numbers and dates.
Common mistakes. Framework tourism — five models, no decision. Numbers without owners, owners without dates. And the retrospective rewrite: the case is written before the festival, not after.
Summary. One page, one argument, every number traceable. The memo holds forty words and three review triggers. Analysis ends in a decision or it never started.
The project sheet (reproducible)
The Nimbus Kitchen strategic file, one page:
- Industry: forces 4 + 3 + 4 + 2 + 3 = 16/25; bun economics 0.95 + 0.70 + 0.20 + 0.15 + 0.30 = 2.30 against 2.50 → margin 0.20 = 8%; bridge to the 11% quartile = price 0.03 + materials 0.03 + labour 0.02.
- Position: VRIO — brand sustained; recipe, data temporary; ovens, crew parity. Premium 2.50 vs 1.20 (108%); supermarket cost 1.60; the value line 1.80 vs cost 1.95 = −0.15.
- Game: (Premium, Ignore) = 22/14 unique — Ignore dominates for the rival (14 > 10, 12 > 9); Premium wins against Ignore (22 > 15).
- Growth: EVs penetration 11.6 / market 9.6 / product 8.5 / diversify 7.0 (thousands). Café: synergy 60k × 3.8707 = 232.2k; premium 80 → +152.2; walk-away 532.2k. CAGE 3+4+3+2 = 12/20 → license.
- Execution: scorecard 82/76/68/61 at 30/30/25/15 → 73.55; supervisory need 32 vs have 28 → gap 4 hours.
- Uncertainty: scenarios 0.5×45 + 0.3×18 + 0.2×(−12) = EV 25.5; EVPI 27.9 − 25.5 = 2.4; staged café 0.3×70 + 0.7×(−2) − 8 = 11.6 vs 7.0 unstaged. Triggers: repeat 34→45; gap→0; pre-orders −20% by week 4.
Every number in this handout recomputes from these values.