This handout covers Topic 5: Probability & Statistics 概率统计 1. It is about describing data, counting choices, and working out the chance of events.
Probability & Statistics 1
A-Level Mathematics · Topic 5
 11:38
Probability & Statistics 1
Roll a single die, and the result is anyone's guess. But roll it thousands of times, or measure the heights of thousands of people, and something remarkable…
English narration · English + 中文 subtitles burned in
5.1
Representation of data

Syllabus
| Candidates should be able to: | Notes and examples |
|---|---|
| • select a suitable way of presenting raw statistical data, and discuss advantages and/or disadvantages that particular representations may have | |
| • draw and interpret stem-and-leaf diagrams, box-and-whisker plots, histograms and cumulative frequency graphs | Including back-to-back stem-and-leaf diagrams. |
| • understand and use different measures of central tendency (mean, median, mode) and variation (range, interquartile range, standard deviation) | e.g. in comparing and contrasting sets of data. |
| • use a cumulative frequency graph | e.g. to estimate medians, quartiles, percentiles, the proportion of a distribution above (or below) a given value, or between two values. |
| • calculate and use the mean and standard deviation of a set of data (including grouped data) either from the data itself or from given totals $\Sigma x$ and $\Sigma x^2$, or coded totals $\Sigma(x - a)$ and $\Sigma(x - a)^2$, and use such totals in solving problems which may involve up to two data sets. |
Source: Cambridge International syllabus
Choose a diagram that suits the data. You should be able to draw and read:
- a stem-and-leaf diagram 茎叶图 (keeps the original values and shows the shape); two data sets are compared with a back-to-back 背靠背 version – a shared central stem, one set's leaves increasing to the left and the other's to the right, so you can compare their medians and spreads at a glance;
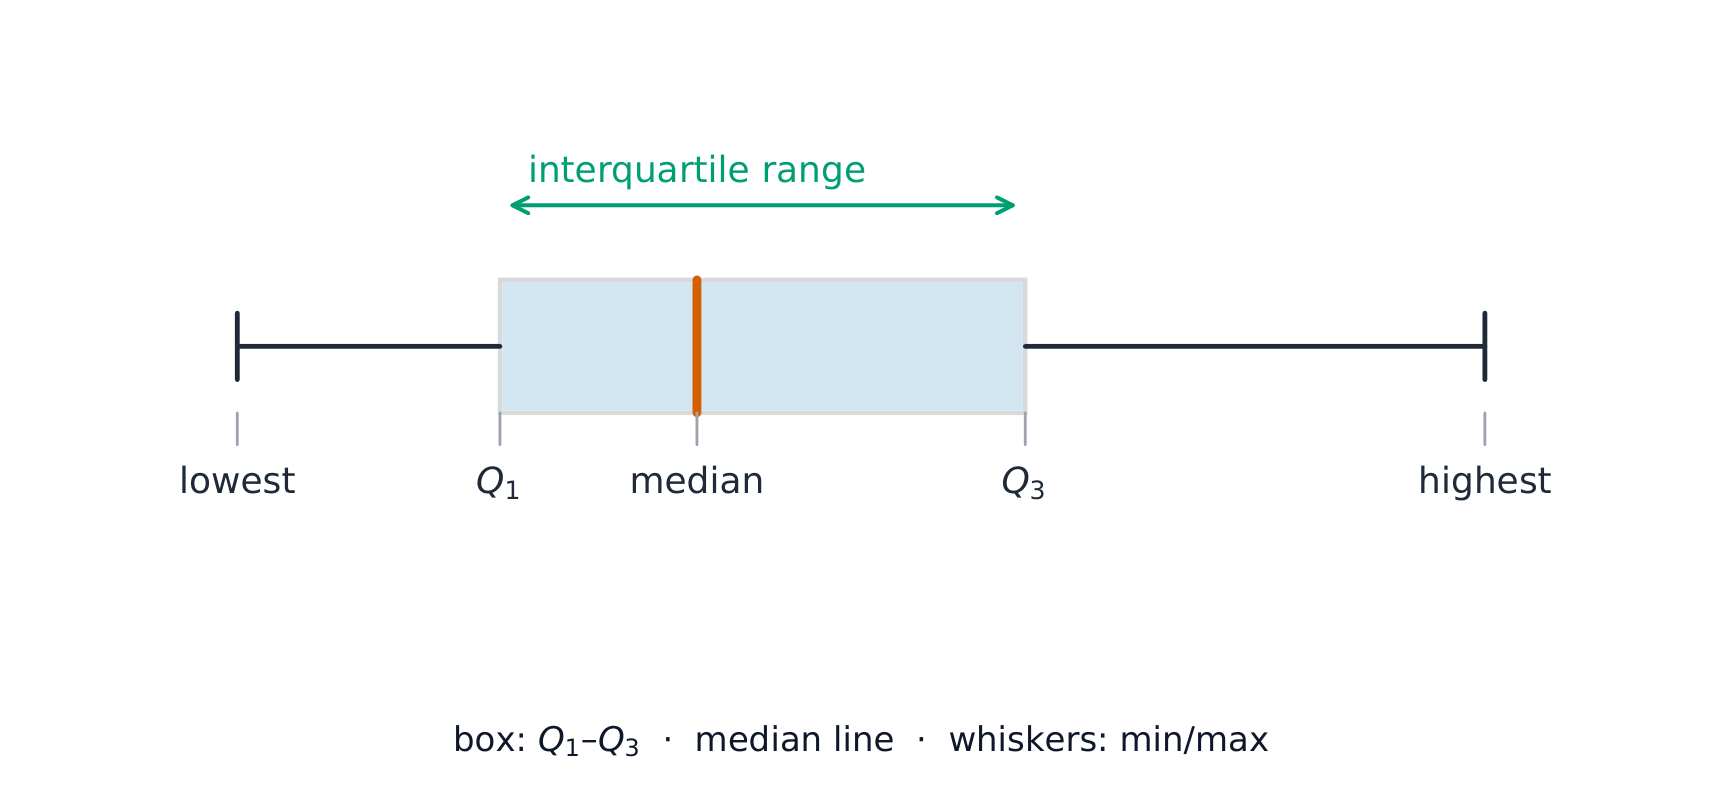
- a box-and-whisker plot 箱线图 (shows the lowest value, the three quartiles, and the highest value);
- a histogram 直方图 (for grouped data, where the area of each bar shows the frequency);
- a cumulative frequency 累积频数 graph (running totals, used to estimate the median and quartiles).
Averages and spread
A measure of central tendency 集中趋势 is a single "middle" value:
- the mean 平均数 $\bar{x} = \dfrac{\sum x}{n}$ (the average);
- the median 中位数 (the middle ordered value, or the mean of the middle pair for an even number of values);
- the mode 众数 (the most common value).
A measure of variation 离散程度 shows how spread out the data is:
- the range (of data) 极差 (highest $-$ lowest);
- the interquartile range 四分位距 (upper quartile $-$ lower quartile);
- the standard deviation 标准差 $\sigma = \sqrt{\dfrac{\sum x^2}{n} - \bar{x}^2}$.
You often work from the totals $\sum x$ and $\sum x^2$. The square of the standard deviation is the variance 方差.
Worked example. For $10$ values, $\sum x = 50$ and $\sum x^2 = 300$. Find the mean and standard deviation.
$$\bar{x} = \frac{50}{10} = 5, \qquad \sigma = \sqrt{\frac{300}{10} - 5^2} = \sqrt{30 - 25} = \sqrt{5} = 2.24.$$
Coding 编码 makes big numbers easier. Replace each value by $t=x-a$ for a convenient assumed mean 假定平均数 $a$. Then $\bar{x}=a+\bar{t}$, while the standard deviation is unchanged (shifting every value does not spread the data). So from the coded totals $\sum(x-a)$ and $\sum(x-a)^2$ you get $\bar x$ and $\sigma$ directly, and two data sets can be compared through their coded totals.
Worked example: coded totals. For $8$ values, $\sum(x - 50) = 24$ and $\sum(x - 50)^2 = 200$. Find the mean and standard deviation of $x$.
Work with $t = x - 50$ first: $\bar t = \dfrac{24}{8} = 3$ and $\sigma_t = \sqrt{\dfrac{200}{8} - 3^2} = \sqrt{16} = 4$. Shift back for the mean only: $\bar x = 50 + 3 = 53$, and $\sigma_x = 4$, unchanged. Adding $50$ to the standard deviation is the usual error.
Explore
Spread and the bell
P(−k < Z < k)
Spread is measured in standard deviations — about 68% of data lies within 1 sd, 95% within 2.
Vocabulary
Train
| English |
|---|
| stem-and-leaf diagram/stem ænd liːf ˈdaɪəɡræm/ |
| back-to-back/bæk tə bæk/ |
| box-and-whisker plot/bɒks ænd ˈwɪskə plɒt/ |
| histogram/ˈhɪstəɡræm/ |
| cumulative frequency/ˈkjuːmjʊlətɪv ˈfriːkwənsi/ |
| measure of central tendency/ˈmeʒə ɒv ˈsentrəl ˈtendənsi/ |
| mean/miːn/ |
| median/ˈmiːdiːən/ |
| mode/məʊd/ |
| variation/ˌveərɪˈeɪʃn/ |
| range (of data)/reɪndʒ/ |
| interquartile range/ˌɪntəˈkwɔːtaɪl reɪndʒ/ |
| standard deviation/ˈstændəd ˌdiːvɪˈeɪʃn/ |
| variance/ˈveərɪəns/ |
| Coding/ˈkəʊdɪŋ/ |
| assumed mean/əˈsjuːmd miːn/ |
| central tendency/ˈsentrəl ˈtendənsi/ |
5.2
Permutations and combinations
Syllabus
| Candidates should be able to: | Notes and examples |
|---|---|
| • understand the terms permutation and combination, and solve simple problems involving selections | |
| • solve problems about arrangements of objects in a line, including those involving – repetition (e.g. the number of ways of arranging the letters of the word ‘NEEDLESS’) – restriction (e.g. the number of ways several people can stand in a line if two particular people must, or must not, stand next to each other). | Questions may include cases such as people sitting in two (or more) rows. Questions about objects arranged in a circle will not be included. |
Source: Cambridge International syllabus
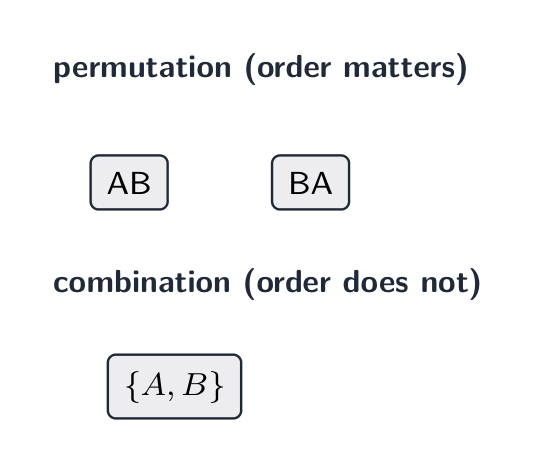
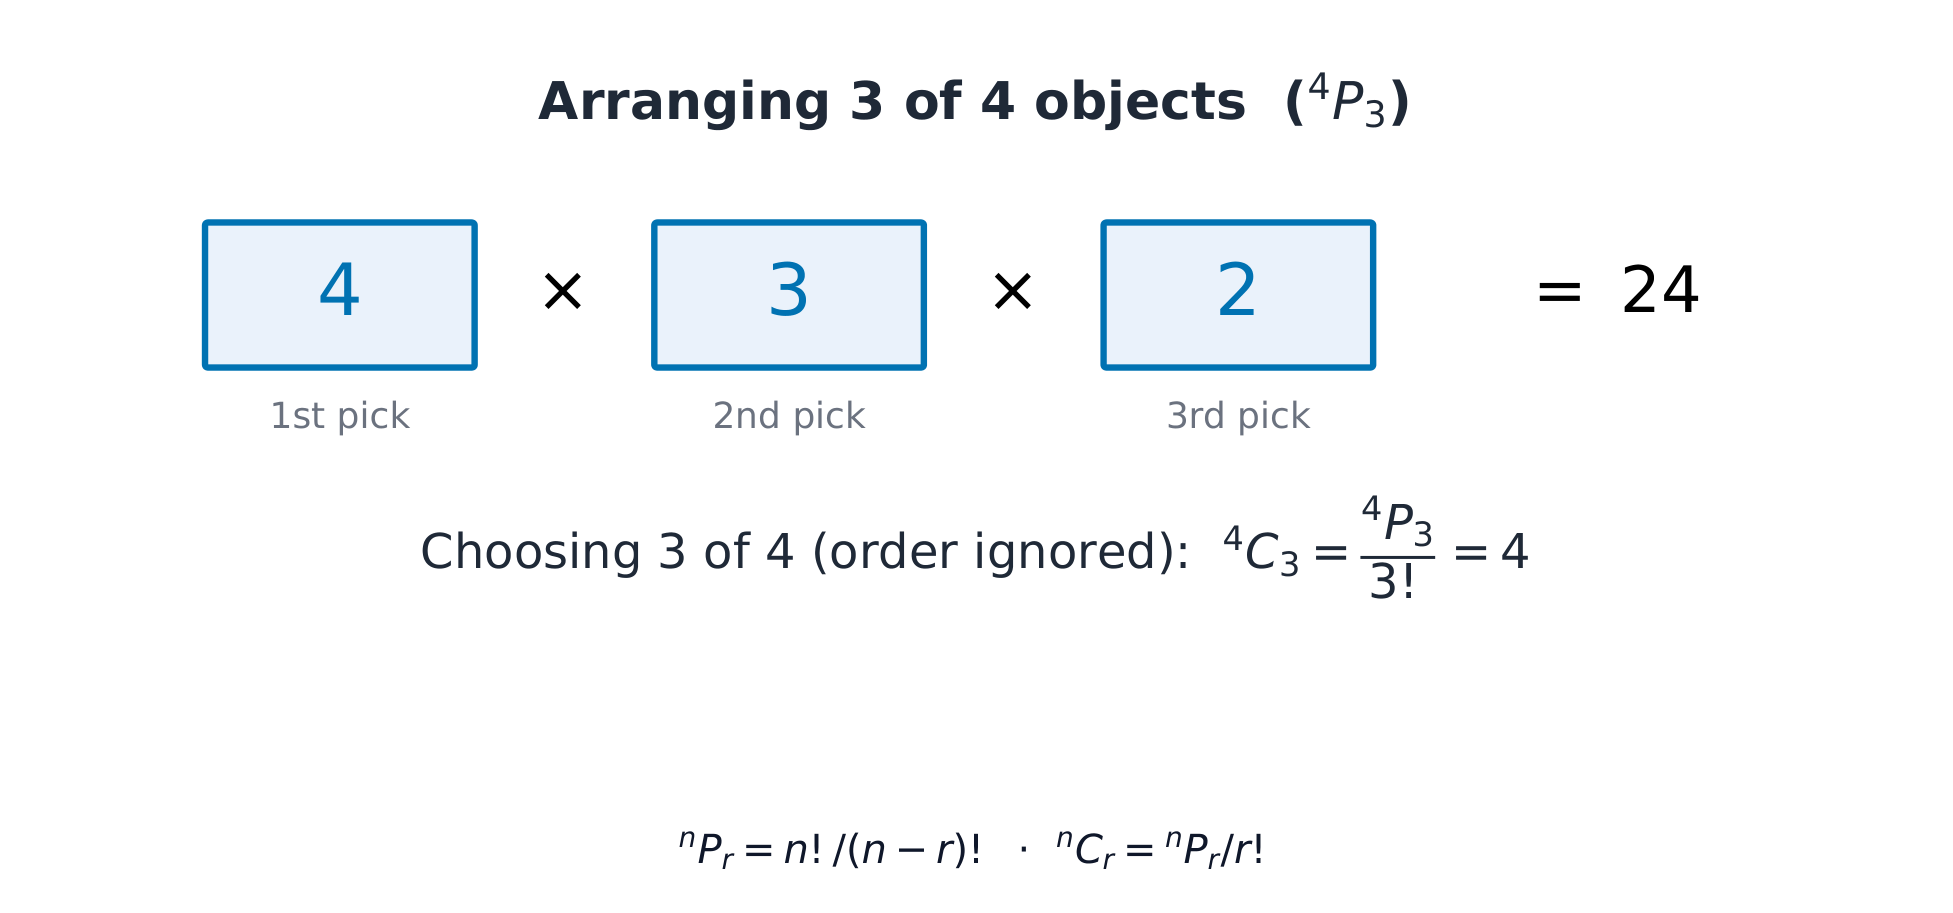
A permutation 排列 is an arrangement where order matters; a combination 组合 is a selection where order does not matter. The numbers are
$${}^nP_r = \frac{n!}{(n-r)!}, \qquad {}^nC_r = \binom{n}{r} = \frac{n!}{r!\,(n-r)!}.$$
To arrange objects in a line when some are repeated, divide by the factorial of each repeat count.
Worked example. How many different arrangements are there of the letters of the word NEEDLESS?
There are $8$ letters, with E repeated $3$ times and S repeated $2$ times:
$$\frac{8!}{3!\,2!} = \frac{40320}{6 \times 2} = 3360.$$
Worked example: together and apart. Seven friends, including Amy and Bo, stand in a row. In how many ways can they stand if (a) Amy and Bo are together, (b) Amy and Bo are not together?
(a) Tie Amy and Bo into one block. Now arrange $6$ items, $6! = 720$ ways, and the block itself can be AB or BA: $720 \times 2 = 1440$.
(b) Take the total minus the "together" cases: $7! - 1440 = 5040 - 1440 = 3600$.
Worked example: "at least one". A committee of $4$ is chosen from $5$ men and $4$ women. How many committees contain at least one woman?
Count the opposite case: committees with no women use only men, ${}^5C_4 = 5$ ways. All committees: ${}^9C_4 = 126$. So $126 - 5 = 121$.
Common mistakes. Using ${}^nP_r$ for a committee (order does not matter in a committee), and counting "at least one" case by case, which double-counts easily; the complement is safer.
Explore
Permutation or combination lab
Choose whether order matters in a counting problem.
Vocabulary
Train
| English |
|---|
| permutation/ˌpɜːmjuːˈteɪʃn/ |
| combination/ˌkɒmbɪˈneɪʃn/ |
5.3
Probability

Syllabus
| Candidates should be able to: | Notes and examples |
|---|---|
| evaluate probabilities in simple cases by means of enumeration of equiprobable elementary events, or by calculation using permutations or combinations | e.g. the total score when two fair dice are thrown. e.g. drawing balls at random from a bag containing balls of different colours. |
| use addition and multiplication of probabilities, as appropriate, in simple cases | Explicit use of the general formula $\text{P}(A \cup B) = \text{P}(A) + \text{P}(B) - \text{P}(A \cap B)$ is not required. |
| understand the meaning of exclusive and independent events, including determination of whether events $A$ and $B$ are independent by comparing the values of $\text{P}(A \cap B)$ and $\text{P}(A) \times \text{P}(B)$ | |
| calculate and use conditional probabilities in simple cases. | e.g. situations that can be represented by a sample space of equiprobable elementary events, or a tree diagram. The use of $\text{P}(A|B) = \frac{\text{P}(A \cap B)}{\text{P}(B)}$ may be required in simple cases. |
Source: Cambridge International syllabus
Find a probability by counting equally likely outcomes, or by using permutations and combinations. Combine probabilities with these rules:
- addition for "or": $P(A \cup B) = P(A) + P(B) - P(A \cap B)$;
- multiplication for "and" when events are independent: $P(A \cap B) = P(A)\,P(B)$.
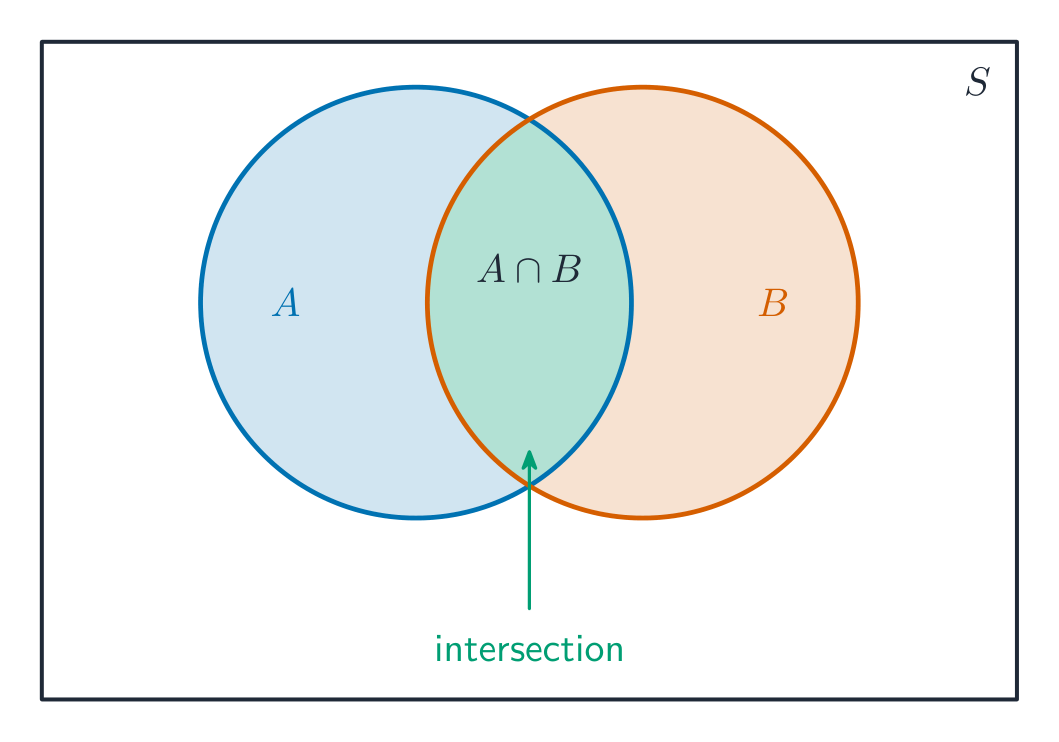
Two events are mutually exclusive events 互斥事件 if they cannot both happen, and independent events 独立事件 if one happening does not change the chance of the other. To test independence, check whether $P(A \cap B) = P(A)\times P(B)$. A conditional probability 条件概率 is the chance of $A$ given that $B$ has happened: $P(A \mid B) = \dfrac{P(A \cap B)}{P(B)}$, provided $P(B)>0$.
Worked example. Events have $P(A) = 0.5$, $P(B) = 0.4$ and $P(A \cap B) = 0.2$. Are $A$ and $B$ independent?
Test: $P(A)\times P(B) = 0.5 \times 0.4 = 0.2 = P(A \cap B)$. The values are equal, so $A$ and $B$ are independent.
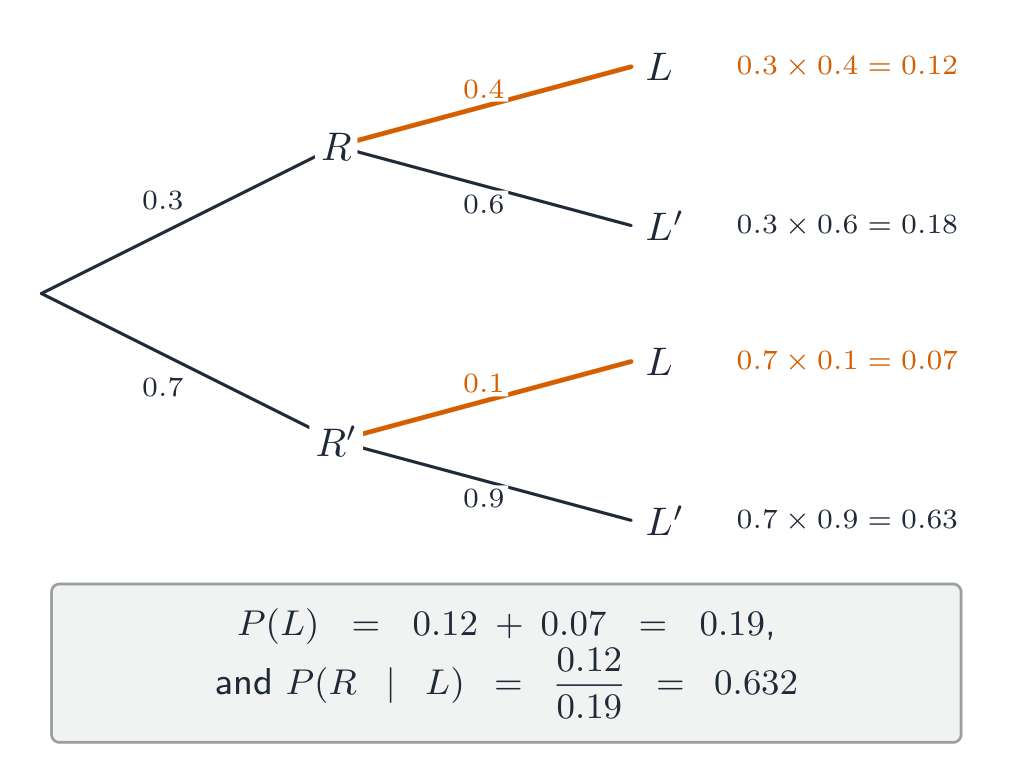
Worked example: a tree diagram. The probability that it rains on a given day is $0.3$. If it rains, the probability that Kim is late is $0.4$; if it does not rain, it is $0.1$. Find the probability that Kim is late, and the probability that it rained given that Kim was late.
Multiply along each branch that ends in "late", then add the branches:
$$P(L) = 0.3 \times 0.4 + 0.7 \times 0.1 = 0.12 + 0.07 = 0.19.$$
Given that Kim was late, only those two branches count:
$$P(R \mid L) = \frac{P(R \cap L)}{P(L)} = \frac{0.12}{0.19} = 0.632.$$
The common error is to answer $0.4$, which is $P(L \mid R)$, the other way round.
Explore
Conditional probability
Change the probabilities and read the tree. This is how P(A and B) and conditional probability fit together.
Vocabulary
Train
| English |
|---|
| mutually exclusive events/ˈmjuːtʃuːəli eksˈkluːsɪv ɪˈvents/ |
| independent events/ˌɪndɪˈpendənt ɪˈvents/ |
| conditional probability/kənˈdɪʃənl ˌprɒbəˈbɪlɪti/ |
5.4
Discrete random variables
Syllabus
| Candidates should be able to: | Notes and examples |
|---|---|
| draw up a probability distribution table relating to a given situation involving a discrete random variable $X$, and calculate $\text{E}(X)$ and $\text{Var}(X)$ | |
| use formulae for probabilities for the binomial and geometric distributions, and recognise practical situations where these distributions are suitable models | Including the notations $\text{B}(n, p)$ and $\text{Geo}(p)$. $\text{Geo}(p)$ denotes the distribution in which $p_r = p(1 - p)^{r-1}$ for $r = 1, 2, 3, \dots$. |
| use formulae for the expectation and variance of the binomial distribution and for the expectation of the geometric distribution. | Proofs of formulae are not required. |
Source: Cambridge International syllabus
A discrete random variable 离散型随机变量 $X$ takes separate values, each with a probability. List them in a probability distribution table 概率分布表; the probabilities must add to $1$. Then the expectation 期望 (mean) and variance are
$$E(X) = \sum x\,P(X = x), \qquad \mathrm{Var}(X) = \sum x^2\,P(X = x) - \big(E(X)\big)^2.$$
Two special models:
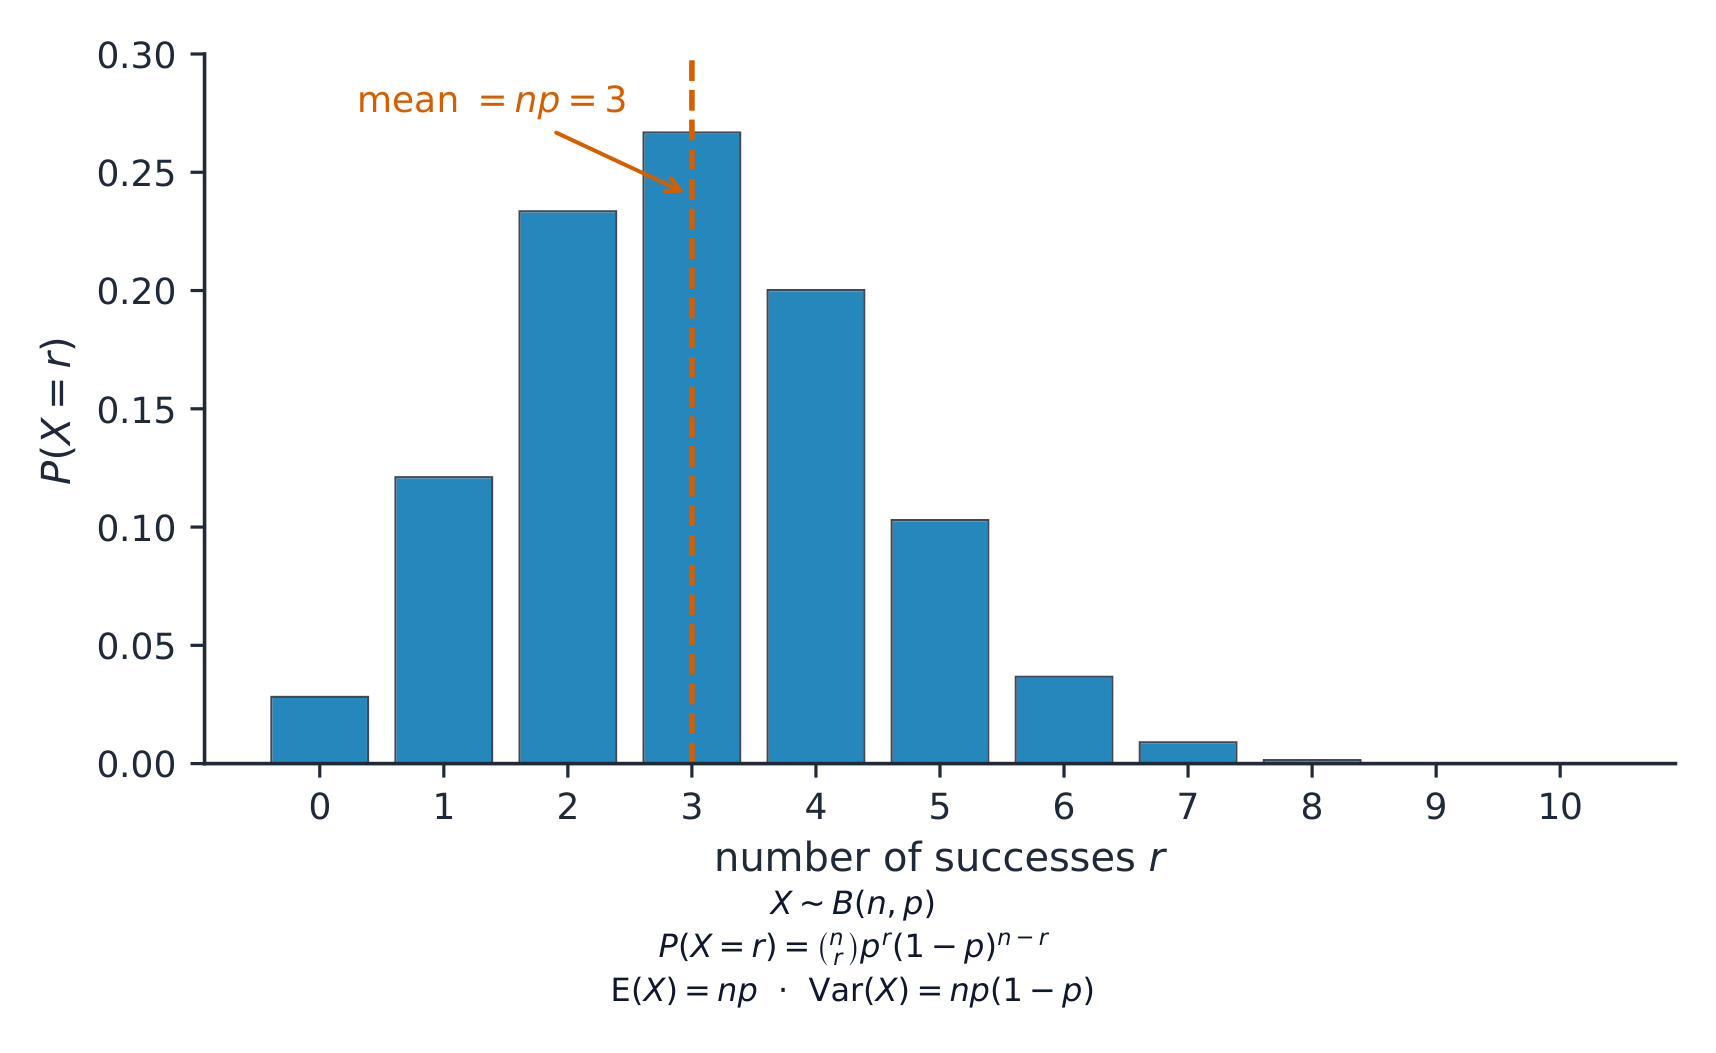
- the binomial distribution 二项分布 $X \sim B(n, p)$, for the number of successes in $n$ independent trials, each with the same success probability $p$: $P(X = r) = \binom{n}{r}p^r(1-p)^{n-r}$, with $E(X) = np$ and $\mathrm{Var}(X) = np(1-p)$;
- the geometric distribution 几何分布, for the trial on which the first success happens in independent trials with constant success probability $p$: $P(X = r) = (1-p)^{r-1}p$, with $E(X) = \dfrac{1}{p}$.
Worked example: a probability table. The variable $X$ has this distribution. Find $k$, $E(X)$ and $\mathrm{Var}(X)$.
| $x$ | $1$ | $2$ | $3$ | $4$ |
|---|---|---|---|---|
| $P(X = x)$ | $0.1$ | $0.3$ | $k$ | $0.2$ |
The probabilities add to $1$, so $k = 1 - 0.6 = 0.4$. Then
$$E(X) = 1(0.1) + 2(0.3) + 3(0.4) + 4(0.2) = 2.7,$$
$$E(X^2) = 1(0.1) + 4(0.3) + 9(0.4) + 16(0.2) = 8.1, \qquad \mathrm{Var}(X) = 8.1 - 2.7^2 = 0.81.$$
Remember to subtract $\big(E(X)\big)^2$: stopping at $8.1$ is a frequent slip.
Worked example. $X \sim B(10, 0.3)$. Find $P(X = 2)$ and $E(X)$.
$$P(X = 2) = \binom{10}{2}(0.3)^2(0.7)^8 = 45 \times 0.09 \times 0.05765 = 0.233, \qquad E(X) = 10 \times 0.3 = 3.$$
Worked example: geometric. A fair die is thrown until a six appears. Find the probability that the first six comes on the third throw, and that more than $4$ throws are needed.
$P(X = 3) = \left(\tfrac56\right)^2\tfrac16 = 0.116$. "More than $4$ throws" means the first four throws are all not six: $P(X > 4) = \left(\tfrac56\right)^4 = 0.482$.
Explore
A discrete distribution
Change n and p for a binomial distribution and watch the bars — the probability of each number of successes.
Vocabulary
Train
| English |
|---|
| discrete random variable/dɪˈskriːt ˈrændəm ˈveərɪəbl/ |
| probability distribution table/ˌprɒbəˈbɪlɪti ˌdɪstrɪˈbjuːʃn ˈteɪbl/ |
| expectation/ekspɪkˈteɪʃn/ |
| binomial distribution/baɪˈnəʊmɪəl ˌdɪstrɪˈbjuːʃn/ |
| geometric distribution/ˌdʒiːəʊˈmetrɪk ˌdɪstrɪˈbjuːʃn/ |
5.5
The normal distribution

Syllabus
| Candidates should be able to: | Notes and examples |
|---|---|
| understand the use of a normal distribution to model a continuous random variable, and use normal distribution tables | Sketches of normal curves to illustrate distributions or probabilities may be required. |
| solve problems concerning a variable $X$, where $X \sim N(\mu, \sigma^2)$, including: – finding the value of $P(X > x_1)$, or a related probability, given the values of $x_1$, $\mu$, $\sigma$. – finding a relationship between $x_1$, $\mu$ and $\sigma$ given the value of $P(X > x_1)$ or a related probability | For calculations involving standardisation, full details of the working should be shown. e.g. $Z = \frac{(X - \mu)}{\sigma}$ |
| recall conditions under which the normal distribution can be used as an approximation to the binomial distribution, and use this approximation, with a continuity correction, in solving problems. | $n$ sufficiently large to ensure that both $np > 5$ and $nq > 5$. |
Source: Cambridge International syllabus
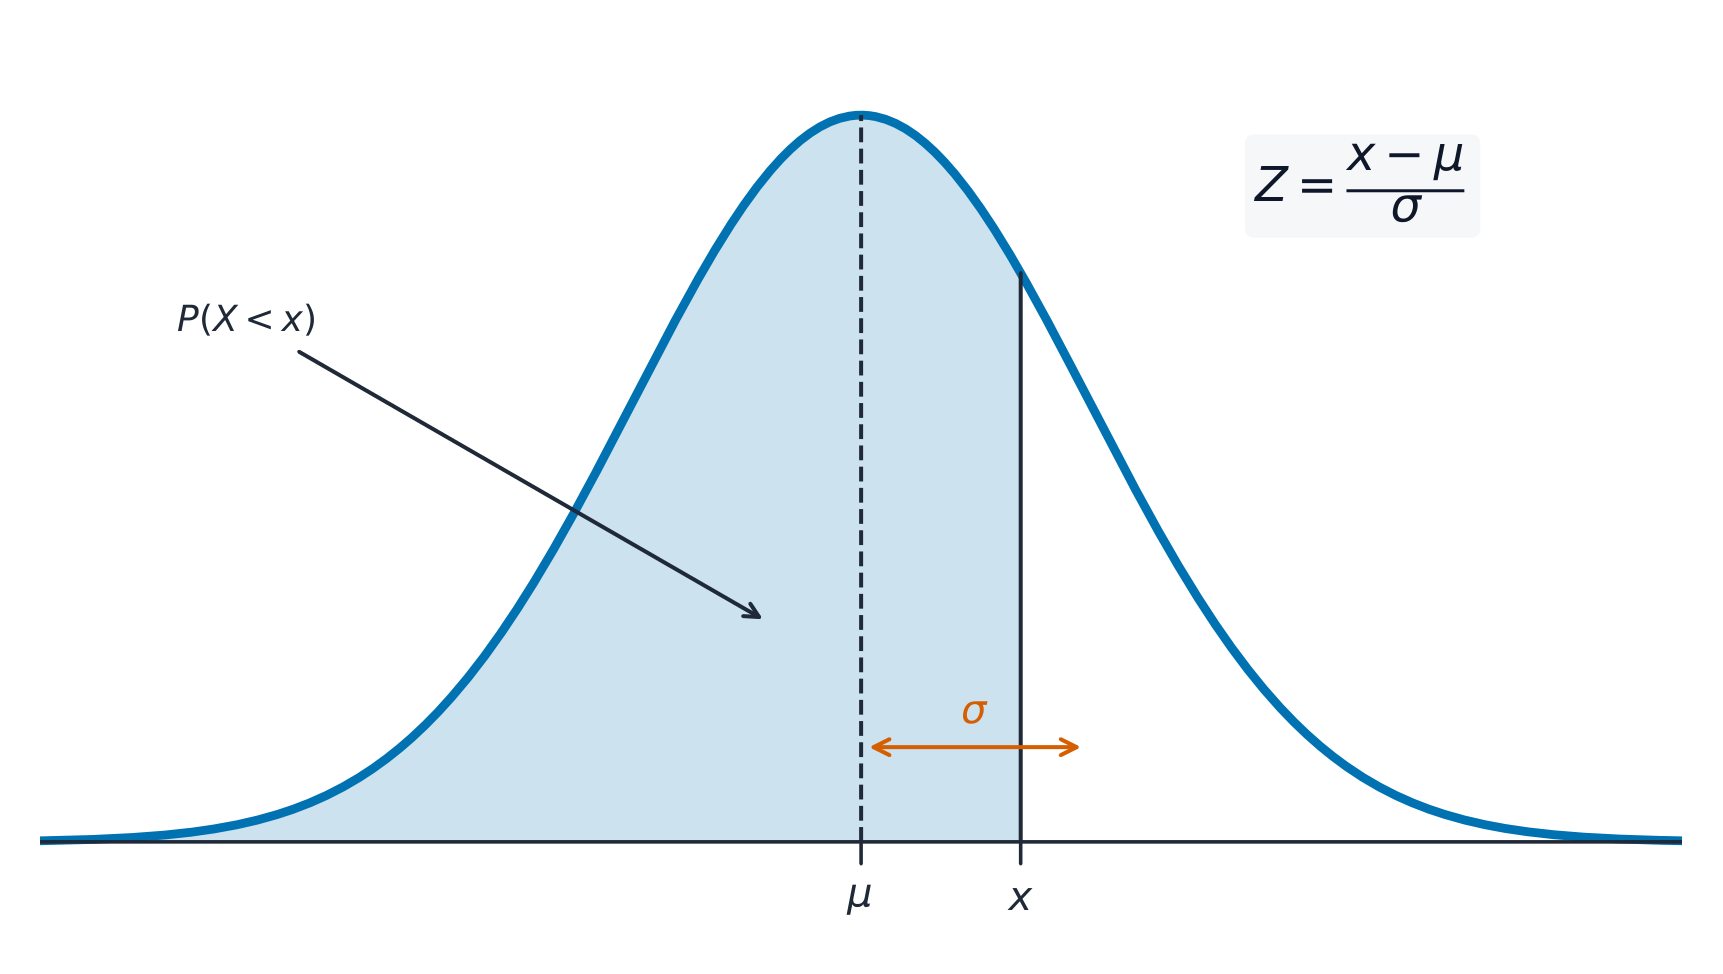
The normal distribution 正态分布 models a continuous random variable 连续型随机变量 with a symmetric bell shape. Write $X \sim N(\mu, \sigma^2)$, where $\mu$ is the mean and $\sigma$ is the standard deviation. To use the tables, by standardisation 标准化 convert to the variable $Z \sim N(0, 1)$:
$$Z = \frac{X - \mu}{\sigma}.$$
Then $P(X < x) = P\!\left(Z < \dfrac{x - \mu}{\sigma}\right)$, which you read from the normal table $\Phi$.
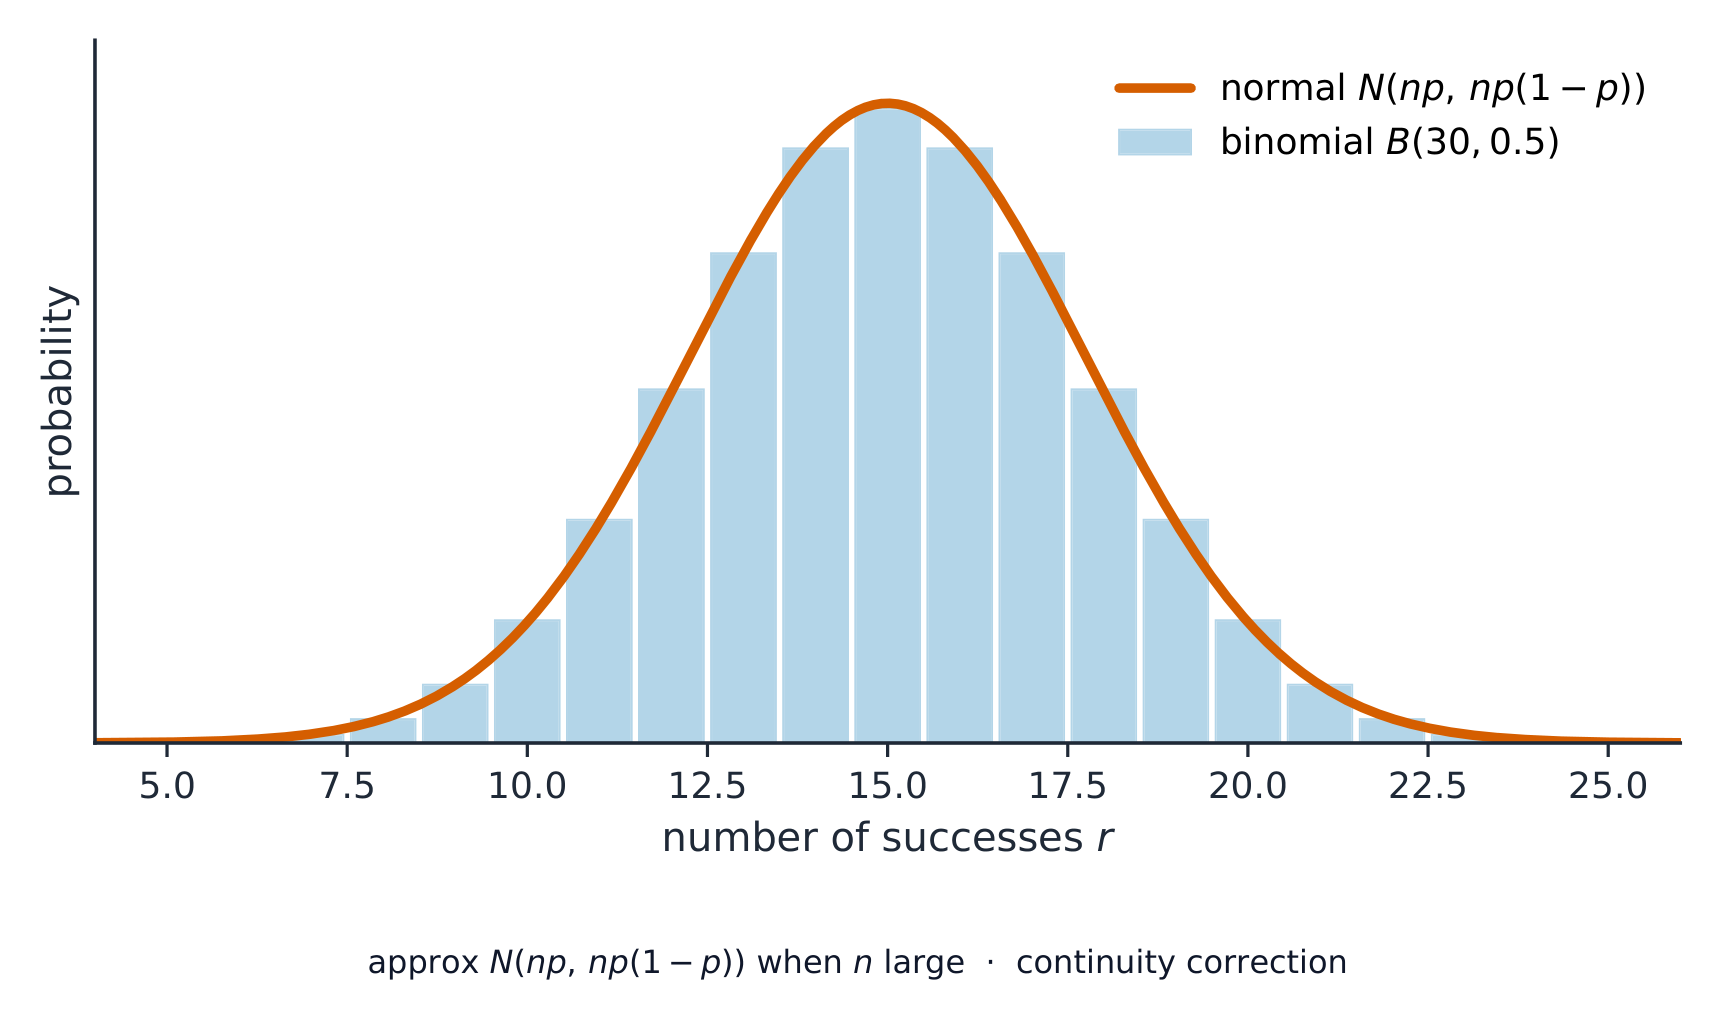
The normal distribution is also a good approximation 近似 to the binomial when both $np$ and $n(1-p)$ are sufficiently large. Because you replace a discrete variable by a continuous one, apply a continuity correction 连续性校正 (adjust by $0.5$).
Worked example. Bags of rice have mass $X \sim N(\mu, 0.14^2)$. Given that $P(X < 1.48) = 0.22$, find $\mu$.
From the table, $P(Z < z) = 0.22$ gives $z = -0.772$. So
$$\frac{1.48 - \mu}{0.14} = -0.772 \;\Rightarrow\; \mu = 1.48 + 0.772 \times 0.14 = 1.59\ \text{kg (3 s.f.)}.$$
Worked example: approximating a binomial. $40\%$ of a town's residents cycle to work. In a random sample of $100$ residents, find the probability that at least $45$ cycle to work.
$X \sim B(100, 0.4)$. Here $np = 40$ and $n(1-p) = 60$ are both more than $5$, so use $N(np, np(1-p)) = N(40, 24)$. "At least $45$" includes $45$, so the continuity correction starts at $44.5$:
$$P(X \geqslant 45) \approx P\left(Z > \frac{44.5 - 40}{\sqrt{24}}\right) = P(Z > 0.919) = 1 - 0.821 = 0.179.$$
For the boundary, picture the bar for $45$: it runs from $44.5$ to $45.5$, and "at least $45$" keeps the whole bar. So $P(X > 45)$ would start at $45.5$, and $P(X \leqslant 45)$ would end at $45.5$.
Explore
From a raw value to a normal-model area
$z=(x-\mu)/\sigma$
Connect the lesson’s raw values to standardised bounds and the correct shaded region. Changing a model does not show that real data follow it.
Vocabulary
Train
| English |
|---|
| normal distribution/ˈnɔːml ˌdɪstrɪˈbjuːʃn/ |
| continuous random variable/kənˈtɪnjuːəs ˈrændəm ˈveərɪəbl/ |
| standardisation/ˌstændədaɪˈzeɪʃn/ |
| approximation/əˌprɒksɪˈmeɪʃn/ |
| continuity correction/kɒntɪˈnjuːɪti kəˈrekʃn/ |
| Probability & Statistics/ˌprɒbəˈbɪlɪti ænd stəˈtɪstɪks/ |
5.5
Exam tips
- Decide whether order matters: permutations ($^nP_r$) when it does, combinations ($^nC_r$) when it does not.
- For a discrete random variable, check the probabilities sum to $1$ and use $E(X) = \sum x\,P(X=x)$.
- For the normal distribution, standardise with $z = (x - \mu)/\sigma$, sketch and shade, then read the table.
- Apply a continuity correction when approximating a discrete variable by the normal.
Interactive lessons on this topic
Work through it step by step, with instant-check exercises.