Skip to content · ⁨ข้ามไปยังเนื้อหา⁩
Subjects · ⁨รายวิชา⁩

AP Microeconomics · ⁨AP เศรษฐศาสตร์จุลภาค⁩

Tips · ⁨เคล็ดลับ⁩

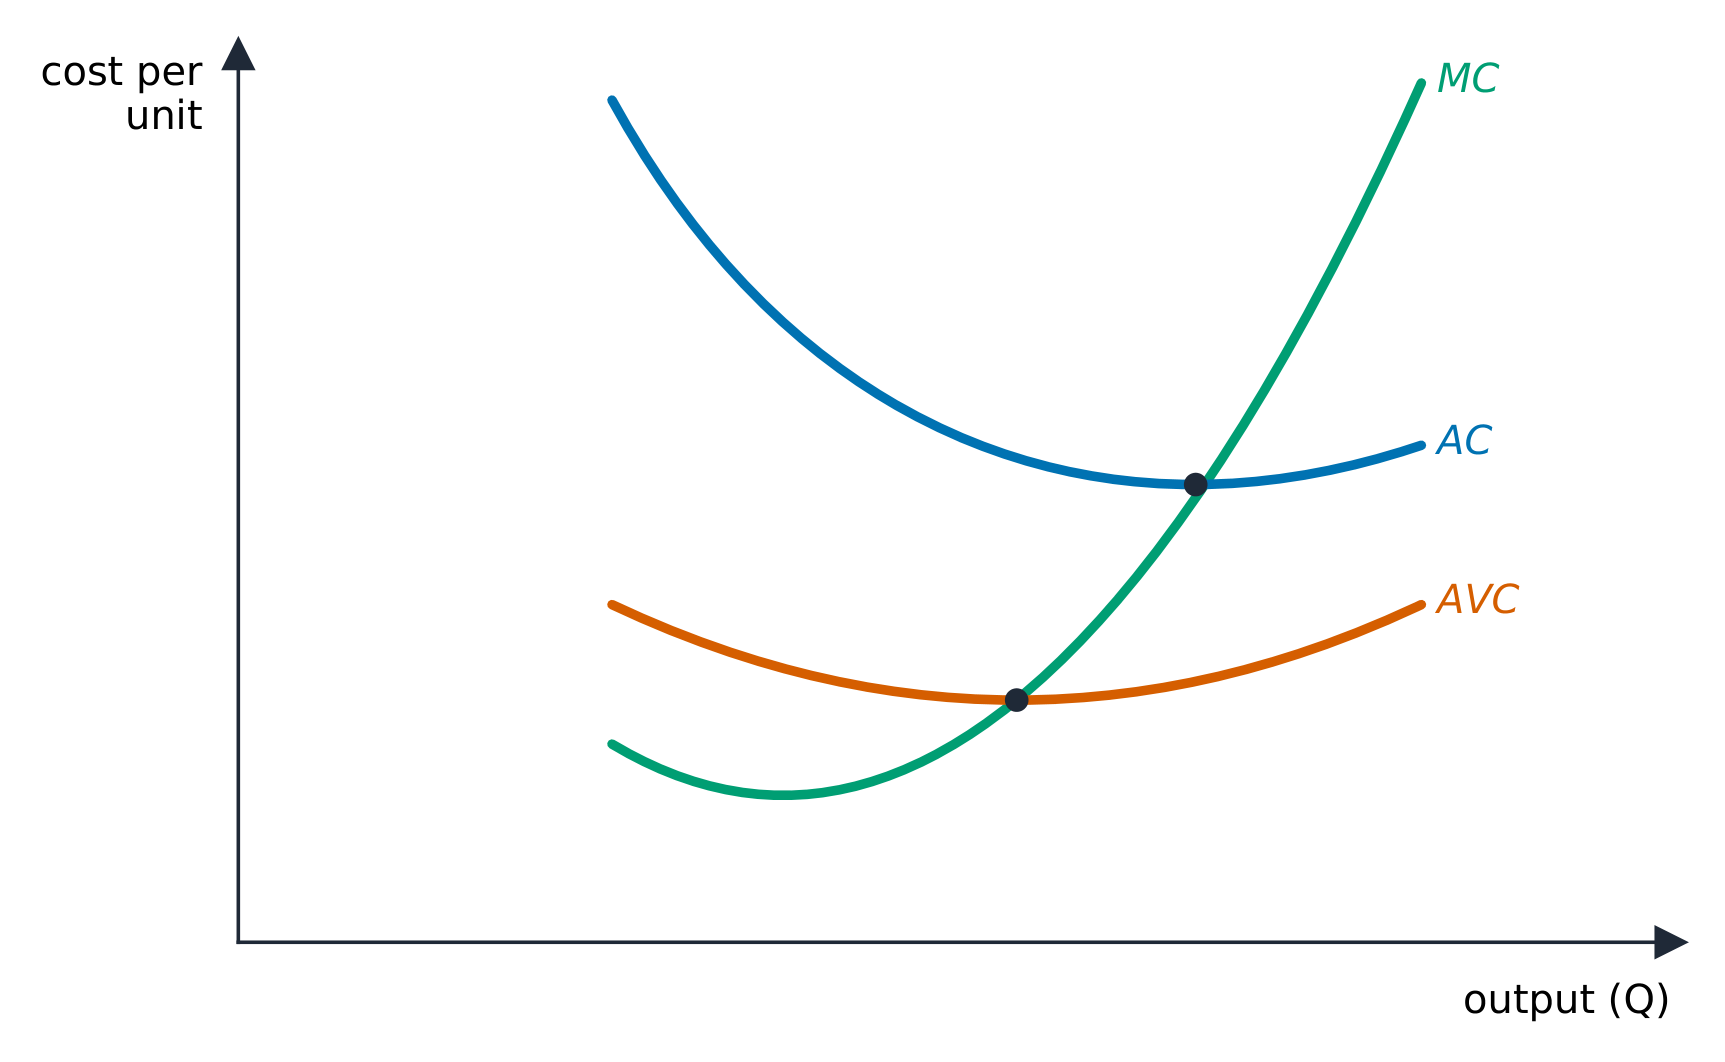
เศรษฐศาสตร์จุลภาค AP ครอบคลุม ความขาดแคลนและต้นทุนโอกาส, อุปทานและอุปสงค์, ความยืดหยุ่น, การผลิตและต้นทุน, โครงสร้างตลาดสี่ประเภท, ตลาดปัจจัยการผลิต และ ความล้มเหลวของตลาดด้วยการแทรกแซงจากรัฐบาล เป็นหลักสูตรเล็กแต่ศึกษาอย่างลึกซึ้ง

กราฟคือคำตอบ คะแนน的大部分 pour pour pour pour pour pour pour pour pour pour pour pour pour pour pour pour pour pour pour pour pour pour pour pour pour pour pour pour pour pour pour pour pour pour pour pour pour pour pour pour pour pour pour pour pour pour pour pour pour pour pour pour pour pour pour pour pour pour pour pour pour pour pour pour pour pour pour pour pour pour pour pour pour pour pour pour pour pour pour pour pour pour pour pour pour pour pour pour pour pour pour pour pour pour pour pour pour for a correctly labelled diagram — axes named, curves labelled, the new equilibrium marked and the direction of the shift shown. A written explanation of a shift you did not draw earns very little.

ฝึกวาดด้วยมือให้เร็วและถูกต้อง โดยเฉพาะ เส้นต้นทุน และ การแข่งขันสมบูรณ์เทียบกับผูกขาด ซึ่งปรากฏบ่อยครั้ง

หมายเหตุครอบคลุมทั้งหกหน่วยโดยวาดเส้นต้นทุนและแผนภาพตลาดแทนการอธิบาย FRQ从前 with scoring guidelines are in the library. Micro's marks frequently go to showing the shift and its consequence, so the worked answers keep the graph at the centre.

  • 1

    Basic Economic Concepts · ⁨แนวคิดพื้นฐานทางเศรษฐศาสตร์⁩

    Watch lesson · ⁨ดูบทเรียน⁩
    1.1

    Scarcity · ⁨ความขาดแคลน⁩

    Syllabus · ⁨หลักสูตร⁩
    English

    Enduring Understanding (MKT-1): Most resources are scarce, and in most cases the use of resources involves constraints and trade-offs.

    Learning Objective MKT-1.A: Define resources and the cause(s) of their scarcity.

    • MKT-1.A.1 Economic trade-offs arise from the lack of sufficient resources (scarcity) to meet society's wants and needs.
    • MKT-1.A.2 Most factors of production (such as land, labor, and capital) are scarce, but some factors of production (such as established knowledge) may not be scarce due to their non-rival nature.
    ไทย

    ความเข้าใจที่ยั่งยืน (MKT-1): ทรัพยากรส่วนใหญ่มีอยู่จำกัด และในกรณีส่วนใหญ่การใช้ทรัพยากรมีข้อจำกัดและต้องมีการแลกเปลี่ยนทางเลือก

    วัตถุประสงค์การเรียนรู้ MKT-1.A: นิยามทรัพยากรและสาเหตุของความหายากของทรัพยากร

    • MKT-1.A.1 การแลกเปลี่ยนทางเลือกทางเศรษฐกิจเกิดขึ้นจากความไม่เพียงพอของทรัพยากร (ความหายาก) เพื่อตอบสนองความต้องการและความต้องการของสังคม
    • MKT-1.A.2 ปัจจัยการผลิตส่วนใหญ่ (เช่น ที่ดิน แรงงาน และทุน) มีอยู่จำกัด แต่บางปัจจัยการผลิต (เช่น ความรู้ established) อาจไม่มีความหายากเนื่องจากลักษณะ non-rival ของมัน
    Source: College Board AP Course and Exam Description · ⁨แหล่งที่มา: คำอธิบายหลักสูตรและข้อสอบ College Board AP⁩

    English

    Economics 经济学 begins with one stubborn fact: people's wants are effectively unlimited, but the resources 资源 to satisfy them are limited. This gap is scarcity 稀缺性, and it is why economics exists – if everything were free and endless, there would be nothing to decide.

    The resources (the factors of production 生产要素) are land (natural resources), labor 劳动 (human effort), capital 资本 (tools, machines, buildings), and entrepreneurship 企业家才能 (organizing the other three and taking risks). Because these are scarce, every economy must answer three questions: what to produce, how to produce it, and for whom to produce.

    Scarcity forces choice, and every choice has an opportunity cost 机会成本 – the value of the next-best alternative you give up. This single idea runs through the whole course: the true cost of anything is what you sacrifice to get it, not just the money you pay.

    ไทย
    ตลาดกลางแจ้ง: ตลาดจัดสรรทรัพยากรที่มีอยู่จำกัดให้กับการใช้งานที่แข่งขันกัน
    ตลาดกลางแจ้ง: ตลาดจัดสรรทรัพยากรที่มีอยู่จำกัดให้กับการใช้งานที่แข่งขันกัน

    เศรษฐศาสตร์ เริ่มต้นด้วยความจริงที่ดื้อรั้นอันหนึ่ง: ความต้องการของมนุษย์มีไม่สิ้นสุด แต่ ทรัพยากร เพื่อตอบสนองความต้องการเหล่านั้นมีจำกัด ช่องว่างนี้คือ ความขาดแคลน (scarcity) และนี่คือเหตุผลที่เศรษฐศาสตร์มีอยู่ – หากทุกอย่างฟรีและไม่限量 ไม่มีอะไรต้องตัดสินใจเลย

    ทรัพยากร (ปัจจัยการผลิต) ได้แก่ ที่ดิน (ทรัพยากรธรรมชาติ), แรงงาน (แรงคน), ทุน (เครื่องมือ เครื่องจักร อาคาร) และ ** entrepreneurship** (การจัดระเบียบสามอย่างอื่นและความเสี่ยง) เนื่องจากสิ่งเหล่านี้มีอยู่จำกัด ทุกเศรษฐกิจต้องตอบคำถามสามข้อ: อะไร ผลิต, อย่างไร ผลิต, และ 为谁 ผลิต

    ความขาดแคลนบังคับให้ต้อง เลือก และทุกการเลือกมี ค่าโอกาส – คือมูลค่าของทางเลือกที่ดีที่สุดในบรรดาทางเลือกที่เหลือที่คุณสละไป แนวคิดเดียวนี้贯穿ทั้งหลักสูตร: ค่าที่แท้จริงของสิ่งใดสิ่งหนึ่งคือสิ่งที่คุณเสียสละเพื่อได้มันมา ไม่ใช่เพียงเงินที่คุณจ่าย

    Vocabulary · ⁨คำศัพท์⁩ Train · ⁨ฝึกฝน⁩
    English ไทย
    Economics/ˌiːkəˈnɒmɪks/ เศรษฐศาสตร์
    resources/rɪˈzɔːsɪz/ ทรัพยากร
    scarcity/ˈskeəsɪti/ ความขาดแคลน
    factors of production/ˈfæktəz ɒv prəˈdʌkʃn/ ปัจจัยการผลิต
    labor/ˈleɪbə/ แรงงาน
    capital/ˈkæpɪtl/ ทุน (capital)
    entrepreneurship/ˌɒntrɪprəˈnjʊəʃɪp/ entrepreneurship
    opportunity cost/ɒpəˈtjuːnɪti kɒst/ ต้นทุนโอกาส
    1.2

    Resource Allocation and Economic Systems · ⁨การจัดสรรทรัพยากรและระบบเศรษฐกิจ⁩

    Syllabus · ⁨หลักสูตร⁩
    English

    Enduring Understanding (MKT-1): Most resources are scarce, and in most cases the use of resources involves constraints and trade-offs.

    Learning Objective MKT-1.B: Define how resource allocation is influenced by the economic system adopted by society.

    • MKT-1.B.1 Resource allocation involves answering three basic questions: What goods and services to produce? How to produce those goods and services? And who consumes those goods and services?
    • MKT-1.B.2 Resource allocation is significantly influenced by the economic system adopted by society, such as command economy, market economy, or mixed economy. Each system involves a particular set of institutional arrangements and a coordinating mechanism for allocating scarce resources and distributing output.
    ไทย

    ความเข้าใจที่ยั่งยืน (MKT-1): ทรัพยากรส่วนใหญ่มีอยู่จำกัด และในกรณีส่วนใหญ่การใช้ทรัพยากรมีข้อจำกัดและต้องมีการแลกเปลี่ยนทางเลือก

    วัตถุประสงค์การเรียนรู้ MKT-1.B: นิยามการจัดสรรทรัพยากรได้รับอิทธิพลจากระบบเศรษฐกิจที่สังคมเลือกใช้อย่างไร

    • MKT-1.B.1 การจัดสรรทรัพยากรเกี่ยวข้องกับการตอบคำถามพื้นฐานสามข้อ: ผลิตสินค้าและบริการอะไร? ผลิตสินค้าและบริการเหล่านั้นอย่างไร? และใครเป็นผู้บริโภคสินค้าและบริการเหล่านี้?
    • MKT-1.B.2 การจัดสรรทรัพยากรได้รับอิทธิพลอย่างมากจากระบบเศรษฐกิจที่สังคมเลือกใช้ เช่น ระบบเศรษฐกิจแบบสั่งการ ระบบเศรษฐกิจตลาด หรือระบบเศรษฐกิจผสม แต่ละระบบมีชุดการจัดตั้งสถาบันและกลไกการประสานงานเฉพาะสำหรับจัดสรรทรัพยากรที่มีอยู่จำกัดและกระจายผลผลิต

    Source: College Board AP Course and Exam Description · ⁨แหล่งที่มา: คำอธิบายหลักสูตรและข้อสอบ College Board AP⁩

    English

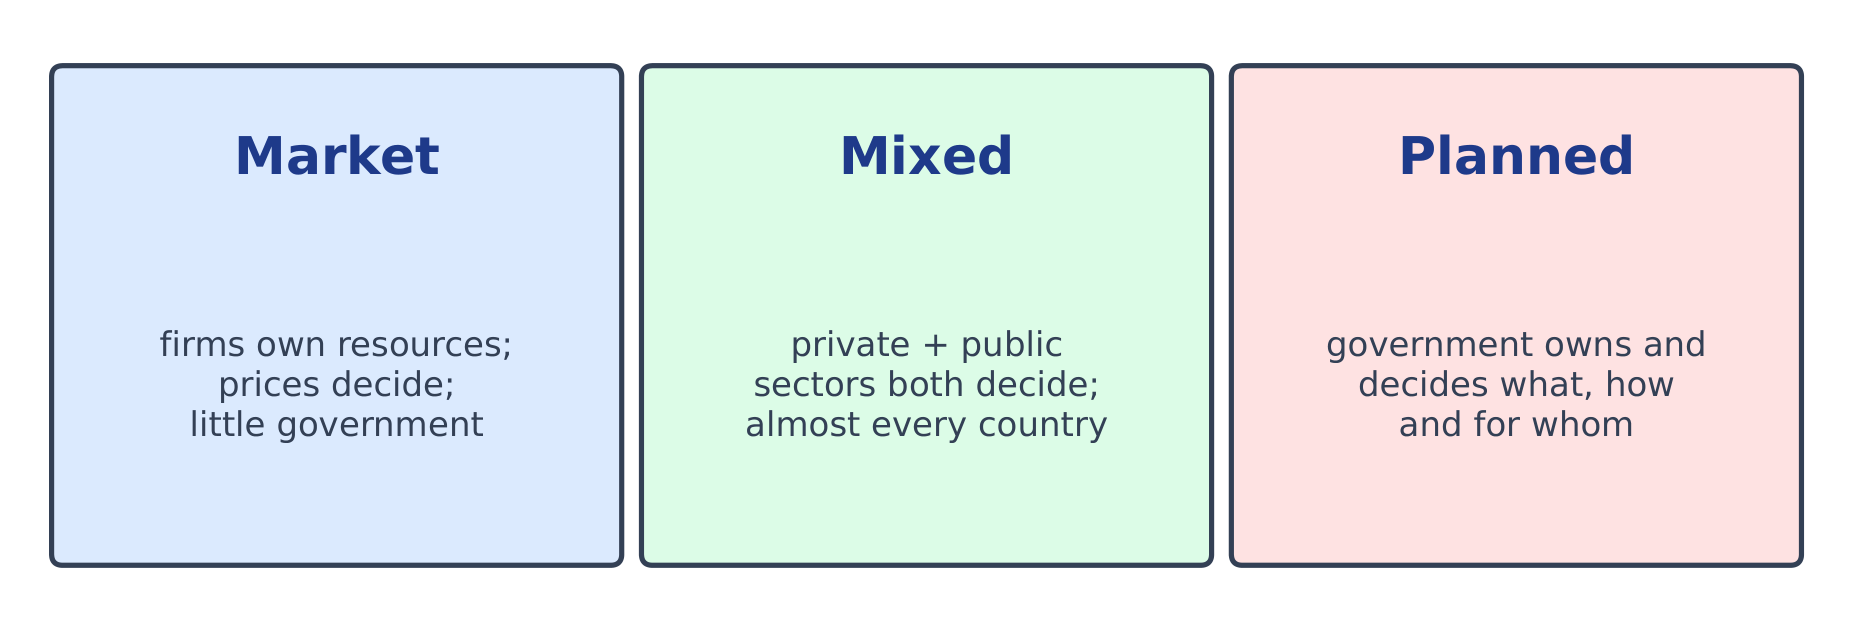
    An economic system 经济体制 is a society's way of answering the three questions.

    • In a market economy 市场经济, private buyers and sellers decide through prices; self-interest and competition coordinate them (the "invisible hand").
    • In a command economy 计划经济, the government owns resources and plans production.
    • Real economies are mixed 混合经济 – mostly markets, with government providing some goods and correcting problems.

    The key advantage of markets is that prices carry information and incentives 激励 automatically, with no central planner needed.

    ไทย

    ระบบเศรษฐกิจ คือวิธีที่สังคมตอบคำถามสามข้อ

    ระบบเศรษฐกิจเป็นสเปกตรัมตั้งแต่ตลาดเสรีไปจนถึงการวางแผนของรัฐบาลเต็มรูปแบบ
    ระบบเศรษฐกิจสร้างสเปกตรัมตั้งแต่ตลาดเสรีไปจนถึงการวางแผนโดยรัฐบาลเต็มรูปแบบ
    • ใน เศรษฐกิจตลาด ผู้ซื้อและผู้ขายภาคเอกชนตัดสินใจผ่านราคา; ความสนใจส่วนตัวและการแข่งขันประสานงานกัน (มืออันล่องหน)
    • ใน เศรษฐกิจแบบวางแผนกลาง รัฐบาลเป็นเจ้าของทรัพยากรและวางแผนการผลิต
    • เศรษฐกิจจริงเป็น ระบบผสม – ส่วนใหญ่เป็นตลาด โดยรัฐบาลจัดหาสินค้าบางชนิดและแก้ไขปัญหา

    ข้อดีหลักของตลาดคือ ราคาส่งข้อมูลและ แรงจูงใจ อัตโนมัติ โดยไม่ต้องใช้ผู้วางแผนส่วนกลาง

    Explore · ⁨สำรวจ⁩

    Explore how prices coordinate a market · ⁨สำรวจว่าราคาประสานงานตลาดอย่างไร⁩

    In a market economy no one is in charge, yet the price finds the level where quantity supplied meets quantity demanded. Drag the demand and supply lines and watch the equilibrium price act as a signal and an incentive. · ⁨ในเศรษฐกิจแบบตลาดไม่มีใครเป็นผู้ควบคุม แต่ราคาคือสิ่งที่หาจุดที่อุปทานเท่ากับอุปสงค์ได้ ลากเส้น อุปสงค์ และ อุปทาน แล้วดูว่าราคาสมดุลทำหน้าที่เป็น สัญญาณ และ แรงจูงใจ อย่างไร⁩

    Vocabulary · ⁨คำศัพท์⁩ Train · ⁨ฝึกฝน⁩
    English ไทย
    economic system/ˌiːkəˈnɒmɪk ˈsɪstəm/ ระบบเศรษฐกิจ
    market economy/ˈmɑːkɪt ɪˈkɒnəmi/ ระบบเศรษฐกิจตลาด
    command economy/kəˈmænd ɪˈkɒnəmi/ ระบบเศรษฐกิจแบบบังคับใช้แผนกลาง
    mixed/mɪkst/ ผสม
    incentives/ɪnˈsentɪvz/ แรงจูงใจ
    production possibilities curve (PPC)/prəˈdʌkʃn ˌpɒsəˈbɪlɪtiz kɜːv/ เส้นโค้งความเป็นไปได้ในการผลิต (PPC)
    efficient/ɪˈfɪʃənt/ มีประสิทธิภาพ
    unattainable/ʌnəˈteɪnəbl/ ไม่สามารถบรรลุได้
    Economic growth/ˌiːkəˈnɒmɪk ɡrəʊθ/ การเติบโตทางเศรษฐกิจ
    specializing/ˈspeʃəlaɪzɪŋ/ การเชี่ยวชาญในสิ่งที่ทำ
    absolute advantage/ˈæbsəluːt ədˈvæntɪdʒ/ ข้อได้เปรียบสัมบูรณ์
    1.3

    The Production Possibilities Curve · ⁨เส้นโค้งความเป็นไปได้ในการผลิต⁩

    Syllabus · ⁨หลักสูตร⁩
    English

    Enduring Understanding (MKT-1): Most resources are scarce, and in most cases the use of resources involves constraints and trade-offs.

    Learning Objective MKT-1.C: a. Define (using graphs as appropriate) the production possibilities curve (PPC) and related terms. b. Explain (using graphs as appropriate) how the production possibilities curve (PPC) illustrates opportunity costs, trade-offs, inefficiency, efficiency, and economic growth or contraction under various conditions. c. Calculate (using data from PPCs or tables as appropriate) opportunity cost.

    • MKT-1.C.1 The PPC is a model used to show the trade-offs associated with allocating resources.
    • MKT-1.C.2 The PPC can be used to illustrate the concepts of scarcity, opportunity cost, efficiency, underutilized resources, and economic growth or contraction.
    • MKT-1.C.3 The shape of the PPC depends on whether opportunity costs are constant, increasing, or decreasing.
    • MKT-1.C.4 The PPC can shift due to changes in factors of production as well as changes in productivity/technology.
    • MKT-1.C.5 Economic growth results in an outward shift of the PPC.
    ไทย

    ความเข้าใจที่ยั่งยืน (MKT-1): ทรัพยากรส่วนใหญ่มีอยู่จำกัด และในกรณีส่วนใหญ่การใช้ทรัพยากรมีข้อจำกัดและต้องมีการแลกเปลี่ยนทางเลือก

    จุดประสงค์การเรียนรู้ MKT-1.C: ก. นิยาม (โดยใช้กราฟเมื่อเหมาะสม) เส้นโค้งความสามารถในการผลิต (PPC) และศัพท์ที่เกี่ยวข้อง ข. อธิบาย (โดยใช้กราฟเมื่อเหมาะสม) ว่าเส้นโค้งความสามารถในการผลิต (PPC) แสดงถึงต้นทุนโอกาส ความขัดแย้ง การขาดประสิทธิภาพ ประสิทธิภาพ และการเติบโตหรือหดตัวของเศรษฐกิจภายใต้สภาวะต่างๆ ได้อย่างไร ค. คำนวณ (โดยใช้ข้อมูลจาก PPC หรือตารางเมื่อเหมาะสม) ค่าโอกาสเสีย

    • MKT-1.C.1 PPC เป็นโมเดลที่ใช้แสดงความขัดแย้งที่เกี่ยวข้องกับการจัดสรรทรัพยากร
    • MKT-1.C.2 PPC สามารถใช้แสดงแนวคิดเรื่องความจำกัด ต้นทุนโอกาส ประสิทธิภาพ การใช้ทรัพยากรไม่เต็มประสิทธิภาพ และการเติบโตหรือหดตัวของเศรษฐกิจ
    • MKT-1.C.3 รูปร่างของ PPC ขึ้นอยู่กับว่าต้นทุนโอกาสจะคงที่ เพิ่มขึ้น หรือลดลง
    • MKT-1.C.4 PPC สามารถshiftได้จากการเปลี่ยนแปลงในfactors of production以及changes in productivity/technology.
    • MKT-1.C.5 การเติบโตทางเศรษฐกิจส่งผลให้ PPC เคลื่อนที่ออกด้านนอก

    Source: College Board AP Course and Exam Description · ⁨แหล่งที่มา: คำอธิบายหลักสูตรและข้อสอบ College Board AP⁩

    English
    The production possibility frontier

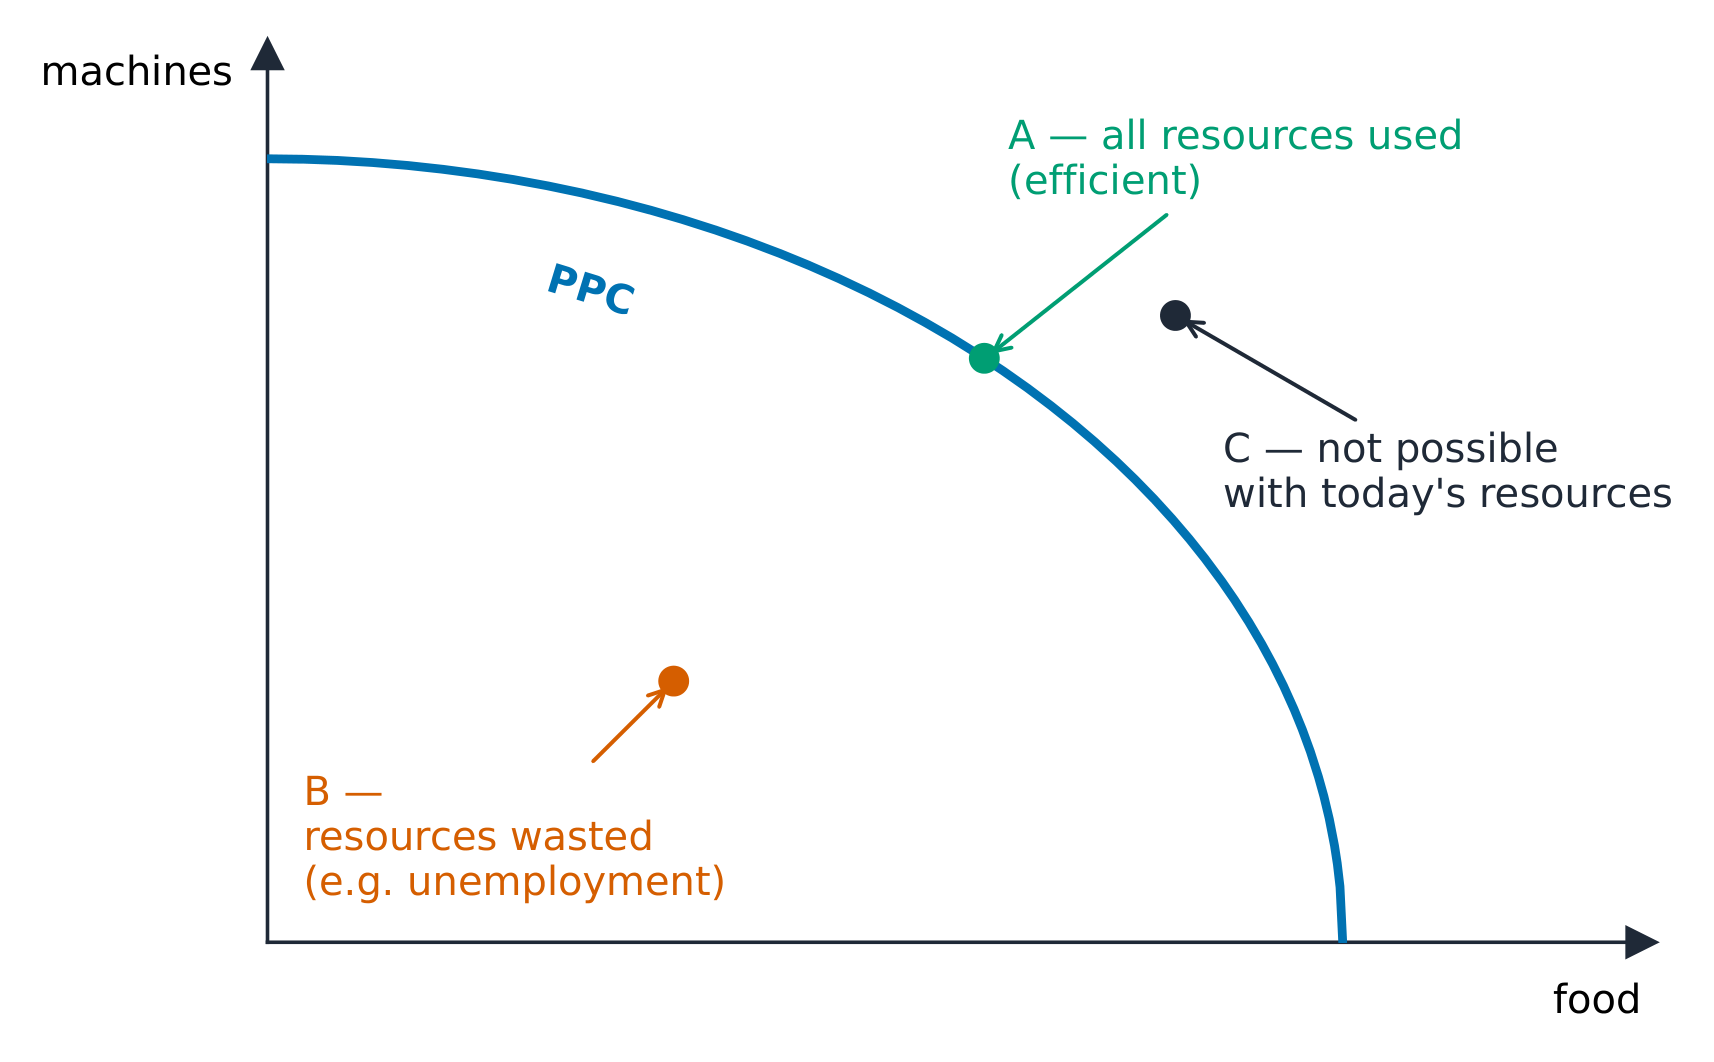
    The production possibilities curve (PPC) 生产可能性曲线 shows the maximum combinations of two goods an economy can produce with its resources and technology fully and efficiently used.

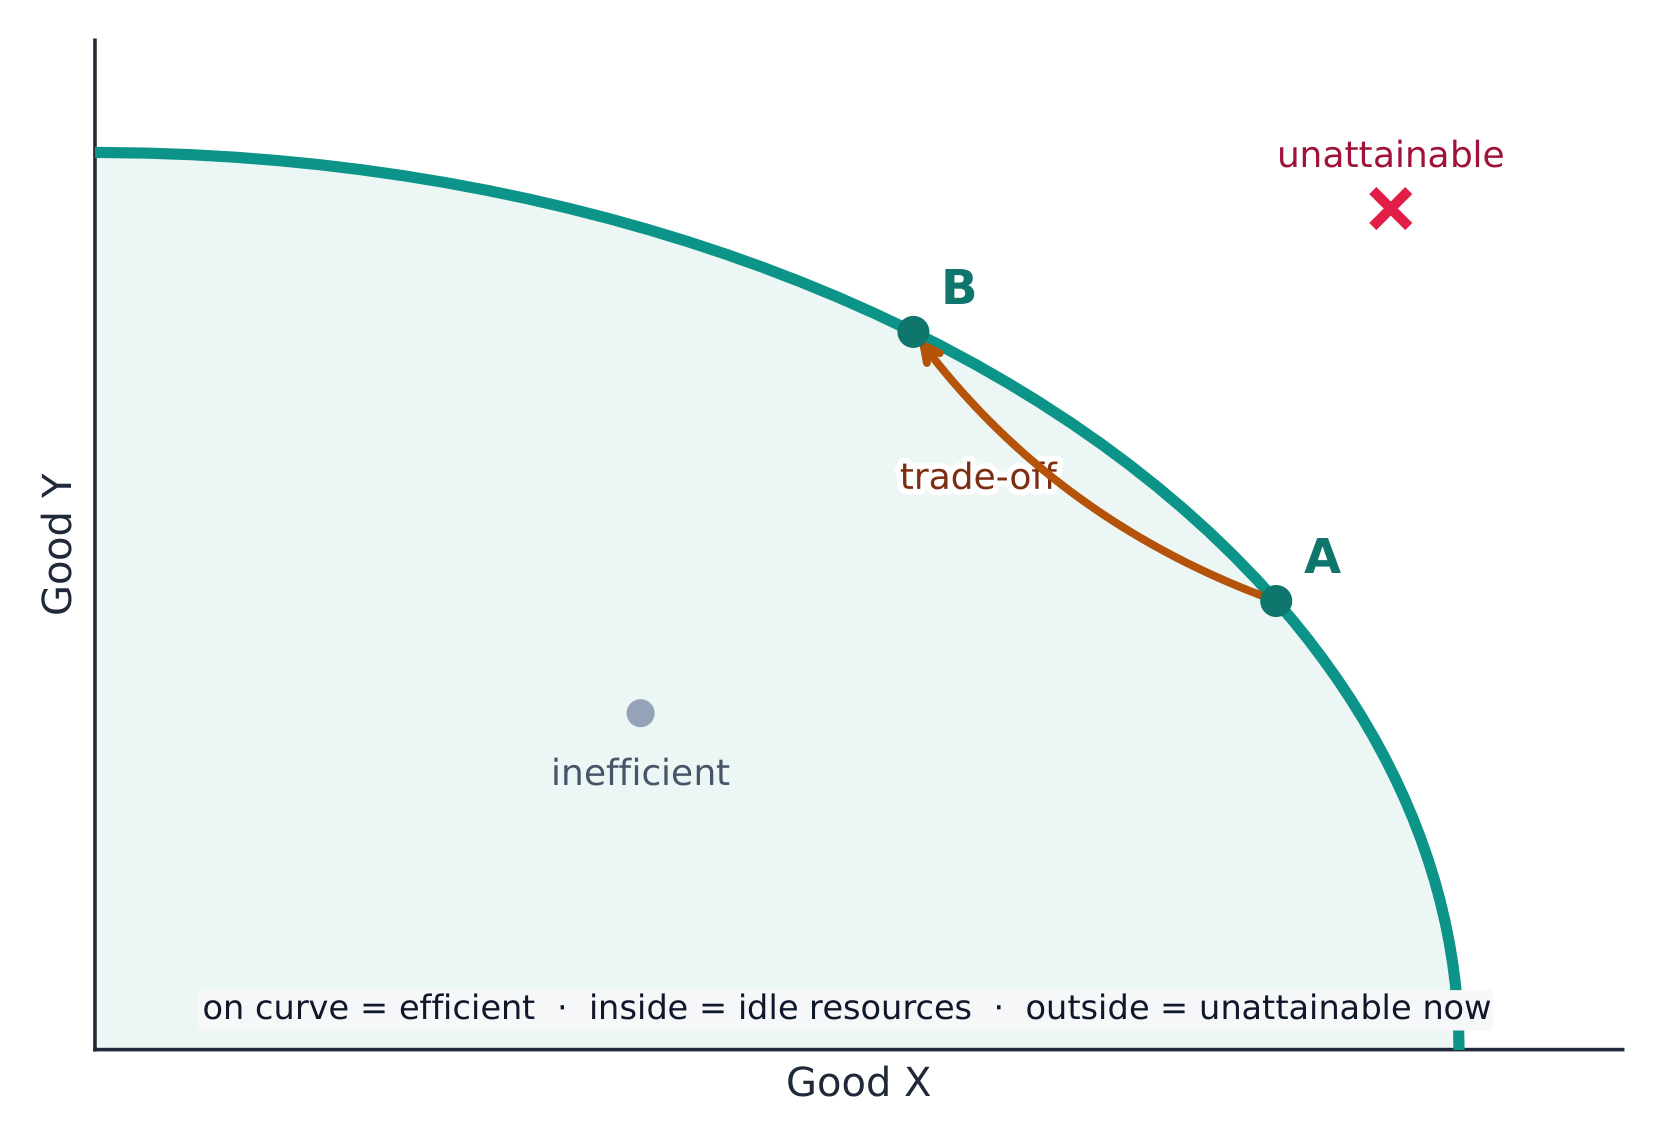
    • Points on the curve are efficient 有效率; points inside are inefficient (wasted or unemployed resources); points outside are currently unattainable 无法实现.
    • The PPC's downward slope shows opportunity cost: making more of one good means making less of the other. The slope at a point is the opportunity cost of the good on the horizontal axis.
    • A bowed-out (concave) PPC shows increasing opportunity cost – resources are not equally suited to both goods, so making more of one costs ever more of the other. A straight-line PPC means constant opportunity cost.
    • Economic growth 经济增长 (more resources, better technology) shifts the whole curve outward.

    Exam skill: be ready to read opportunity cost off a PPC, decide if a point is efficient/inefficient/unattainable, and explain what shifts the curve.

    ไทย

    *เส้นขอบเขตความสามารถในการผลิต

    เส้นโค้งความเป็นไปได้ในการผลิต (PPC) แสดงชุดผลผลิตสูงสุดของสินค้าสองชนิดที่เศรษฐกิจสามารถผลิตได้ด้วยทรัพยากรและเทคโนโลยีที่มีอยู่อย่างเต็มประสิทธิภาพ

    จุดบน ภายใน และภายนอกเส้นโค้งความเป็นไปได้ในการผลิต
    จุดบน ภายใน และภายนอกเส้นโค้งความเป็นไปได้ในการผลิต
    • จุด บน เส้นโค้งเป็น ประสิทธิภาพ; จุด ภายใน ไม่เป็นประสิทธิภาพ (ทรัพยากรถูกทำลายหรือว่างเปล่า); จุด ภายนอก ปัจจุบัน ไม่สามารถทำได้
    • ความชันลดลงของ PPC แสดงถึง ค่าโอกาส: การผลิตสินค้าหนึ่งเพิ่มมากขึ้นหมายถึงการผลิตอีกชนิดหนึ่งลดน้อยลง ความชัน ที่จุดใดๆ คือค่าโอกาสของสินค้าบนแกนนอน
    • PPC แบบโค้งเว้าออก (เว้าเข้า) แสดงถึง ค่าโอกาสที่เพิ่มขึ้น – ทรัพยากรไม่เหมาะสมเท่าเทียมกันสำหรับทั้งสองสินค้า ดังนั้นการผลิตสินค้าหนึ่งเพิ่มมากขึ้นจะต้องใช้สินค้าอีกชนิดหนึ่งมากเรื่อยๆ PPC แบบเส้นตรง หมายถึงค่าโอกาสคงที่
    • การเติบโตทางเศรษฐกิจ (ทรัพยากรเพิ่มขึ้น เทคโนโลยีดีขึ้น) ขยับเส้นโค้งทั้งหมด ออกไปด้านนอก

    ทักษะการสอบ: เตรียมตัวอ่านค่าโอกาสจาก PPC ตัดสินใจว่าจุดนั้นมีประสิทธิภาพ/ไม่มีประสิทธิภาพ/ทำไม่ได้ และอธิบายปัจจัยที่ทำให้เส้นโค้งขยับ

    เส้นโค้งความเป็นไปได้ในการผลิต: จุดที่มีประสิทธิภาพ ไม่มีประสิทธิภาพ และทำไม่ได้
    เส้นโค้งความเป็นไปได้ในการผลิต: จุดที่มีประสิทธิภาพ ไม่มีประสิทธิภาพ และทำไม่ได้
    Explore · ⁨สำรวจ⁩

    Explore the production possibilities curve

    Making more of one good means giving up some of the other — that trade-off is the opportunity cost, and the bowed shape shows the law of increasing opportunity cost. Drag along the curve, then grow the economy to push the whole frontier out. · ⁨การผลิตสินค้าชนิดหนึ่งมากขึ้นหมายถึงการเสียสละสินค้าอีกชนิดหนึ่ง — ความขัดแย้งนี้คือ โอกาสสูญเสีย และรูปทรงโค้งแสดงถึง กฎแห่งโอกาสสูญเสียที่เพิ่มขึ้น ลากตามเส้นโค้ง แล้วขยายเศรษฐกิจเพื่อดันขอบเขตการผลิตทั้งหมดออกด้านนอก⁩

    1.4

    Comparative Advantage and Gains from Trade · ⁨ความได้เปรียบสัมพัทธ์และประโยชน์จากการค้า⁩

    Syllabus · ⁨หลักสูตร⁩
    English

    Enduring Understanding (MKT-2): The consequences of scarcity can be mitigated through specialization in production and by exchange.

    Learning Objective MKT-2.A: a. Define absolute advantage and comparative advantage. b. Determine (using data from PPCs or tables as appropriate) absolute and comparative advantage.

    • MKT-2.A.1 Absolute advantage describes a situation in which an individual, business, or country can produce more of a good or service than any other producer with the same quantity of resources.
    • MKT-2.A.2 Comparative advantage describes a situation in which an individual, business, or country can produce a good or service at a lower opportunity cost than another producer.

    Learning Objective MKT-2.B: a. Explain (using data from PPCs or tables as appropriate) how specialization according to comparative advantage with appropriate terms of trade can lead to gains from trade. b. Calculate (using data from PPCs or tables as appropriate) mutually beneficial terms of trade.

    • MKT-2.B.1 Production specialization according to comparative advantage, not absolute advantage, results in exchange opportunities that lead to consumption possibilities beyond the PPC.
    • MKT-2.B.2 Comparative advantage and opportunity costs determine the terms of trade for exchange under which mutually beneficial trade can occur.
    ไทย

    ความเข้าใจที่ยั่งยืน (MKT-2): ผลกระทบจากความจำกัดสามารถบรรเทาได้ด้วยการเชี่ยวชาญในการผลิตและการแลกเปลี่ยน

    วัตถุประสงค์การเรียนรู้ MKT-2.A: ก. นิยามข้อได้เปรียบสัมบูรณ์และข้อได้เปรียบเปรียบเทียบ ข. ตระหนัก (โดยใช้ข้อมูลจาก PPC หรือตารางเมื่อเหมาะสม) ข้อได้เปรียบสัมบูรณ์และข้อได้เปรียบเปรียบเทียบ

    • MKT-2.A.1 ความได้เปรียบสัมบูรณ์อธิบายสถานการณ์ที่บุคคล ธุรกิจ หรือประเทศหนึ่งสามารถผลิตสินค้าหรือบริการได้มากกว่าผู้ผลิตอื่นใด ด้วยปริมาณทรัพยากรเท่ากัน
    • MKT-2.A.2 ความได้เปรียบสัมพัทธ์อธิบายสถานการณ์ที่บุคคล ธุรกิจ หรือประเทศหนึ่งสามารถผลิตสินค้าหรือบริการได้ด้วยต้นทุนโอกาสต่ำกว่าผู้ผลิตอื่น

    จุดประสงค์การเรียนรู้ MKT-2.B: ก. อธิบาย (โดยใช้ข้อมูลจาก PPC หรือตารางเมื่อเหมาะสม) ว่าการแบ่งความเชี่ยวชาญตามข้อได้เปรียบพร้อมอัตราแลกเปลี่ยนที่เหมาะสมสามารถนำไปสู่ผลประโยชน์ทางการค้าได้อย่างไร ข. คำนวณ (โดยใช้ข้อมูลจาก PPC หรือตารางเมื่อเหมาะสม) อัตราแลกเปลี่ยนที่เป็นประโยชน์ร่วมกัน

    • MKT-2.B.1 การเชี่ยวชาญในการผลิตตามความได้เปรียบสัมพัทธ์ ไม่ใช่ความได้เปรียบสัมบูรณ์ จะนำไปสู่โอกาสในการแลกเปลี่ยนซึ่งทำให้ความเป็นไปได้ในการบริโภคเกินกว่าเส้น PPC
    • MKT-2.B.2 Comparative advantageและopportunity costsกำหนดterms of tradeสำหรับการ交换ที่ mutually beneficial tradeสามารถเกิดขึ้นได้

    Source: College Board AP Course and Exam Description · ⁨แหล่งที่มา: คำอธิบายหลักสูตรและข้อสอบ College Board AP⁩

    English

    Two producers can both gain from trade by specializing 专业化.

    • A producer has an absolute advantage 绝对优势 in a good if it can make more of it with the same resources.
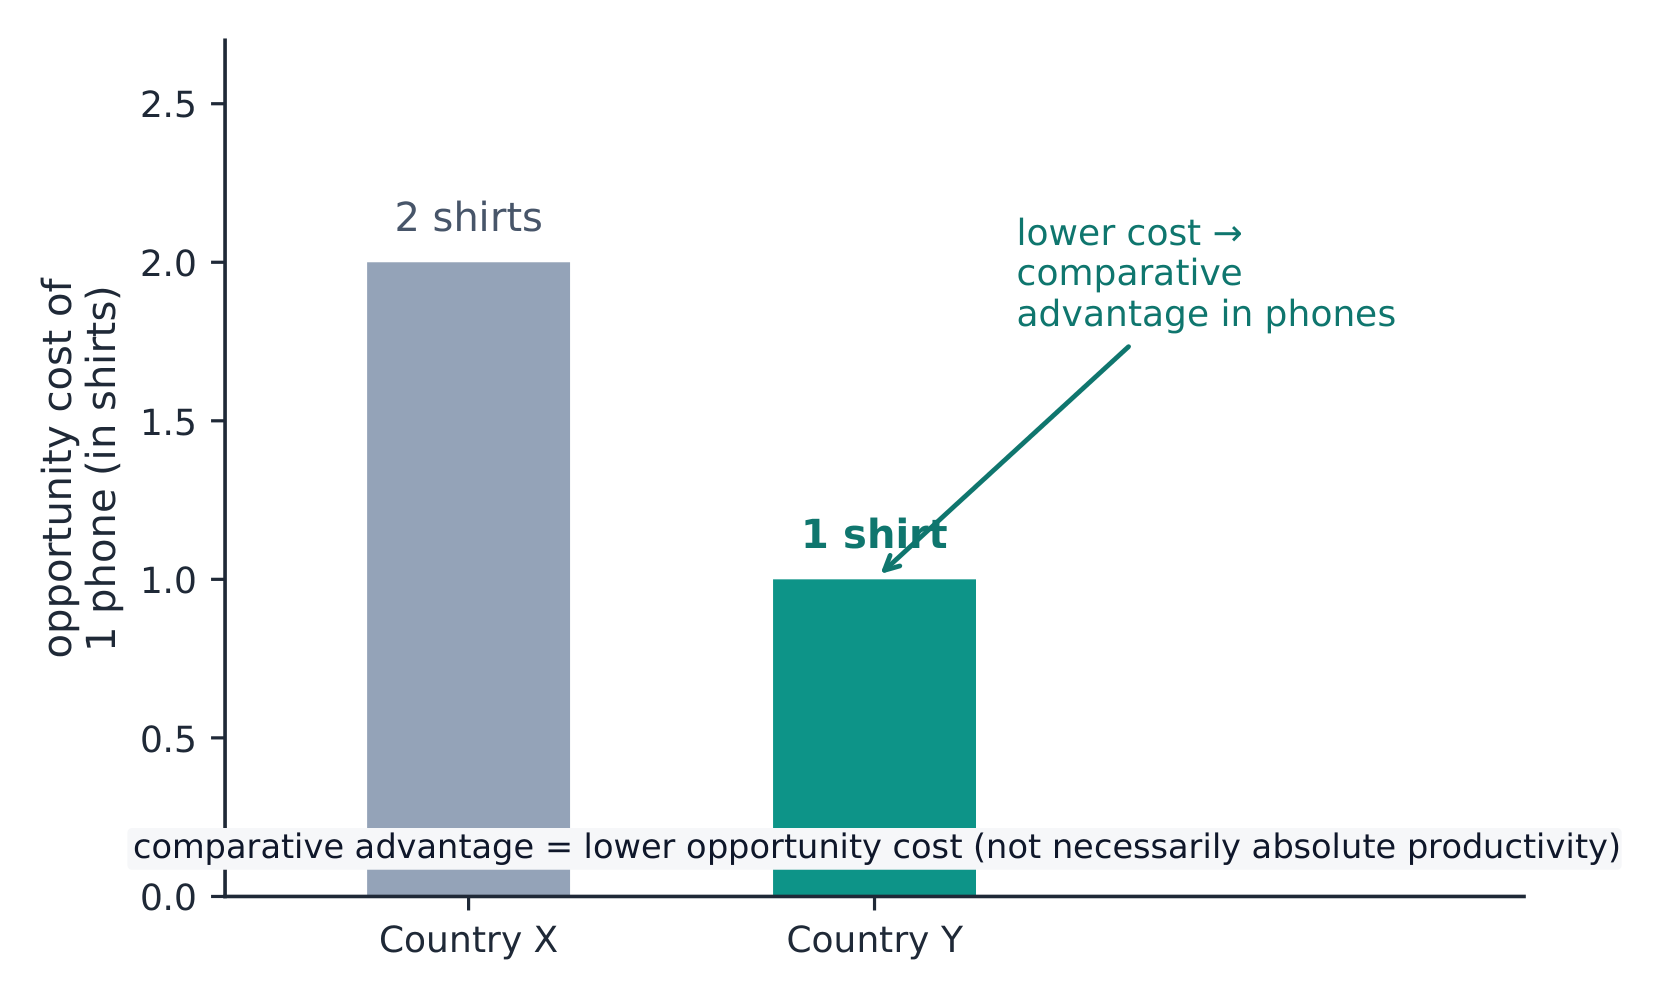
    • A producer has a comparative advantage 比较优势 if it has the lower opportunity cost for that good. Comparative advantage – not absolute – determines who should specialize.
    • Compute opportunity cost from output data: for each producer, one unit of good X costs (units of Y) $\div$ (units of X). The producer who gives up less Y should make X.
    • Both sides gain if they trade at a rate between their two opportunity costs – the terms of trade 贸易条件. Specializing by comparative advantage lets total output exceed what either could make alone, so consumption can lie outside each producer's own PPC.

    Worked example. Anna can make $20$ shirts or $10$ tables a day; Ben can make $12$ shirts or $12$ tables. For Anna one table costs $\tfrac{20}{10}=2$ shirts; for Ben it costs $\tfrac{12}{12}=1$ shirt. Ben gives up fewer shirts, so Ben specializes in tables and Anna in shirts. Any terms of trade between $1$ and $2$ shirts per table – say $1.5$ – leaves both better off than producing alone.

    Exam skill: these calculations appear almost every year – practice finding comparative advantage from both output tables and input tables, and stating a valid terms-of-trade range.

    ไทย

    ผู้ผลิตสองรายสามารถได้รับประโยชน์จากการแลกเปลี่ยนกันได้โดย ** specialization (การทำเฉพาะด้าน)**

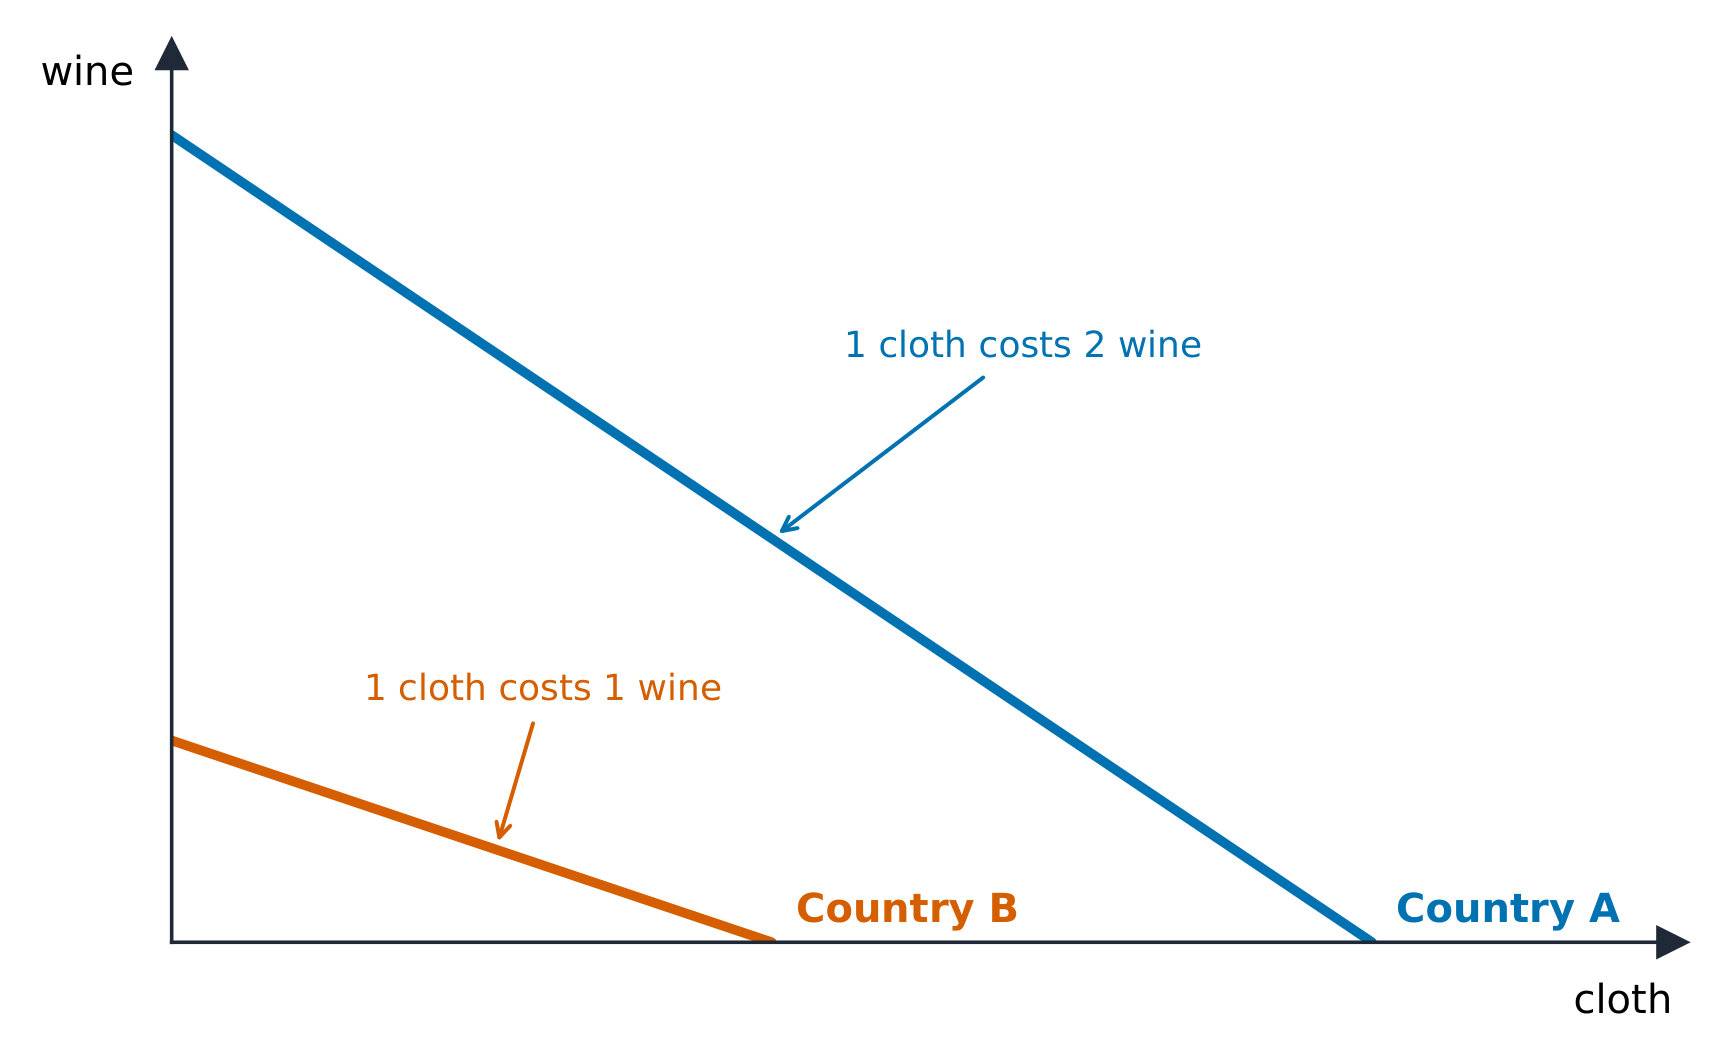
    ความได้เปรียบสัมพัทธ์เกิดจากเส้น frontier ของการผลิตที่มีความชันต่างกัน
    ความได้เปรียบสัมพัทธ์เกิดจากเส้น frontier ของการผลิตที่มีความชันต่างกัน
    • ผู้ผลิตมี ความได้เปรียบสัมบูรณ์ ในสินค้าหากสามารถผลิตได้มากกว่าด้วยทรัพยากรเท่าเดิม
    • ผู้ผลิตมี ความได้เปรียบสัมพัทธ์ หากมี ค่าโอกาสที่ต่ำกว่า สำหรับสินค้านั้น ความได้เปรียบสัมพัทธ์ (ไม่ใช่สัมบูรณ์) เป็นตัวกำหนดว่าใครควรทำเฉพาะด้าน
    • คำนวณค่าโอกาสจากข้อมูลผลผลิต: สำหรับแต่ละผู้ผลิต สินค้า X หนึ่งหน่วยมีต้นทุนคือ (หน่วยของ Y) $\div$ (หน่วยของ X) ผู้ผลิตที่สละ Y น้อยกว่าควรผลิต X
    • ทั้งสองฝ่ายได้ประโยชน์หากแลกเปลี่ยนในอัตรา ระหว่าง ค่าโอกาสของทั้งสองฝ่าย –即 เงื่อนไขการค้า การทำเฉพาะด้านด้วยความได้เปรียบสัมพัทธ์ทำให้ผลผลิตรวมเกินกว่าที่任何一方独自ผลิตได้ ดังนั้นการบริโภคสามารถอยู่ใน ภายนอก เส้นโค้งความเป็นไปได้ในการผลิตของแต่ละผู้ผลิตเอง

    ตัวอย่างฝึกฝน. Anna สามารถทำ $20$ เสื้อ หรือ $10$ โต๊ะต่อวัน; Ben สามารถทำ $12$ เสื้อ หรือ $12$ โต๊ะ สำหรับ Anna โต๊ะหนึ่งมีต้นทุน $\tfrac{20}{10}=2$ เสื้อ; สำหรับ Ben มีต้นทุน $\tfrac{12}{12}=1$ เสื้อ Ben สละเสื้อน้อยกว่า ดังนั้น Ben ทำเฉพาะด้านโต๊ะ และ Anna ทำเฉพาะด้านเสื้อ เงื่อนไขการค้าใดๆ ระหว่าง $1$ และ $2$ เสื้อต่อโต๊ะ – เช่น $1.5$ – ทำให้ทั้งสองฝ่ายดีกว่าการผลิตเอง

    ทักษะการสอบ: การคำนวณเหล่านี้ปรากฏเกือบทุกปี – ฝึกหาความได้เปรียบสัมพัทธ์จากตารางผลผลิตและตารางอินพุต และการระบุช่วงเงื่อนไขการค้าที่เป็นไปได้

    ความได้เปรียบเชิงเปรียบเทียบเป็นของผู้ผลิตที่มีต้นทุนโอกาสต่ำกว่า
    ความได้เปรียบสัมพัทธ์อยู่ที่ผู้ผลิตที่มีค่าโอกาสต่ำกว่า
    การขนส่งแบบคอนเทนเนอร์: ความได้เปรียบสัมพัทธ์และการค้าช่วยให้ประเทศเชี่ยวชาญและได้รับประโยชน์
    การขนส่งแบบคอนเทนเนอร์: ความได้เปรียบสัมพัทธ์และการค้าช่วยให้ประเทศเชี่ยวชาญและได้รับประโยชน์
    Explore · ⁨สำรวจ⁩

    See why trade lets you consume beyond the frontier · ⁨เห็นว่าการค้าทำให้บริโภคเกินขอบเขตการผลิตได้⁩

    A producer should specialize where its opportunity cost is lowest, then trade for the rest. Because the terms of trade lie between the two producers' costs, trade lets a country consume outside its own production frontier. · ⁨ผู้ผลิตควรเชี่ยวชาญในพื้นที่ที่มี โอกาสสูญเสีย ต่ำที่สุด แล้วไปแลกเปลี่ยนส่วนที่เหลือ เนื่องจากเงื่อนไขการค้าอยู่ระหว่างต้นทุนของผู้ผลิตทั้งสอง การค้าช่วยให้ประเทศบริโภค นอกเหนือ จากเส้น frontier การผลิตของตนเอง⁩

    Vocabulary · ⁨คำศัพท์⁩ Train · ⁨ฝึกฝน⁩
    English ไทย
    comparative advantage/kəmˈpærətɪv ədˈvæntɪdʒ/ ความได้เปรียบสัมพัทธ์
    terms of trade/tɜːmz ɒv treɪd/ terms of trade
    sunk cost/sʌŋk kɒst/ 沉没 cost (sunk cost)
    Marginal analysis/ˈmɑːdʒɪnl əˈnæləsɪs/ การวิเคราะห์边际
    marginal benefit/ˈmɑːdʒɪnl ˈbenɪfɪt/ ประโยชน์ส่วนเพิ่ม
    marginal cost/ˈmɑːdʒɪnl kɒst/ ต้นทุน边际 (marginal cost)
    1.5

    Cost-Benefit Analysis · ⁨การวิเคราะห์ต้นทุนและผลประโยชน์⁩

    Syllabus · ⁨หลักสูตร⁩
    English

    Enduring Understanding (CBA-1): Rational economic decisions require the evaluation of costs and benefits.

    Learning Objective CBA-1.A: a. Define opportunity cost. b. Explain the opportunity costs associated with choices. c. Calculate the opportunity costs associated with choices.

    • CBA-1.A.1 Rational agents consider opportunity costs, whether implicit or explicit, when calculating the total economic costs of any decision.
    • CBA-1.A.2 Total benefits form the metric "utility" for consumers and total revenue for firms.

    Learning Objective CBA-1.B: a. Explain a decision by comparing total benefits and total costs (using a table or a graph when appropriate). b. Calculate total benefits and total costs (using a table or graph where appropriate).

    • CBA-1.B.1 Total net benefits, the difference between total benefits and total costs, are maximized at the optimal choice.
    • CBA-1.B.2 Some decisions permit rational agents to look at only marginal benefit and marginal cost. Other decisions cannot be broken down into increments in this way and must be evaluated by looking at total benefits and total costs.
    ไทย

    ความเข้าใจที่ยั่งยืน (CBA-1): การตัดสินใจทางเศรษฐกิจอย่างมีเหตุผลจำเป็นต้องมีการประเมินต้นทุนและผลได้

    จุดประสงค์การเรียนรู้ CBA-1.A: a. นิยามต้นทุนโอกาส b. อธิบายต้นทุนโอกาสที่เกี่ยวข้องกับการเลือก c. คำนวณต้นทุนโอกาสที่เกี่ยวข้องกับการเลือก

    • CBA-1.A.1 Rational agentsจะ考虑opportunity costs,无论是implicit还是explicit,เมื่อcalculating the total economic costs of any decision.
    • CBA-1.A.2 ผลได้รวมเป็นเกณฑ์ "Utility" สำหรับผู้บริโภค และรายได้รวมสำหรับกิจการ

    จุดประสงค์การเรียนรู้ CBA-1.B: a. อธิบายการตัดสินใจโดยการเปรียบเทียบผลได้รวมกับต้นทุนรวม (ใช้ตารางหรือกราฟเมื่อเหมาะสม) b. คำนวณผลได้รวมและต้นทุนรวม (ใช้ตารางหรือกราฟเมื่อเหมาะสม)

    • CBA-1.B.1 ผลได้สุทธิรวม ซึ่งเป็นผลต่างระหว่างผลได้รวมกับต้นทุนรวม จะถูกทำให้สูงสุดที่ทางเลือกที่เหมาะสมที่สุด
    • CBA-1.B.2 บางการอนุญาตให้ตัวแทนที่มีเหตุผลพิจารณาเฉพาะผลได้ส่วนเพิ่มและต้นทุนส่วนเพิ่มเท่านั้น แต่บางการตัดสินใจไม่สามารถแยกออกเป็นหน่วยย่อยๆ ได้ในลักษณะนี้ จึงต้องประเมินโดยพิจารณาผลได้รวมและต้นทุนรวม

    Source: College Board AP Course and Exam Description · ⁨แหล่งที่มา: คำอธิบายหลักสูตรและข้อสอบ College Board AP⁩

    English

    Rational decision-makers weigh benefits against costs. An action is worthwhile only when its benefit is at least as large as its cost – including the opportunity cost. Money already spent and unrecoverable is a sunk cost 沉没成本 and should be ignored in decisions: only future costs and benefits matter.

    ไทย

    ผู้ตัดสินใจอย่างมีเหตุผลชั่ง ประโยชน์เทียบกับต้นทุน การกระทำหนึ่งจะมีคุณค่าก็ต่อเมื่อประโยชน์อย่างน้อยเท่ากับต้นทุน – รวมถึงค่าโอกาส เงินที่จ่ายไปแล้วและไม่คืนกลับมาได้คือ ต้นทุนจม และควร เพิกเฉย ในการตัดสินใจ: เฉพาะต้นทุนและผลประโยชน์ในอนาคตเท่านั้นที่สำคัญ

    Explore · ⁨สำรวจ⁩

    Weigh total benefit against total cost · ⁨ชั่งน้ำหนักประโยชน์รวมเทียบกับต้นทุนรวม⁩

    A choice is worth it only while the benefit of one more unit beats its cost. Where total revenue meets total cost is the break-even point; past it, extra activity adds more cost than value. · ⁨ทางเลือกจะมีคุณค่าก็ต่อเมื่อ ประโยชน์ ของหน่วยเพิ่มอีกหนึ่งยังเหนือกว่า ต้นทุน ของมัน จุดที่รายรับรวมเท่ากับรายจ่ายรวมคือจุด คุ้มทุน; เกินจุดนั้นแล้ว กิจกรรมเพิ่มเติมจะเพิ่มต้นทุนมากกว่ามูลค่า⁩

    1.6

    Marginal Analysis and Consumer Choice · ⁨การวิเคราะห์ขอบเขตและการเลือกของผู้บริโภค⁩

    Syllabus · ⁨หลักสูตร⁩
    English

    Enduring Understanding (CBA-2): To determine the optimal level at which to pursue an activity whose total benefits exceed total cost, rational economic agents compare marginal benefits and marginal costs.

    Learning Objective CBA-2.A: a. Define the key assumptions of consumer choice theory. b. Explain (using a table or graph as appropriate) how a rational consumer's decision making involves the use of marginal benefits and marginal costs. c. Calculate (using a table or a graph when appropriate) how a rational consumer's decision making involves the use of marginal benefits and marginal costs.

    • CBA-2.A.1 Consumers face constraints and have to make optimal decisions accounting for these constraints.
    • CBA-2.A.2 In a model of rational consumer choice, consumers are assumed to make choices so as to maximize their total utility.
    • CBA-2.A.3 Consumers experience diminishing marginal utility in the consumption of goods and services.
    • CBA-2.A.4 Consumers allocate their limited income to purchase the combination of goods that maximizes their utility by equating/comparing the marginal utility of the last dollar spent on each good.
      • Exclusion statement: Indifference curves are beyond the scope of the course and the AP Exam, but equating the ratios of marginal utility to price is within the scope.

    Learning Objective CBA-2.B: a. Define marginal analysis and related terms. b. Explain a decision using marginal analysis (using a table or a graph when appropriate).

    • CBA-2.B.1 Marginal analysis involves comparing the additional benefit of increasing a given activity with the additional cost. Comparing marginal benefit (MB) with marginal cost (MC) helps individuals (firms) decide whether to increase, decrease, or maintain their consumption (production) levels.
    • CBA-2.B.2 The optimal quantity at any point in time does not depend on fixed costs (sunk costs) or fixed benefits that have already been determined by past choices.
    • CBA-2.B.3 The optimal quantity is achieved when marginal benefit is equal to marginal cost or where total benefit is maximized.
    ไทย

    ความเข้าใจที่ยั่งยืน (CBA-2): เพื่อระบุระดับที่เหมาะสมในการดำเนินกิจกรรมซึ่งผลได้รวมเกินกว่าต้นทุนรวม ตัวแทนทางเศรษฐกิจที่มีเหตุผลจะเปรียบเทียบผลได้ส่วนเพิ่มและต้นทุนส่วนเพิ่ม

    จุดประสงค์การเรียนรู้ CBA-2.A: a. นิยามสมมติฐานหลักของทฤษฎีการเลือกของผู้บริโภค b. อธิบาย (โดยใช้ตารางหรือกราฟเมื่อเหมาะสม) ว่าการตัดสินใจของผู้บริโภคที่มีเหตุผลเกี่ยวข้องกับการใช้ผลได้ส่วนเพิ่มและต้นทุนส่วนเพิ่มอย่างไร c. คำนวณ (โดยใช้ตารางหรือกราฟเมื่อเหมาะสม) ว่าการตัดสินใจของผู้บริโภคที่มีเหตุผลเกี่ยวข้องกับการใช้ผลได้ส่วนเพิ่มและต้นทุนส่วนเพิ่มอย่างไร

    • CBA-2.A.1 ผู้บริโภคเผชิญกับข้อจำกัดและต้องทำการตัดสินใจที่เหมาะสมโดยคำนึงถึงข้อจำกัดเหล่านี้
    • CBA-2.A.2 ในโมเดลการเลือกของผู้บริโภคอย่างมีเหตุผล สมมติว่าผู้บริโภคจะเลือกซื้อเพื่อเพิ่มอรรถประโยชน์รวมให้สูงสุด
    • CBA-2.A.3 ผู้บริโภคจะมีอรรถประโยชน์ส่วนเพิ่มที่ลดลงเมื่อ tiêuโภคสินค้าและบริการ
    • CBA-2.A.4 ผู้บริโภคจัดสรรรายได้ที่มีจำกัดของตนเพื่อซื้อชุดสินค้าที่เพิ่มอรรถประโยชน์ได้สูงสุด โดยเท่าเทียมหรือเปรียบเทียบอรรถประโยชน์ส่วนเพิ่มของเงินดอลลาร์สุดท้ายที่ใช้ในการซื้อแต่ละชนิดสินค้า
      • ข้อความยกเว้น: เส้นความไม่แตกต่าง (Indifference curves)อยู่นอกเหนือขอบเขตของหลักสูตรและข้อสอบ AP แต่การใช้สมการอัตราส่วนระหว่างอรรถประโยชน์ส่วนเพิ่มต่อราคาอยู่ในขอบเขต

    วัตถุประสงค์การเรียนรู้ CBA-2.B: ก. นิยามการวิเคราะห์ส่วนเพิ่มและศัพท์ที่เกี่ยวข้อง ข. อธิบายการตัดสินใจโดยใช้การวิเคราะห์ส่วนเพิ่ม (ใช้ตารางหรือกราฟเมื่อเหมาะสม)

    • CBA-2.B.1 การวิเคราะห์ส่วนเพิ่มเกี่ยวข้องกับการเปรียบเทียบผลประโยชน์ส่วนเพิ่มจากการเพิ่มกิจกรรมหนึ่งๆ กับต้นทุนส่วนเพิ่ม การเปรียบเทียบผลประโยชน์ส่วนเพิ่ม (MB) กับต้นทุนส่วนเพิ่ม (MC) ช่วยให้อุคคล (บริษัท) ตัดสินใจว่าจะเพิ่ม ลด หรือรักษาระดับการบริโภค (การผลิต) ไว้
    • CBA-2.B.2 ปริมาณที่เหมาะสมในช่วงเวลาใดเวลาหนึ่งไม่ขึ้นอยู่กับต้นทุนคงที่ (ต้นทุนจม) หรือผลประโยชน์คงที่ที่ถูกกำหนดไว้แล้วจากการกระทำในอดีต
    • CBA-2.B.3 ปริมาณที่เหมาะสมจะเกิดขึ้นเมื่อผลประโยชน์ส่วนเพิ่มเท่ากับต้นทุนส่วนเพิ่ม หรือเมื่อผลประโยชน์รวมมีค่าสูงสุด

    Source: College Board AP Course and Exam Description · ⁨แหล่งที่มา: คำอธิบายหลักสูตรและข้อสอบ College Board AP⁩

    English

    Most real decisions are not "all or nothing" but "a little more or a little less." Marginal analysis 边际分析 compares the marginal benefit 边际收益 (the benefit of one more unit) with the marginal cost 边际成本 (the cost of one more unit).

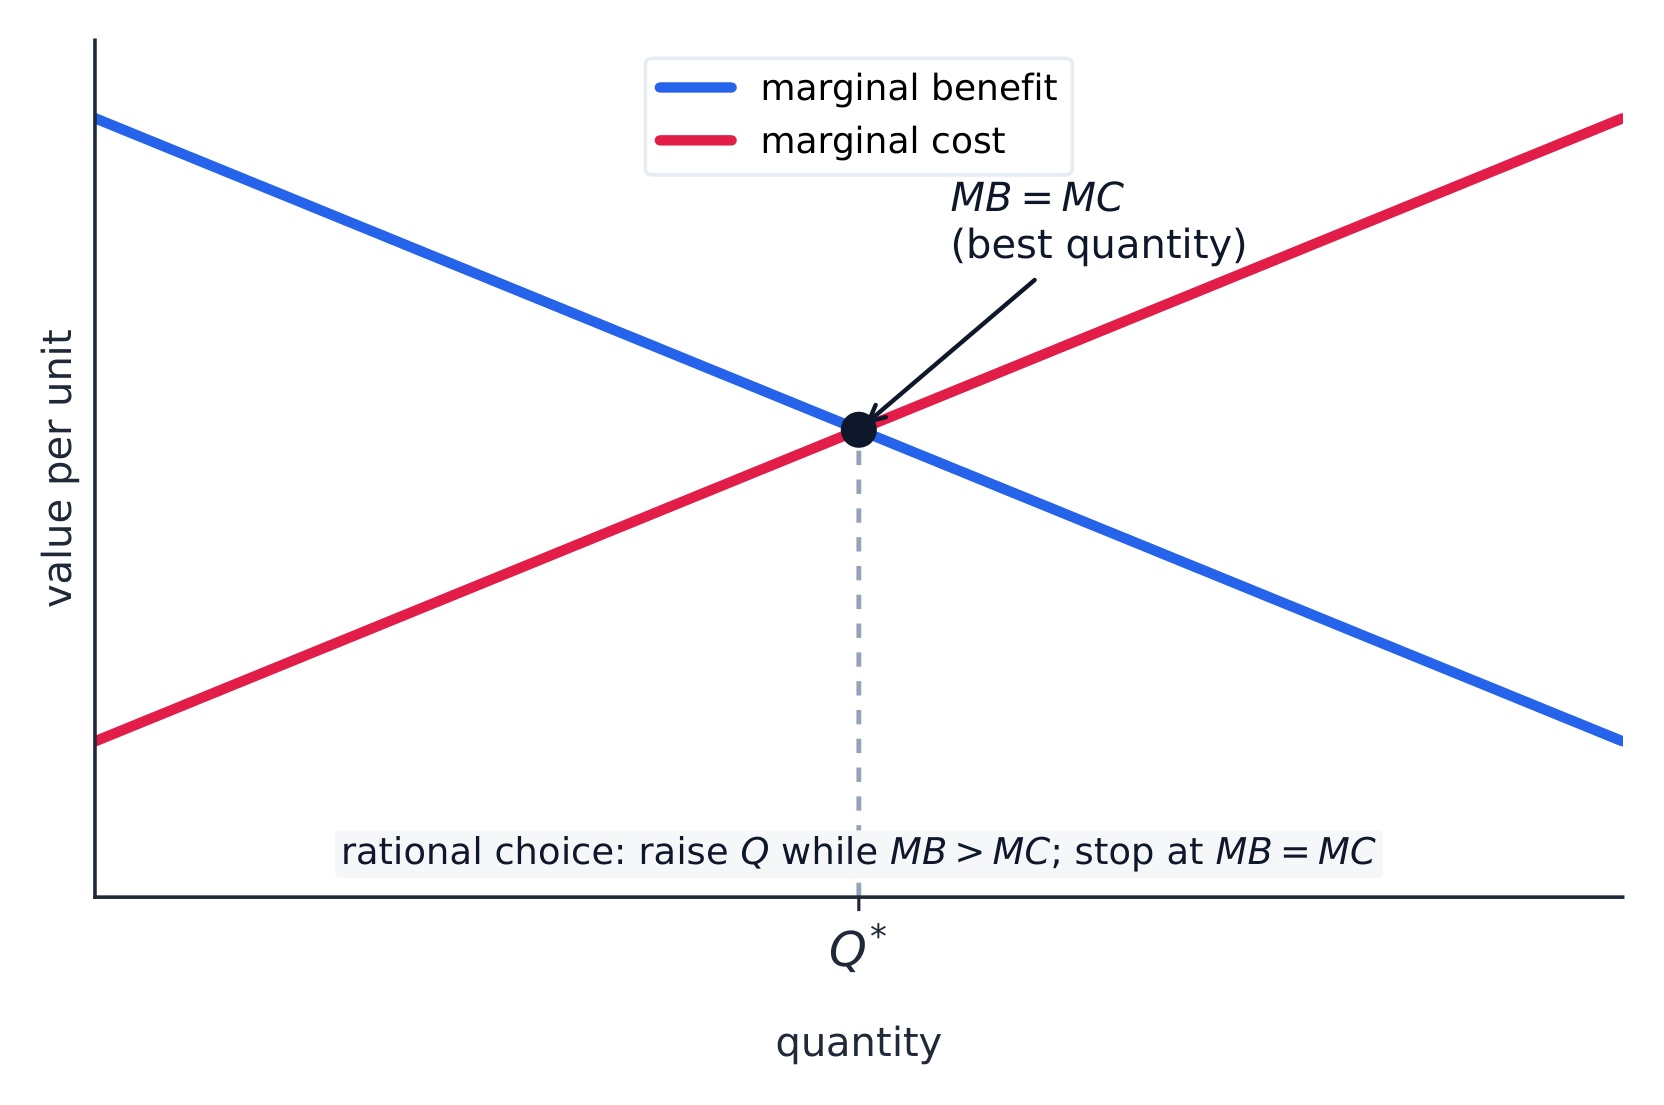
    • Decision rule: keep doing the activity while marginal benefit $>$ marginal cost; stop where MB $=$ MC. That point maximizes net benefit (total benefit minus total cost).
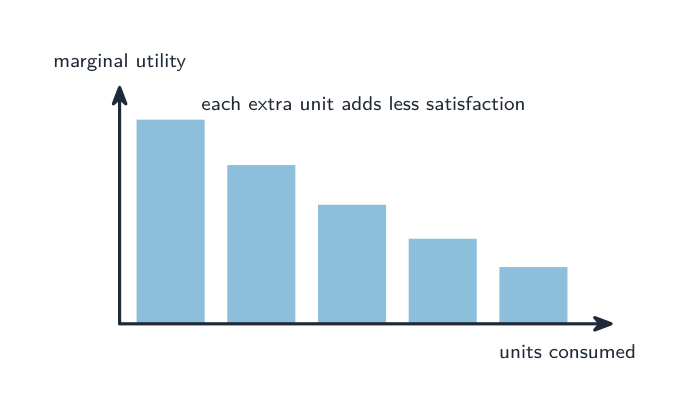
    • Consumers get utility 效用 (satisfaction) from goods, but each extra unit usually gives less added satisfaction – the law of diminishing marginal utility 边际效用递减法则.
    • A consumer maximizes total utility by the utility-maximizing rule: spend so that the marginal utility per dollar is equal across all goods, $\dfrac{MU_x}{P_x}=\dfrac{MU_y}{P_y}$, using up the whole budget. If one good gives more utility per dollar, buy more of it until the ratios equalize.

    Worked example. A consumer is choosing between good X ($MU_x=20$, $P_x=\$2$) and good Y ($MU_y=15$, $P_y=\$1$). The utility per dollar is $\tfrac{20}{2}=10$ for X but $\tfrac{15}{1}=15$ for Y. Y delivers more satisfaction per dollar, so the consumer should buy more Y and less X; as they do, $MU_y$ falls and $MU_x$ rises until $\tfrac{MU_x}{2}=\tfrac{MU_y}{1}$ and the budget is spent.

    Exam skill: the "MB = MC" logic and the "equal MU-per-dollar" rule are tested repeatedly – be able to find the optimal quantity from a table and explain why it is optimal.

    ไทย

    การตัดสินใจส่วนใหญ่ในชีวิตจริงไม่ใช่ "ทั้งหมดหรือไม่มีเลย" แต่เป็น "เพิ่มเล็กน้อยหรือลดเล็กน้อย" การวิเคราะห์ขอบเขต เปรียบเทียบ ประโยชน์边际 (ประโยชน์จากการผลิตเพิ่มอีกหนึ่งหน่วย) กับ ต้นทุน边际 (ต้นทุนจากการผลิตเพิ่มอีกหนึ่งหน่วย)

    的每一额外消费单位带来的额外满足感递减 (边际效用递减)
    每一额外消费单位带来的额外满足感递减 (边际效用递减)
    • กฎการตัดสินใจ: ดำเนินกิจกรรมต่อไปจนกว่าประโยชน์边际 $>$ ต้นทุน边际; หยุดเมื่อ MB $=$ MC จุดนี้จะทำให้ประโยชน์สุทธิสูงสุด (ประโยชน์รวมหักต้นทุนรวม)
    • ผู้บริโภคได้รับ Utility (ความพึงพอใจ) จากสินค้า แต่每一额外单位通常带来更少的附加满足感 –即 法则 of diminishing marginal utility
    • ผู้บริโภคทำให้ Utility รวมสูงสุดตาม กฎการเพิ่ม Utility สูงสุด: จัดสรรเงินเพื่อให้ Utility边际 per dollar เท่ากันสำหรับสินค้าทุกชนิด, $\dfrac{MU_x}{P_x}=\dfrac{MU_y}{P_y}$, ใช้งบประมาณทั้งหมด หากสินค้าใดให้ Utility per dollar มากกว่า ให้ซื้อมากขึ้นจนอัตราส่วนเท่ากัน

    ตัวอย่างฝึกฝน. ผู้บริโภคกำลังเลือกระหว่างสินค้า X ($MU_x=20$, $P_x=\$2$) and good Y ($MU_y=15$, $P_y=\$1$). Utility per dollar คือ $\tfrac{20}{2}=10$ สำหรับ X แต่ $\tfrac{15}{1}=15$ สำหรับ Y Y ให้ความพึงพอใจต่อ dollar มากกว่า ดังนั้นผู้บริโภคควรซื้อ Y มากขึ้นและ X น้อยลง; เมื่อทำเช่นนั้น, $MU_y$ ลดลงและ $MU_x$ เพิ่มขึ้นจน $\tfrac{MU_x}{2}=\tfrac{MU_y}{1}$ และงบประมาณหมดสิ้น

    ทักษะการสอบ: หลักการ "MB = MC" และกฎ "utility per dollar เท่ากัน" ถูกทดสอบบ่อยครั้ง – ต้องสามารถหาปริมาณที่เหมาะสมจากตารางและอธิบาย ทำไม จึงเหมาะสม

    การตัดสินใจอย่างมีเหตุผล: ทำต่อไปจนกว่าประโยชน์ส่วนเพิ่มจะมากกว่าต้นทุนส่วนเพิ่ม และหยุดเมื่อเท่ากัน
    การตัดสินใจอย่างมีเหตุผล: ทำต่อไปจนกว่าประโยชน์ส่วนเพิ่มจะมากกว่าต้นทุนส่วนเพิ่ม และหยุดเมื่อเท่ากัน
    Vocabulary · ⁨คำศัพท์⁩ Train · ⁨ฝึกฝน⁩
    English ไทย
    utility/juːˈtɪlɪti/ Utility
    law of diminishing marginal utility/lɔː ɒv dɪˈmɪnɪʃɪŋ ˈmɑːdʒɪnl juːˈtɪlɪti/ กฎของอรรถประโยชน์ส่วนเพิ่มที่ลดลง
    1.6

    Exam tips · ⁨ข้อแนะนำสำหรับการสอบ⁩

    English
    • Opportunity cost is the next-best alternative given up; ignore sunk costs in any decision.
    • Comparative advantage (lower opportunity cost) determines specialisation and the gains from trade.
    • Apply marginal analysis: keep doing an activity while MB > MC, stopping where MB = MC.
    • Maximise utility by equalising the marginal utility per dollar across goods.
    • Read opportunity cost off the PPC slope; a bowed curve shows increasing cost.
    ไทย
    • ต้นทุนโอกาสคือทางเลือกที่ดีถัดไปที่ถูกทิ้งไป; เพิกเฉยต่อต้นทุนที่ sunk ในทุกการตัดสินใจ
    • ความได้เปรียบเชิงเปรียบเทียบ (ต้นทุนโอกาสต่ำกว่า) กำหนดการเชี่ยวชาญและการได้รับประโยชน์จากการค้า
    • ใช้การวิเคราะห์ส่วนเพิ่ม: ทำกิจกรรมนั้นต่อไปจนกว่า MB > MC, หยุดเมื่อ MB = MC
    • สูงสุดแห่งความสุขโดยทำให้ ความพึงพอใจส่วนเพิ่มต่อหนึ่งดอลลาร์ เท่ากัน Across สินค้า
    • อ่านต้นทุนโอกาสจากความชันของ PPC; curves ที่โค้งเข้าหาจุดกำเนิดแสดงถึงต้นทุนที่เพิ่มขึ้น
  • 2

    Supply and Demand · ⁨อุปสงค์และอุปทาน⁩

    Watch lesson · ⁨ดูบทเรียน⁩
    2.1

    Demand · ⁨ความต้องการ⁩

    Syllabus · ⁨หลักสูตร⁩
    English

    Enduring Understanding (MKT-3): Individuals and firms respond to incentives and face constraints.

    Learning Objective MKT-3.A: a. Define (using graphs as appropriate) key terms and factors related to consumer decision making and the law of demand. b. Explain (using graphs as appropriate) the relationship between price and quantity demanded and how buyers respond to incentives and constraints.

    • MKT-3.A.1 A well-defined system of property rights is necessary for the market system to function well.
    • MKT-3.A.2 Economic agents respond to incentives.
    • MKT-3.A.3 Individuals often respond to incentives, such as those presented by prices, but also face constraints, such as income, time, and legal and regulatory frameworks.
    • MKT-3.A.4 The law of demand suggests that a change in the own-price causes a change in quantity demanded in the opposite direction and a movement along a demand (marginal benefit) curve.
    • MKT-3.A.5 The conceptual relationship between price and quantity stated by the law of demand leads to downward-sloping demand curves explained by the income effect and substitution effect and/or by diminishing marginal utility.
    • MKT-3.A.6 The market demand curve (schedule) is derived from the summation of individual demand curves (schedules).

    Learning Objective MKT-3.B: Explain (using graphs as appropriate) buyers' responses to changes in incentives and constraints.

    • MKT-3.B.1 Changes in the determinants of consumer demand can cause the demand curve to shift.
    ไทย

    ความเข้าใจที่ยั่งยืน (MKT-3): บุคคลและองค์กรตอบสนองต่อแรงจูงใจและเผชิญกับข้อจำกัด

    วัตถุประสงค์การเรียนรู้ MKT-3.A: ก. นิยาม (โดยใช้กราฟเมื่อเหมาะสม) คำศัพท์สำคัญและปัจจัยที่เกี่ยวข้องกับการตัดสินใจของผู้บริโภคและกฎแห่งการสงค์ ข. อธิบาย (โดยใช้กราฟเมื่อเหมาะสม) ความสัมพันธ์ระหว่างราคาและปริมาณที่ต้องการ以及如何ที่ผู้ซื้อตอบสนองต่อแรงจูงใจและข้อจำกัด

    • MKT-3.A.1 ระบบสิทธิ์ในทรัพย์สินที่ชัดเจนเป็นสิ่งที่จำเป็นต่อการทำงานที่มีประสิทธิภาพของระบบตลาด
    • MKT-3.A.2 ตัวกระทำทางเศรษฐกิจตอบสนองต่อแรงจูงใจ
    • MKT-3.A.3 บุคคลมักตอบสนองต่อแรงจูงใจ เช่น ที่เสนอโดยราคา แต่ такжеเผชิญกับข้อจำกัด เช่น รายได้ เวลา และกรอบกฎหมายและระเบียบ
    • MKT-3.A.4 กฎแห่งการสงค์ชี้ให้เห็นว่าการเปลี่ยนแปลงในราคาตัวเอง会引起การเปลี่ยนแปลงในปริมาณต้องการในทิศทางตรงกันข้ามและการเคลื่อนที่ตามเส้นโค้งการสงค์ (ผลประโยชน์ส่วนเพิ่ม)
    • MKT-3.A.5 ความสัมพันธ์เชิงแนวคิดระหว่างราคาและปริมาณตามที่กฎแห่งการสงค์ระบุ นำไปสู่เส้นโค้งการสงค์ที่ชันลง ซึ่งอธิบายได้ด้วยผลด้านรายได้ ผลการแทนที่ และ/หรือประโยชน์ส่วนเพิ่มที่ลดลง
    • MKT-3.A.6 เส้นโค้งการสงค์ของตลาด (ตาราง) มาจากการรวมเส้นโค้งการสงค์รายบุคคล (ตาราง)

    วัตถุประสงค์การเรียนรู้ MKT-3.B: อธิบาย (โดยใช้กราฟเมื่อเหมาะสม) การตอบสนองของผู้ซื้อต่อการเปลี่ยนแปลงในแรงจูงใจและข้อจำกัด

    • MKT-3.B.1 การเปลี่ยนแปลงในตัวกำหนดของการสงค์ของผู้บริโภคสามารถทำให้เส้นโค้งการสงค์เลื่อนไป

    Source: College Board AP Course and Exam Description · ⁨แหล่งที่มา: คำอธิบายหลักสูตรและข้อสอบ College Board AP⁩

    English
    Supply & demand: a shift raises P and Q

    A market works only where property rights 产权 are well defined – owners can use, exclude others from, and trade their resources; without them, prices cannot coordinate exchange. Within that framework, the two forces are demand and supply.

    Demand 需求 is the relationship between the price of a good and the quantity buyers are willing and able to buy. The law of demand 需求定律 says price and quantity demanded move in opposite directions, so the demand curve slopes downward. Two reasons: the substitution effect 替代效应 (when a good gets pricier, buyers switch to alternatives) and the income effect 收入效应 (a higher price shrinks real purchasing power).

    Distinguish a change in quantity demanded (a move along the curve, caused only by the good's own price) from a change in demand (a shift of the whole curve). Demand shifts with the determinants 决定因素, remembered as TRIBE:

    • Tastes/preferences,
    • Related goods – a rise in the price of a substitute 替代品 raises demand; a rise in the price of a complement 互补品 lowers it,
    • Income – for a normal good 正常商品 more income raises demand; for an inferior good 低档商品 it lowers it,
    • Buyers (number of consumers),
    • Expectations of future price or income.

    The market demand curve is the horizontal summation 水平相加 of every individual buyer's demand curve – at each price, add up the quantities all buyers want. That is why more buyers (the B above) shifts the whole market curve to the right.

    ไทย
    ผู้ซื้อในตลาด: ความต้องการแสดงhowปริมาณที่ต้องการตอบสนองต่อราคา
    ผู้ซื้อในตลาด: ความต้องการแสดงhowปริมาณที่ต้องการตอบสนองต่อราคา
    อุปสงค์ & อุปทาน: การ SHIFT จะทำให้ P และ Q สูงขึ้น

    ตลาดทำงานได้ก็ต่อเมื่อ สิทธิในทรัพย์สิน ถูกกำหนดไว้อย่างชัดเจน – เจ้าของสามารถใช้, ขัดขวางผู้อื่น, และแลกเปลี่ยนทรัพยากรของตน; หากไม่มีสิ่งเหล่านี้ ราคาไม่สามารถประสานการซื้อขายได้ ภายในกรอบนี้ แรงสองอย่างคือความต้องการและอุปทาน

    ความต้องการ คือความสัมพันธ์ระหว่างราคาสินค้ากับปริมาณที่ผู้ซื้อยินดีและสามารถซื้อได้ กฎแห่งความต้องการ กล่าวว่าราคาและปริมาณที่ต้องการเคลื่อนที่ในทิศทาง ตรงข้าม ดังนั้น curve ความต้องการจึงเอียงลง downward. สองเหตุผล: ผลของการแทนที่ (เมื่อสินค้าแพงขึ้น ผู้ซื้อเปลี่ยนไปใช้ทางเลือกอื่น) และ ผลทางรายได้ (ราคาสูงขึ้นลดอำนาจซื้อจริง)

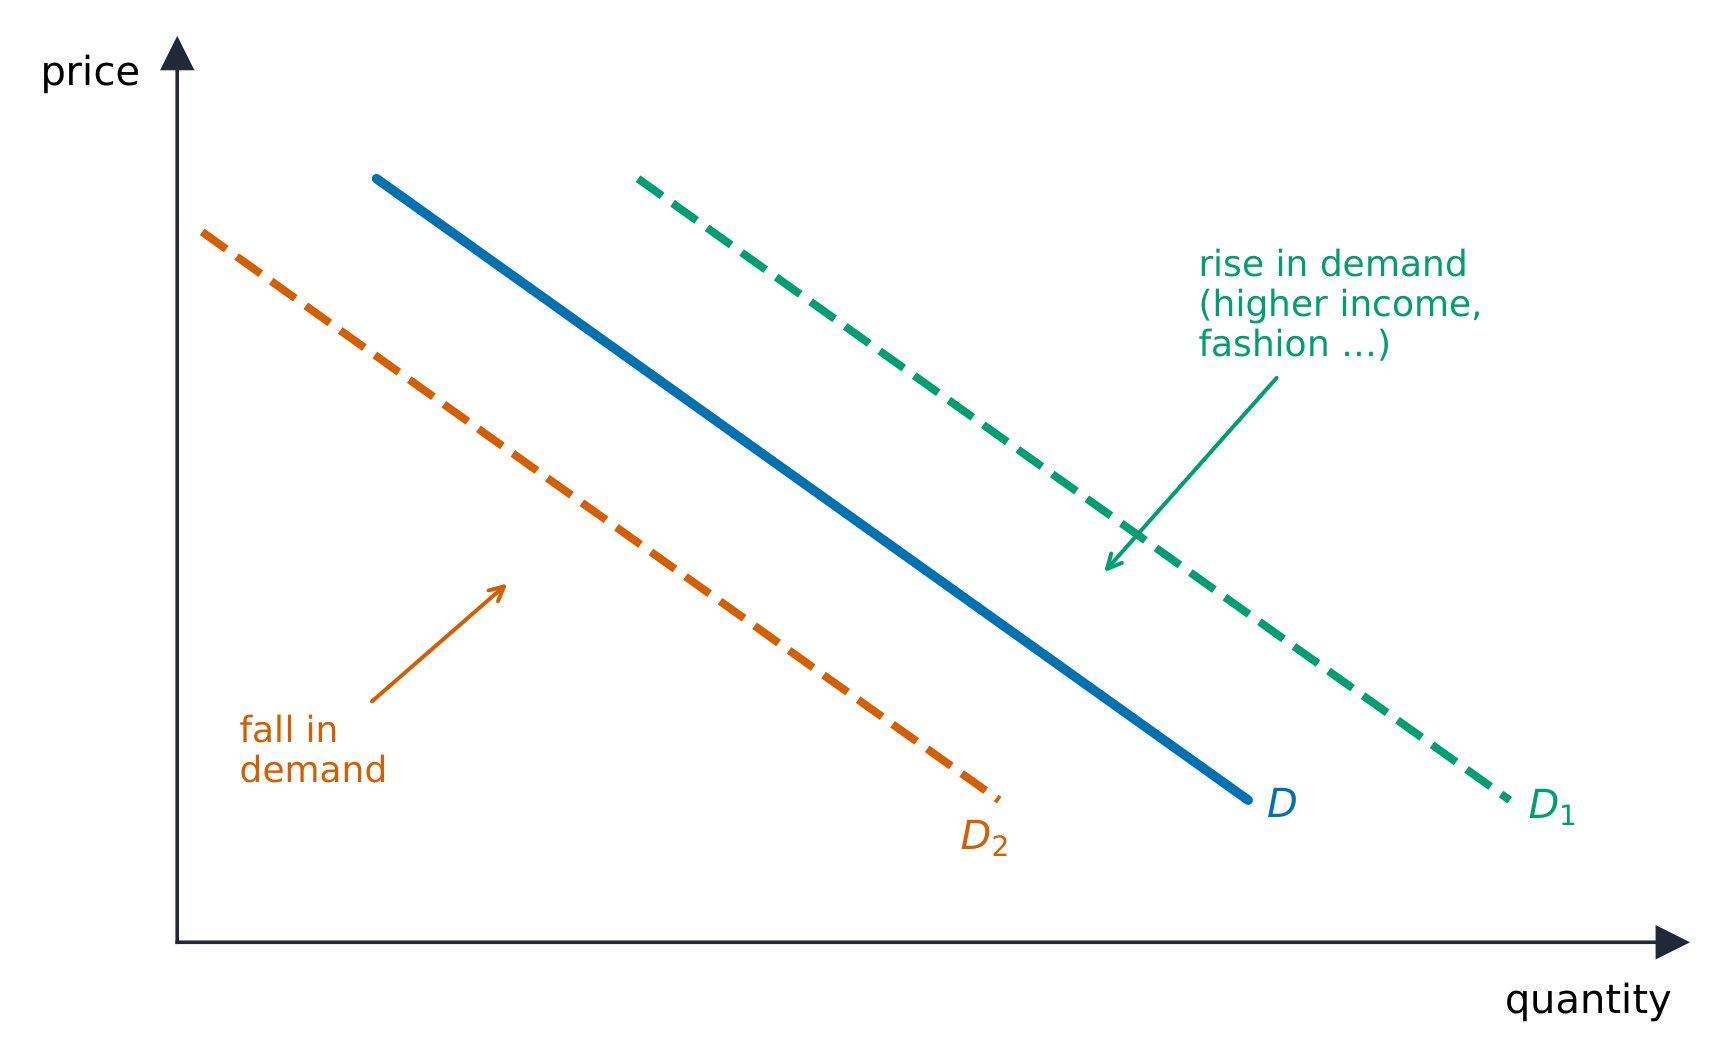
    เส้นโค้งความต้องการชันลง; รายได้ รสนิยม และราคาสินค้าที่เกี่ยวข้องเลื่อนเส้นโค้ง
    เส้นโค้งความต้องการชันลง; รายได้ รสนิยม และราคาสินค้าที่เกี่ยวข้องเลื่อนเส้นโค้ง

    แยกแยะระหว่าง การเปลี่ยนแปลงปริมาณต้องการ (การเคลื่อนที่ ตาม curve, เกิดจาก ราคาของสินค้านั้นเอง) จาก การเปลี่ยนแปลงความต้องการ (การ เลื่อน ของทั้งcurve). ความต้องการเลื่อนด้วย ปัจจัยกำหนด, จำเป็นต้องจำว่า TRIBE:

    • Taste/ความชอบ,
    • Related goods – ราคานี้ของ substitute เพิ่มขึ้นทำให้ความต้องการเพิ่มขึ้น; ราคานี้ของ complement เพิ่มขึ้นทำให้ลดลง,
    • Income – สำหรับ normal good รายได้เพิ่มขึ้นทำให้ความต้องการเพิ่มขึ้น; สำหรับ inferior good ทำให้ลดลง,
    • Buyers (จำนวนผู้บริโภค),
    • Expectations of ราคาล่วงหน้าหรือรายได้

    Market demand curve คือ การบวกแบบแนวนอน ของ curve ความต้องการของผู้ซื้อแต่ละคน – ที่ราคาใดๆ, บวกปริมาณที่ผู้ซื้อทุกคนต้องการทั้งหมด นั่นคือเหตุผลที่ผู้ซื้อมากขึ้น (B ด้านบน) เลื่อนทั้ง curve ตลาดไปทางขวา

    Explore · ⁨สำรวจ⁩

    Shift demand and watch price and quantity · ⁨ย้ายเส้นอุปสงค์และดูผลลัพธ์ที่ราคาและปริมาณ⁩

    The demand curve slopes down: lower price, more wanted. A change in income, tastes or related-good prices shifts the whole curve, moving the equilibrium. · ⁨เส้น อุปสงค์ มีแนวโน้มลดลง: ราคาลงมา ความต้องการก็มากขึ้น การเปลี่ยนแปลงรายได้ รสนิยม หรือราคาสินค้าที่เกี่ยวข้อง จะย้ายทั้งเส้น ทำให้จุดสมดุลเปลี่ยนไป⁩

    Vocabulary · ⁨คำศัพท์⁩ Train · ⁨ฝึกฝน⁩
    English ไทย
    property rights/ˈprɒpəti raɪts/ สิทธิในทรัพย์สิน
    Demand/dɪˈmænd/ อุปสงค์
    law of demand/lɔː ɒv dɪˈmænd/ กฎแห่งการต้องการ
    substitution effect/ˌsʌbstɪˈtjuːʃn ɪˈfekt/ ผลของการทดแทน
    income effect/ˈɪŋkʌm ɪˈfekt/ income effect
    determinants/dɪˈtɜːmɪnənts/ ปัจจัยกำหนด
    substitute/ˈsʌbstɪtjuːt/ แทนที่
    complement/ˈkɒmplɪmənt/ คอมพลีเมนต์
    normal good/ˈnɔːml ɡʊd/ สินค้าปกติ (normal good)
    inferior good/ɪnˈfɪərɪə ɡʊd/ สินค้าด้อยคุณภาพ (inferior good)
    horizontal summation/ˌhɒrɪˈzɒntl sʌˈmeɪʃn/ การบวกแนวนอน
    Supply/səˈplaɪ/ อุปทาน
    law of supply/lɔː ɒv səˈplaɪ/ กฎแห่งการเสนอขาย
    subsidies/ˈsʌbsɪdiz/ เงินอุดหนุน
    Price elasticity of demand/praɪs ɪlæˈstɪsɪti ɒv dɪˈmænd/ ความยืดหยุ่นของอุปสงค์ต่อราคา (Price elasticity of demand)
    2.2

    Supply · ⁨Offer⁩

    Syllabus · ⁨หลักสูตร⁩
    English

    Enduring Understanding (MKT-3): Individuals and firms respond to incentives and face constraints.

    Learning Objective MKT-3.C: a. Define (using graphs as appropriate) the law of supply. b. Explain (using graphs as appropriate) the relationship between price and quantity supplied.

    • MKT-3.C.1 A change in own-price causes a change in quantity supplied in the same direction and a movement along a supply curve.
    • MKT-3.C.2 The market supply curve (schedule) is derived from the summation of individual supply curves (schedules). The market supply curve is upward-sloping.

    Learning Objective MKT-3.D: Explain (using graphs as appropriate) producers' (sellers') responses to changes in incentives and technology.

    • MKT-3.D.1 Changes in the determinants of supply can cause the supply curve to shift.
    ไทย

    ความเข้าใจที่ยั่งยืน (MKT-3): บุคคลและองค์กรตอบสนองต่อแรงจูงใจและเผชิญกับข้อจำกัด

    วัตถุประสงค์การเรียนรู้ MKT-3.C: ก. นิยาม (โดยใช้กราฟเมื่อเหมาะสม) กฎของอุปทาน ข. อธิบาย (โดยใช้กราฟเมื่อเหมาะสม) ความสัมพันธ์ระหว่างราคาและปริมาณเสนอขาย

    • MKT-3.C.1 การเปลี่ยนแปลงในราคาตัวเอง会引起การเปลี่ยนแปลงในปริมาณเสนอขายในทิศทางเดียวกันและการเคลื่อนที่ตามเส้นโค้งการเสนอขาย
    • MKT-3.C.2 เส้นโค้งการเสนอขายของตลาด (ตาราง) มาจากการรวมเส้นโค้งการเสนอขายรายบุคคล (ตาราง) เส้นโค้งการเสนอขายของตลาดมีความชันขึ้น

    วัตถุประสงค์การเรียนรู้ MKT-3.D: อธิบาย (โดยใช้กราฟเมื่อเหมาะสม) การตอบสนองของผู้ผลิต (ผู้ขาย) ต่อการเปลี่ยนแปลงในแรงจูงใจและเทคโนโลยี

    • MKT-3.D.1 การเปลี่ยนแปลงในตัวกำหนดของการเสนอขายสามารถทำให้เส้นโค้งการเสนอขายเลื่อนไป

    Source: College Board AP Course and Exam Description · ⁨แหล่งที่มา: คำอธิบายหลักสูตรและข้อสอบ College Board AP⁩

    English
    A shift in supply

    Supply 供给 is the relationship between price and the quantity sellers will offer. The law of supply 供给定律: price and quantity supplied move in the same direction, so the supply curve slopes upward (higher prices cover higher marginal costs and reward more output).

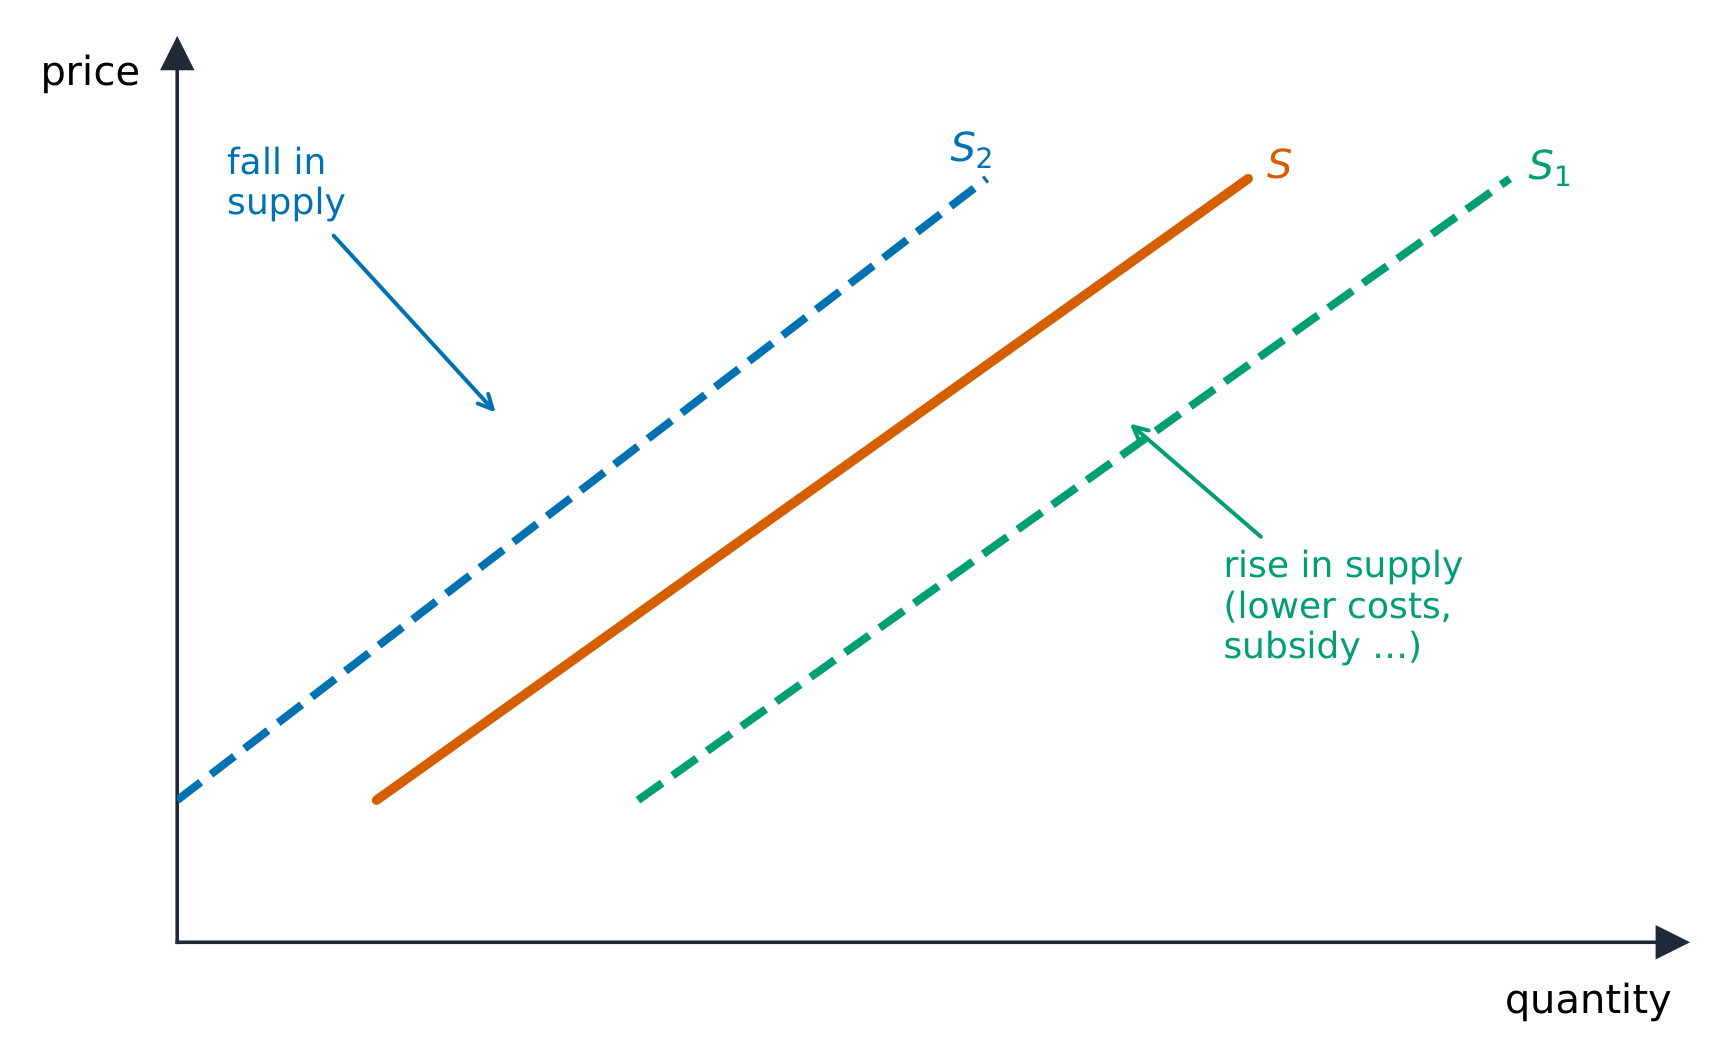
    Again separate a change in quantity supplied (movement along the curve, from the good's own price) from a change in supply (a shift). Supply shifts with input prices, technology, taxes and subsidies 补贴, prices of other goods a firm could make, number of sellers, and expectations. Just like demand, the market supply curve is the horizontal sum of individual firms' supply curves – add the quantities all firms offer at each price – so more sellers shifts market supply to the right.

    Exam skill: on the free-response section you must draw correctly labeled supply-and-demand graphs and shift the right curve in the right direction – decide first whether the event changes an "own price" (move along) or a determinant (shift).

    ไทย
    การเลื่อนของอุปทาน

    อุปทาน คือความสัมพันธ์ระหว่างราคาและปริมาณที่ผู้ขายจะเสนอขาย กฎแห่งอุปทาน: ราคาและปริมาณอุปทานเคลื่อนที่ในทิศทาง เดียวกัน ดังนั้น curve อุปทานจึงเอียงขึ้น upward (ราคาสูงครอบคลุมต้นทุนส่วนเพิ่มที่สูงกว่าและให้รางวัลต่อการผลิตมากขึ้น)

    เส้นโค้ง عرضهชันขึ้น; ต้นทุน เทคโนโลยี ภาษี และการอุดหนุนเลื่อนเส้นโค้ง
    เส้นโค้ง عرضهชันขึ้น; ต้นทุน เทคโนโลยี ภาษี และการอุดหนุนเลื่อนเส้นโค้ง

    อีกครั้ง แยก การเปลี่ยนแปลงปริมาณอุปทาน (การเคลื่อนที่ตาม curve, จากราคาของสินค้านั้นเอง) จาก การเปลี่ยนแปลงอุปทาน (การเลื่อน). อุปทานเลื่อนด้วย ราคาปัจจัยการผลิต, เทคโนโลยี, ภาษีและ เงินอุดหนุน, ราคาของสินค้าอื่นๆ ที่บริษัทอาจผลิตได้, จำนวนผู้ขาย, และ ความคาดหวัง เหมือนกับความต้องการ market supply curve คือผลรวมแบบแนวนอนของ curve อุปทานของบริษัทแต่ละแห่ง – บวกปริมาณที่บริษัททั้งหมดเสนอขายที่ราคาใดๆ – ดังนั้นผู้ขาย越多则 market supply เลื่อนไปทางขวา

    ทักษะการสอบ: ในส่วนคำตอบเปิด คุณต้องวาดกราฟอุปทานและความต้องการที่มีฉลากถูกต้องและเลื่อน right curve ในทิศทางที่ ถูก – ตัดสินใจก่อนว่าเหตุการณ์เปลี่ยน "own price" (เคลื่อนที่ตาม) หรือปัจจัยกำหนด (เลื่อน)

    2.3

    Price Elasticity of Demand · ⁨ความยืดหยุ่นของความต้องการตามราคา⁩

    Syllabus · ⁨หลักสูตร⁩
    English

    Enduring Understanding (MKT-3): Individuals and firms respond to incentives and face constraints.

    Learning Objective MKT-3.E: a. Define measures of elasticity. b. Explain (using graphs where appropriate) measures of elasticity and the impact of a given price change on total revenue or total expenditure. c. Calculate (using data from a graph or a table as appropriate) measures of elasticity.

    • MKT-3.E.1 Economists use the concept of elasticity to measure the magnitude of percentage changes in quantity owing to any given changes in the own-price, income, and prices of related goods.
    • MKT-3.E.2 Price elasticity of demand is measured by the percentage change in quantity demanded divided by the percentage change in price or the responsiveness of the quantity demanded to changes in price. Elasticity varies along a linear demand curve, meaning slope is not elasticity.
    • MKT-3.E.3 Ranges of values of elasticity of demand are described as elastic or inelastic with the separating benchmark being a magnitude of 1, where the change in the price and the change in the quantity demanded are proportional.
      • a. When the magnitude of the value of elasticity is greater than 1, the demand is described as being elastic with respect to that price in the range of the given change.
      • b. When the magnitude of the value of elasticity is less than 1, the demand is described as being inelastic with respect to that price in the range of the given change.
      • c. When the magnitude of the value of elasticity is equal to 1, the demand is described as being unit elastic with respect to that price in the range of the given change.
    • MKT-3.E.4 The price elasticity of demand depends on certain factors such as the availability of substitutes.
    • MKT-3.E.5 The impact of a given price change on total revenue or total expenditure will depend on whether demand is elastic, inelastic, or unit elastic.
    ไทย

    ความเข้าใจที่ยั่งยืน (MKT-3): บุคคลและองค์กรตอบสนองต่อแรงจูงใจและเผชิญกับข้อจำกัด

    วัตถุประสงค์การเรียนรู้ MKT-3.E: ก. นิยามวัดความยืดหยุ่น ข. อธิบาย (โดยใช้กราฟเมื่อเหมาะสม) วัดความยืดหยุ่นและผลกระทบของการเปลี่ยนแปลงราคาที่กำหนดต่อรายได้รวมหรือค่าใช้จ่ายรวม ค. คำนวณ (โดยใช้ข้อมูลจากกราฟหรือตารางเมื่อเหมาะสม) วัดความยืดหยุ่น

    • MKT-3.E.1 นักเศรษฐศาสตร์ใช้แนวคิดเรื่องความยืดหยุ่นเพื่อวัดขนาดของการเปลี่ยนแปลงเป็นเปอร์เซ็นต์ในปริมาณเนื่องจาก任何การเปลี่ยนแปลงที่กำหนดในราคาตัวเอง รายได้ และราคาของสินค้าที่เกี่ยวข้อง
    • MKT-3.E.2 ความยืดหยุ่นของราคาต่อความต้องการวัดโดยการเปลี่ยนแปลงเป็นเปอร์เซ็นต์ในปริมาณต้องการหารด้วยการเปลี่ยนแปลงเป็นเปอร์เซ็นต์ในราคา หรือความไวของปริมาณต้องการต่อการเปลี่ยนแปลงในราคา ความยืดหยุ่นแปรผันตามเส้นโค้งการสงค์เชิงเส้น หมายความว่าความชันไม่ใช่ความยืดหยุ่น
    • MKT-3.E.3 ช่วงค่าของความยืดหยุ่นของราคาต่อความต้องการถูกอธิบายว่าเป็นแบบยืดหยุ่นหรือแบบไม่ยืดหยุ่น โดยเกณฑ์แบ่งคือขนาดของ 1 ที่ซึ่งการเปลี่ยนแปลงในราคาและการเปลี่ยนแปลงในปริมาณต้องการเป็นสัดส่วนกัน
      • ก. เมื่อขนาดของค่าความยืดหยุ่นมีมากกว่า 1 การสงค์จะถูกอธิบายว่าเป็นแบบยืดหยุ่นเทียบกับราคานั้นในช่วงของการเปลี่ยนแปลงที่กำหนด
      • ข. เมื่อขนาดของค่าความยืดหยุ่นมีน้อยกว่า 1 การสงค์จะถูกอธิบายว่าเป็นแบบไม่ยืดหยุ่นเทียบกับราคานั้นในช่วงของการเปลี่ยนแปลงที่กำหนด
      • ค. เมื่อขนาดของค่าความยืดหยุ่นเท่ากับ 1 การสงค์จะถูกอธิบายว่าเป็นแบบยืดหยุ่นเท่ากันเทียบกับราคานั้นในช่วงของการเปลี่ยนแปลงที่กำหนด
    • MKT-3.E.4 ความยืดหยุ่นของราคาต่อความต้องการขึ้นอยู่กับปัจจัยบางประการ เช่น ความพร้อมของสินค้าทดแทน
    • MKT-3.E.5 ผลกระทบของการเปลี่ยนแปลงราคาที่กำหนดต่อรายได้รวมหรือค่าใช้จ่ายรวมจะขึ้นอยู่กับว่าการสงค์เป็นแบบยืดหยุ่น แบบไม่ยืดหยุ่น หรือแบบยืดหยุ่นเท่ากัน

    Source: College Board AP Course and Exam Description · ⁨แหล่งที่มา: คำอธิบายหลักสูตรและข้อสอบ College Board AP⁩

    English
    Price elasticity of demand

    Price elasticity of demand 需求价格弹性 measures how responsive quantity demanded is to a price change:

    $$E_d=\left|\frac{\%\ \Delta\ \text{quantity demanded}}{\%\ \Delta\ \text{price}}\right|.$$

    • $E_d>1$: elastic 富有弹性 (quantity responds strongly);
    • $E_d<1$: inelastic 缺乏弹性 (quantity barely responds);
    • $E_d=1$: unit elastic.

    Demand is more elastic when there are more substitutes, the good is a luxury, it takes a large share of income, or buyers have more time to adjust. Elasticity links to total revenue 总收入 ($P\times Q$): if demand is elastic, a price cut raises revenue; if inelastic, a price cut lowers it. Along a straight-line demand curve, elasticity falls as you move down (elastic on top, inelastic at the bottom).

    Worked example. A price rise from $\$10$ to $\$12$ (a $+20\%$ change) cuts quantity demanded from $100$ to $85$ (a $-15\%$ change). Then $E_d=\left|\dfrac{-15\%}{20\%}\right|=0.75<1$, so demand is inelastic. Because it is inelastic, the price rise raises total revenue: from $\$10\times100=\$1000$ to $\$12\times85=\$1020$.

    ไทย
    ความยืดหยุ่นของความต้องการตามราคา

    ความยืดหยุ่นของความต้องการตามราคา วัด how responsive quantity demanded เป็นต่อ price change:

    $$E_d=\left|\frac{\%\ \Delta\ \text{quantity demanded}}{\%\ \Delta\ \text{price}}\right|.$$

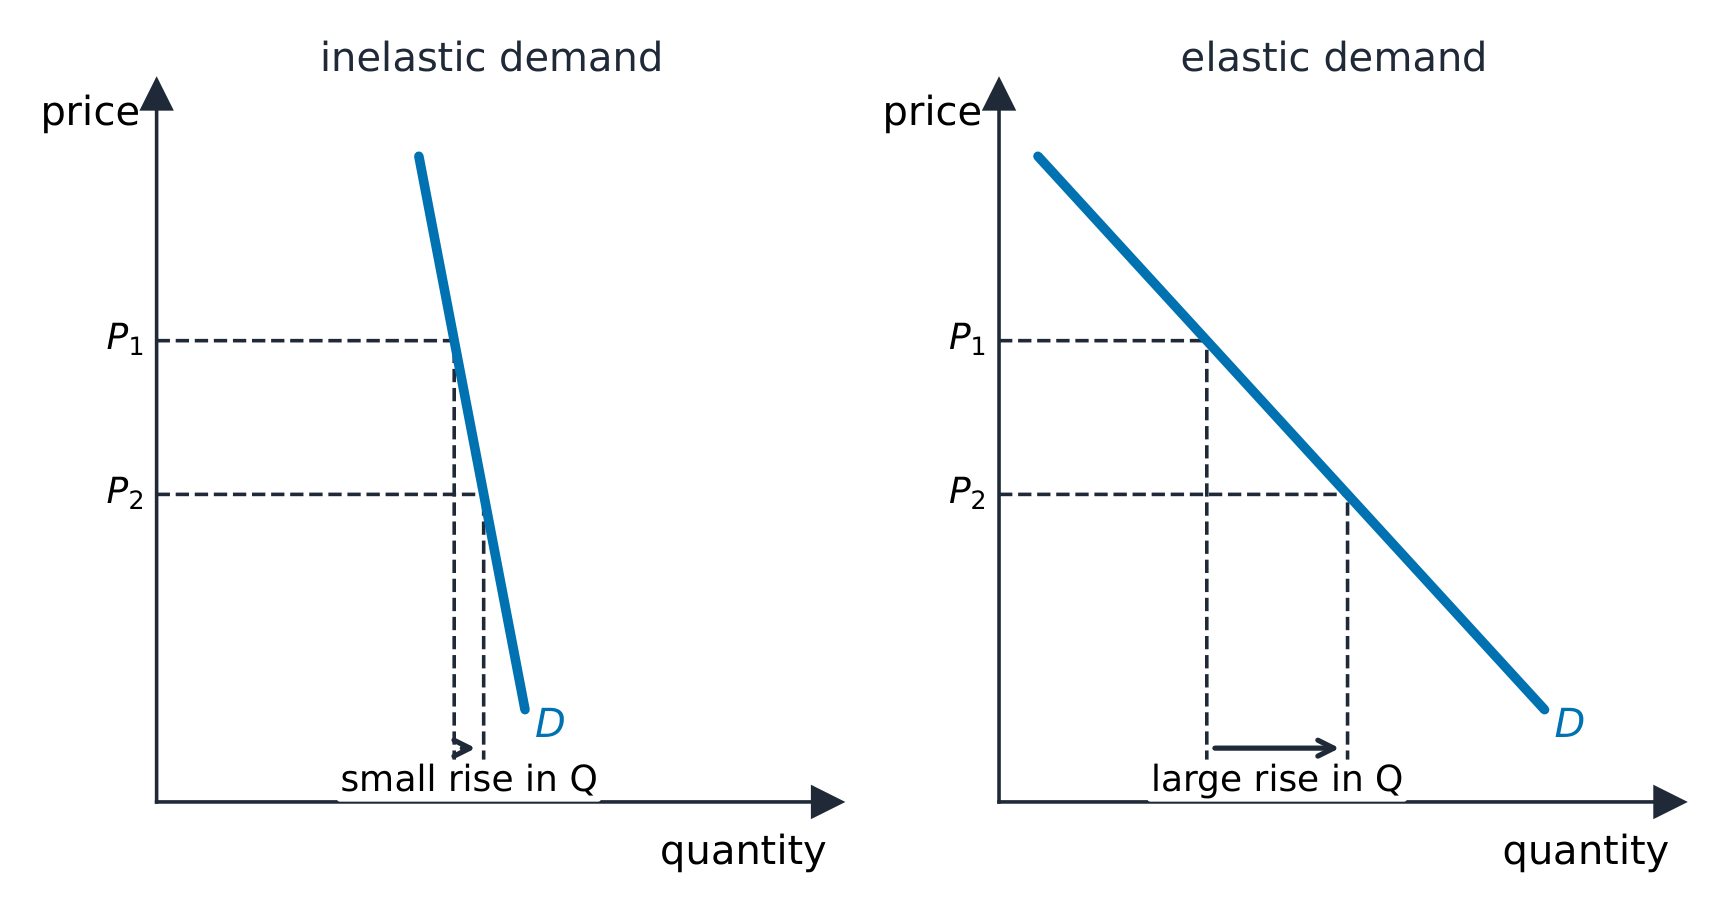
    Inelastic versus elastic demand:一个小 versus一个大response to a price change
    Inelastic versus elastic demand:一个小 versus一个大response to a price change
    • $E_d>1$: elastic (quantity responds strongly);
    • $E_d<1$: inelastic (quantity barely responds);
    • $E_d=1$: unit elastic.

    Demand is more elastic when there are more substitutes, the good is a luxury, it takes a large share of income, or buyers have more time to adjust. Elasticity links to total revenue ($P\times Q$): if demand is elastic, a price cut raises revenue; if inelastic, a price cut lowers it. Along a straight-line demand curve, elasticity falls as you move down (elastic on top, inelastic at the bottom).

    Worked example. A price rise from $\$10$ to $\$12$ (a $+20\%$ change) cuts quantity demanded from $100$ to $85$ (a $-15\%$ change). Then $E_d=\left|\dfrac{-15\%}{20\%}\right|=0.75<1$, so demand is inelastic. Because it is inelastic, the price rise raises total revenue: from $\$10\times100=\$1000$ to $\$12\times85=\$1020$.

    Explore · ⁨สำรวจ⁩

    Stretch price and measure elasticity · ⁨ยืดราคาและวัดความยืดหยุ่น⁩

    Price elasticity of demand is how strongly quantity responds to price. A steep curve is inelastic (small response); a shallow one is elastic (large response). · ⁨ความยืดหยุ่นของอุปสงค์ต่อราคา คือความแข็งแกร่งที่ปริมาณตอบสนองต่อราคา เส้นชันแสดงว่าเป็น ไม่ยืดหยุ่น (ตอบสนองน้อย); เส้นแบนแสดงว่าเป็น ยืดหยุ่น (ตอบสนองมาก)⁩

    Vocabulary · ⁨คำศัพท์⁩ Train · ⁨ฝึกฝน⁩
    English ไทย
    elastic/ɪˈlæstɪk/ ยืดหยุ่น
    inelastic/ɪnɪˈlæstɪk/ ไม่ยืดหยุ่น (inelastic)
    total revenue/ˈtəʊtl ˈrevənjuː/ รายได้รวม
    2.4

    Price Elasticity of Supply · ⁨ความยืดหยุ่นของอุปทานตามราคา⁩

    Syllabus · ⁨หลักสูตร⁩
    English

    Enduring Understanding (MKT-3): Individuals and firms respond to incentives and face constraints.

    Learning Objective MKT-3.E: a. Define measures of elasticity. b. Explain (using graphs where appropriate) measures of elasticity and the impact of a given price change on total revenue or total expenditure. c. Calculate (using data from a graph or a table as appropriate) measures of elasticity.

    • MKT-3.E.6 Price elasticity of supply is measured by the percentage change in quantity supplied divided by the percentage change in price, or the responsiveness of the quantity supplied to changes in price.
    • MKT-3.E.7 Ranges of values of elasticity of supply are described as elastic or inelastic with the separating benchmark being a magnitude of 1, where the change in the price and the change in the quantity supplied are proportional.
      • a. When the magnitude of the value of elasticity is greater than 1, the supply is described as being elastic with respect to that price in the range of the given change.
      • b. When the magnitude of the value of elasticity is less than 1, the supply is described as being inelastic with respect to that price in the range of the given change.
      • c. When the magnitude of the value of elasticity is equal to 1, the supply is described as being unit elastic with respect to that price in the range of the given change.
    • MKT-3.E.8 The price elasticity of supply depends on certain factors such as the price of alternative inputs.
    ไทย

    ความเข้าใจที่ยั่งยืน (MKT-3): บุคคลและองค์กรตอบสนองต่อแรงจูงใจและเผชิญกับข้อจำกัด

    วัตถุประสงค์การเรียนรู้ MKT-3.E: ก. นิยามวัดความยืดหยุ่น ข. อธิบาย (โดยใช้กราฟเมื่อเหมาะสม) วัดความยืดหยุ่นและผลกระทบของการเปลี่ยนแปลงราคาที่กำหนดต่อรายได้รวมหรือค่าใช้จ่ายรวม ค. คำนวณ (โดยใช้ข้อมูลจากกราฟหรือตารางเมื่อเหมาะสม) วัดความยืดหยุ่น

    • MKT-3.E.6 ความยืดหยุ่นของราคาต่อการเสนอขายวัดโดยการเปลี่ยนแปลงเป็นเปอร์เซ็นต์ในปริมาณเสนอขายหารด้วยการเปลี่ยนแปลงเป็นเปอร์เซ็นต์ในราคา หรือความไวของปริมาณเสนอขายต่อการเปลี่ยนแปลงในราคา
    • MKT-3.E.7 ช่วงค่าของความยืดหยุ่นของราคาต่อการเสนอขายถูกอธิบายว่าเป็นแบบยืดหยุ่นหรือแบบไม่ยืดหยุ่น โดยเกณฑ์แบ่งคือขนาดของ 1 ที่ซึ่งการเปลี่ยนแปลงในราคาและการเปลี่ยนแปลงในปริมาณเสนอขายเป็นสัดส่วนกัน
      • ก. เมื่อขนาดของค่าความยืดหยุ่นมีมากกว่า 1 การเสนอขายจะถูกอธิบายว่าเป็นแบบยืดหยุ่นเทียบกับราคานั้นในช่วงของการเปลี่ยนแปลงที่กำหนด
      • ข. เมื่อขนาดของค่าความยืดหยุ่นมีน้อยกว่า 1 การเสนอขายจะถูกอธิบายว่าเป็นแบบไม่ยืดหยุ่นเทียบกับราคานั้นในช่วงของการเปลี่ยนแปลงที่กำหนด
      • ค. เมื่อขนาดของค่าความยืดหยุ่นเท่ากับ 1 การเสนอขายจะถูกอธิบายว่าเป็นแบบยืดหยุ่นเท่ากันเทียบกับราคานั้นในช่วงของการเปลี่ยนแปลงที่กำหนด
    • MKT-3.E.8 ความยืดหยุ่นของราคาต่อการเสนอขายขึ้นอยู่กับปัจจัยบางประการ เช่น ราคาของปัจจัยการผลิตทางเลือก

    Source: College Board AP Course and Exam Description · ⁨แหล่งที่มา: คำอธิบายหลักสูตรและข้อสอบ College Board AP⁩

    English

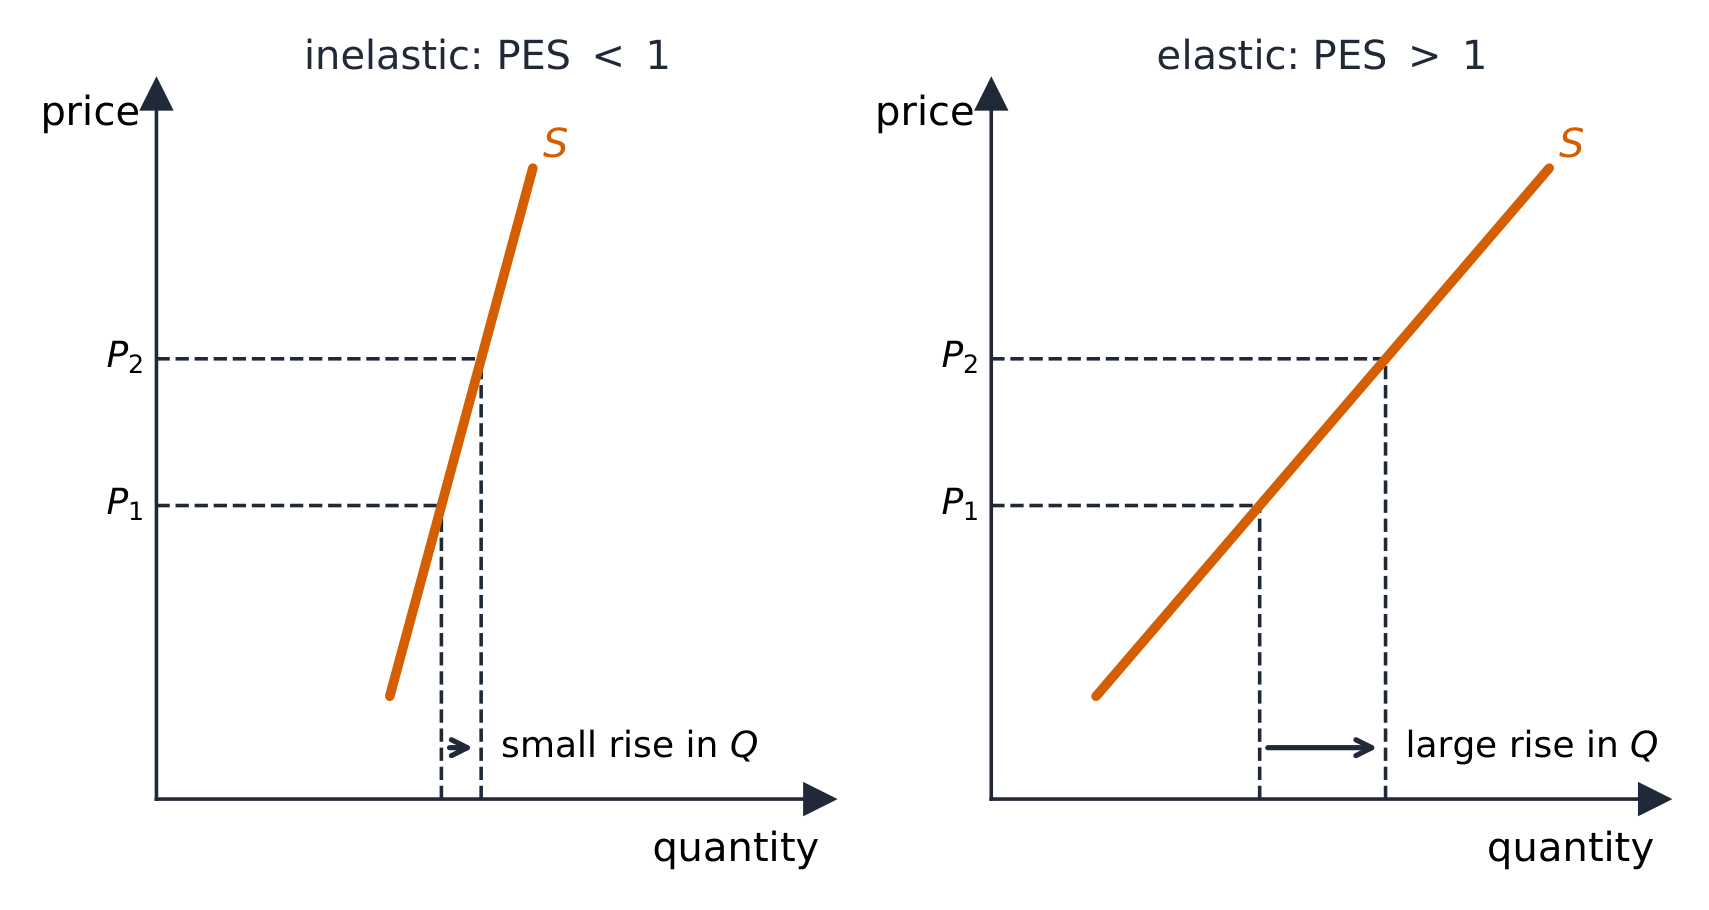
    Price elasticity of supply 供给价格弹性, $E_s=\dfrac{\%\ \Delta\ Q_s}{\%\ \Delta\ P}$, measures how responsive sellers are. Supply is more elastic when firms can adjust output easily – spare capacity, storable goods, and above all more time (supply is more elastic in the long run than the short run).

    ไทย

    Price elasticity of supply, $E_s=\dfrac{\%\ \Delta\ Q_s}{\%\ \Delta\ P}$, measures how responsive sellers are. Supply is more elastic when firms can adjust output easily – spare capacity, storable goods, and above all more time (supply is more elastic in the long run than the short run).

    The same price rise gives a small supply response when PES is below 1, a large one above 1
    The same price rise gives a small supply response when PES is below 1, a large one above 1
    Vocabulary · ⁨คำศัพท์⁩ Train · ⁨ฝึกฝน⁩
    English ไทย
    Price elasticity of supply/praɪs ɪlæˈstɪsɪti ɒv səˈplaɪ/ ความยืดหยุ่นของอุปทานต่อราคา (Price elasticity of supply)
    2.5

    Other Elasticities

    Syllabus · ⁨หลักสูตร⁩
    English

    Enduring Understanding (MKT-3): Individuals and firms respond to incentives and face constraints.

    Learning Objective MKT-3.E: a. Define measures of elasticity. b. Explain (using graphs where appropriate) measures of elasticity and the impact of a given price change on total revenue or total expenditure. c. Calculate (using data from a graph or a table as appropriate) measures of elasticity.

    • MKT-3.E.9 Elasticity can be measured for any determinant of demand or supply, not just the price.
    • MKT-3.E.10 Income elasticity of demand is measured by the percentage change in the quantity demanded divided by the percentage change in consumers' income. Economists use the income elasticity of demand to determine whether a good is normal or inferior.
    • MKT-3.E.11 Cross-price elasticity of demand is measured by the percentage change in the quantity demanded of one good divided by the percentage change in the price of another good. Economists use the cross-price elasticity of demand to determine whether goods are substitutes, complements, or not related.
    ไทย

    ความเข้าใจที่ยั่งยืน (MKT-3): บุคคลและองค์กรตอบสนองต่อแรงจูงใจและเผชิญกับข้อจำกัด

    วัตถุประสงค์การเรียนรู้ MKT-3.E: ก. นิยามวัดความยืดหยุ่น ข. อธิบาย (โดยใช้กราฟเมื่อเหมาะสม) วัดความยืดหยุ่นและผลกระทบของการเปลี่ยนแปลงราคาที่กำหนดต่อรายได้รวมหรือค่าใช้จ่ายรวม ค. คำนวณ (โดยใช้ข้อมูลจากกราฟหรือตารางเมื่อเหมาะสม) วัดความยืดหยุ่น

    • MKT-3.E.9 ความยืดหยุ่นสามารถวัดได้จากตัวกำหนดของการสงค์หรือการเสนอขายใดๆ ไม่ใช่เฉพาะราคาเท่านั้น
    • MKT-3.E.10 ความยืดหยุ่นของรายได้ต่อความต้องการวัดโดยการเปลี่ยนแปลงเป็นเปอร์เซ็นต์ในปริมาณต้องการหารด้วยการเปลี่ยนแปลงเป็นเปอร์เซ็นต์ในรายได้ของผู้บริโภค นักเศรษฐศาสตร์ใช้ความยืดหยุ่นของรายได้ต่อความต้องการเพื่อกำหนดว่าสินค้าเป็นแบบปกติหรือแบบต่ำ
    • MKT-3.E.11 ความยืดหยุ่นของความต้องการต่อราคาสินค้าอื่น วัดจากเปอร์เซ็นต์การเปลี่ยนแปลงในปริมาณต้องการของสินค้าหนึ่ง หารด้วยเปอร์เซ็นต์การเปลี่ยนแปลงในราคาของสินค้านั้น นักเศรษฐศาสตร์ใช้ความยืดหยุ่นของความต้องการต่อราคาสินค้าอื่นเพื่อพิจารณาว่าสินค้าเหล่านั้นเป็น替代品 (substitutes), สินค้าที่ Consumed together (complements) หรือไม่มีความสัมพันธ์กัน

    Source: College Board AP Course and Exam Description · ⁨แหล่งที่มา: คำอธิบายหลักสูตรและข้อสอบ College Board AP⁩

    English
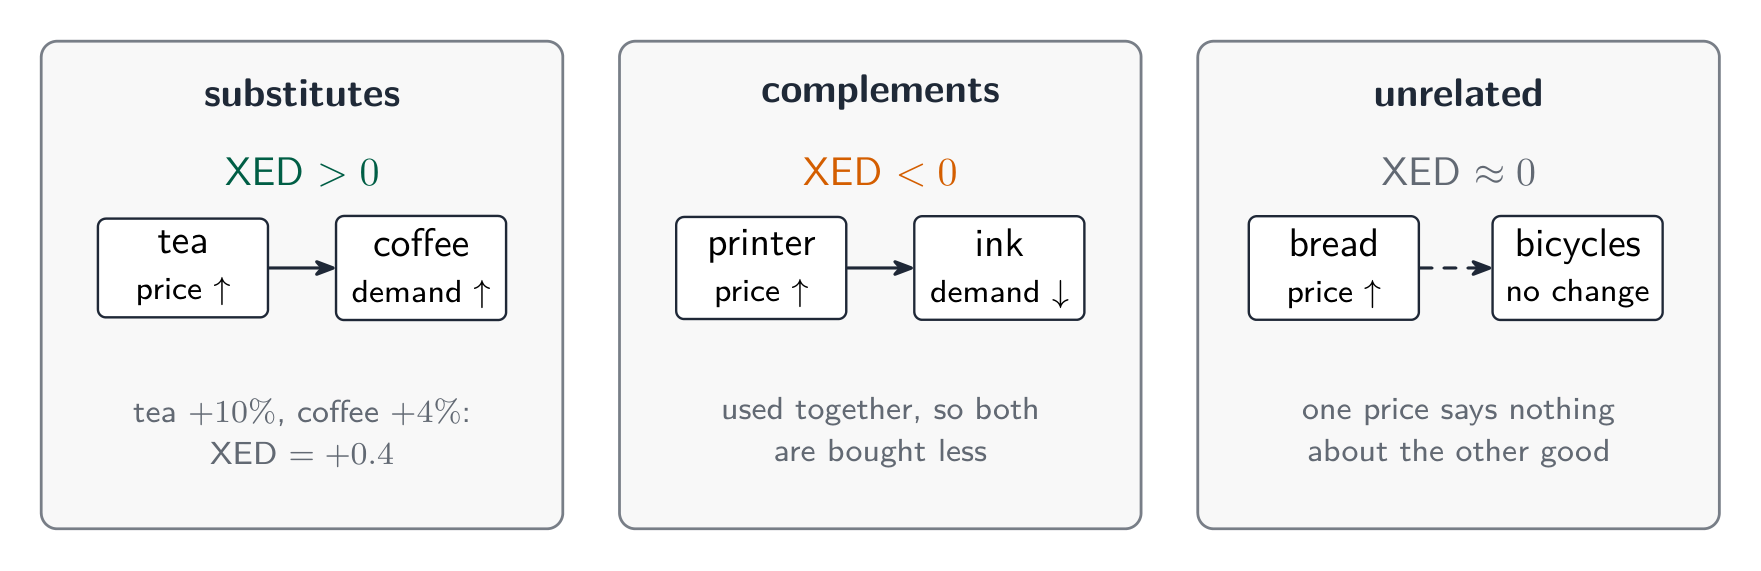
    • Cross-price elasticity 交叉价格弹性 $=\dfrac{\%\ \Delta\ Q_x}{\%\ \Delta\ P_y}$: positive for substitutes, negative for complements – the sign tells you the relationship.
    • Income elasticity 收入弹性 $=\dfrac{\%\ \Delta\ Q}{\%\ \Delta\ \text{income}}$: positive for normal goods (and $>1$ for luxuries), negative for inferior goods.

    Worked example. When the price of coffee rises $10\%$, the quantity of tea demanded rises $6\%$: cross-price elasticity $=\dfrac{+6\%}{+10\%}=+0.6$. The positive sign confirms coffee and tea are substitutes. If instead a $5\%$ rise in incomes raised restaurant-meal demand $10\%$, income elasticity $=\dfrac{10\%}{5\%}=+2$ – a normal good, and a luxury since it exceeds $1$.

    Exam skill: you are expected to compute an elasticity, classify it, and read a sign as evidence of substitute/complement or normal/inferior.

    ไทย
    • Cross-price elasticity $=\dfrac{\%\ \Delta\ Q_x}{\%\ \Delta\ P_y}$: positive for substitutes, negative for complements – the sign tells you the relationship.
    • Income elasticity $=\dfrac{\%\ \Delta\ Q}{\%\ \Delta\ \text{income}}$: positive for normal goods (and $>1$ for luxuries), negative for inferior goods.

    ตัวอย่างวิธีทำ: เมื่อราคากาแฟเพิ่มขึ้น $10\%$ ปริมาณชาที่ consumers ต้องการเพิ่มขึ้น $6\%$: ความยืดหยุ่นต่อราคาสัมพันธ์ $=\dfrac{+6\%}{+10\%}=+0.6$. ค่า บวก ยืนยันว่ากาแฟและชาเป็นสินค้า ทดแทนกัน. หากในทางกลับกัน การเพิ่มขึ้นของรายได้ $5\%$ ทำให้ความต้องการอาหารในร้านอาหารเพิ่มขึ้น $10\%$, ความยืดหยุ่นต่อรายได้ $=\dfrac{10\%}{5\%}=+2$ – เป็นสินค้าปกติ, และเป็นสินค้า ฟุ่มเฟือย เนื่องจากมีค่าเกิน $1$.

    ความยืดหยุ่นต่อราคาสัมพันธ์: บวกสำหรับสินค้าทดแทนกัน, ลบสำหรับสินค้าประกอบกัน
    ความยืดหยุ่นต่อราคาสัมพันธ์: บวกสำหรับสินค้าทดแทนกัน, ลบสำหรับสินค้าประกอบกัน

    ทักษะการสอบ: คุณควรมีความสามารถในการคำนวณความยืดหยุ่น, จำแนกประเภท, และอ่าน เครื่องหมาย เพื่อใช้หลักฐานยืนยันว่าเป็นสินค้าทดแทน/ประกอบกัน หรือสินค้าปกติ/ด้อยคุณภาพ

    Vocabulary · ⁨คำศัพท์⁩ Train · ⁨ฝึกฝน⁩
    English ไทย
    Cross-price elasticity/krɒs praɪs ɪlæˈstɪsɪti/ ความยืดหยุ่นของราคาข้าม
    Income elasticity/ˈɪŋkʌm ɪlæˈstɪsɪti/ ความยืดหยุ่นของรายได้
    2.6

    Market Equilibrium, Consumer Surplus, and Producer Surplus · ⁨จุดสมดุลตลาด, ส่วนต่างของผู้บริโภค, และส่วนต่างของผู้ผลิต⁩

    Syllabus · ⁨หลักสูตร⁩
    English

    Enduring Understanding (MKT-4): Although equilibria are stable, an economy can move from one equilibrium to another if market conditions change.

    Learning Objective MKT-4.A: a. Define (using graphs as appropriate) market equilibrium, consumer surplus, and producer surplus. b. Explain (using graphs as appropriate) how equilibrium price, quantity, consumer surplus, and producer surplus for a good or service are determined. c. Calculate (using data from a graph or table as appropriate) areas of consumer surplus and producer surplus at equilibrium.

    • MKT-4.A.1 The supply-demand model is a tool for understanding what factors influence prices and quantities and why prices and quantities might differ across markets or change over time.
    • MKT-4.A.2 In a perfectly competitive market, equilibrium is achieved (and markets clear with no shortages or surpluses) when the price of a good or service brings the quantity supplied and quantity demanded into balance, in the sense that buyers wish to purchase the same quantity that sellers wish to provide.
    • MKT-4.A.3 Equilibrium price provides information to economic decision-makers to guide resource allocation.
    • MKT-4.A.4 Economists use consumer surplus and producer surplus to measure the benefits markets create to buyers and sellers and understand market efficiency.
    • MKT-4.A.5 Market equilibrium maximizes total economic surplus in the absence of market failures, meaning that perfectly competitive markets are efficient.
    ไทย

    ความเข้าใจที่ยั่งยืน (MKT-4): แม้สมดุลจะมีความเสถียร แต่เศรษฐกิจสามารถเปลี่ยนผ่านจากจุดสมดุลหนึ่งไปยังอีกจุดหนึ่งได้หากสภาพตลาดเปลี่ยนแปลง

    วัตถุประสงค์การเรียนรู้ MKT-4.A: ก. นิยาม (โดยใช้กราฟเมื่อเหมาะสม) ความสมดุลของตลาด ส่วนเกินของผู้บริโภค และส่วนเกินของผู้ผลิต ข. อธิบาย (โดยใช้กราฟเมื่อเหมาะสม) ว่าราคาสมดุล ปริมาณ平衡, ส่วนเกินของผู้บริโภค และส่วนเกินของผู้ผลิตสำหรับสินค้าหรือบริการใด ๆ ถูกกำหนดอย่างไร ค. คำนวณ (โดยใช้ข้อมูลจากกราฟหรือตารางเมื่อเหมาะสม) พื้นที่ของส่วนเกินของผู้บริโภคและส่วนเกินของผู้ผลิตที่จุดสมดุล

    • MKT-4.A.1 โมเดลอุปสงค์-อุปทานคือเครื่องมือในการทำความเข้าใจปัจจัยที่มีผลต่อราคาและปริมาณ以及如何使不同ตลาดหรือตามเวลา differs in prices and quantities.
    • MKT-4.A.2 ในตลาดแข่งขันสมบูรณ์ จุดสมดุลจะถูกบรรลุ (และตลาด clears with no shortages or surpluses) เมื่อราคาของสินค้าหรือบริการทำให้ปริมาณเสนอขายและปริมาณต้องการอยู่ในสภาวะสมดุล โดยผู้ซื้อต้องการซื้อจำนวนเท่าที่ผู้ขายต้องการจำหน่าย
    • MKT-4.A.3 ราคาสมดุลให้ข้อมูลแก่ผู้ตัดสินใจทางเศรษฐกิจเพื่อوجيهการจัดสรรทรัพยากร
    • MKT-4.A.4 นักเศรษฐศาสตร์ใช้ส่วนเกินของผู้บริโภคและส่วนเกินของผู้ผลิตเพื่อวัดประโยชน์ที่ตลาดสร้างให้กับผู้ซื้อและผู้ขายและทำความเข้าใจประสิทธิภาพของตลาด
    • MKT-4.A.5 ความสมดุลของตลาดเพิ่มส่วนเกินทางเศรษฐกิจรวมสูงสุดเมื่อไม่มีการล้มเหลวของตลาด ซึ่งหมายความว่าตลาดแข่งขันสมบูรณ์มีประสิทธิภาพ

    Source: College Board AP Course and Exam Description · ⁨แหล่งที่มา: คำอธิบายหลักสูตรและข้อสอบ College Board AP⁩

    English
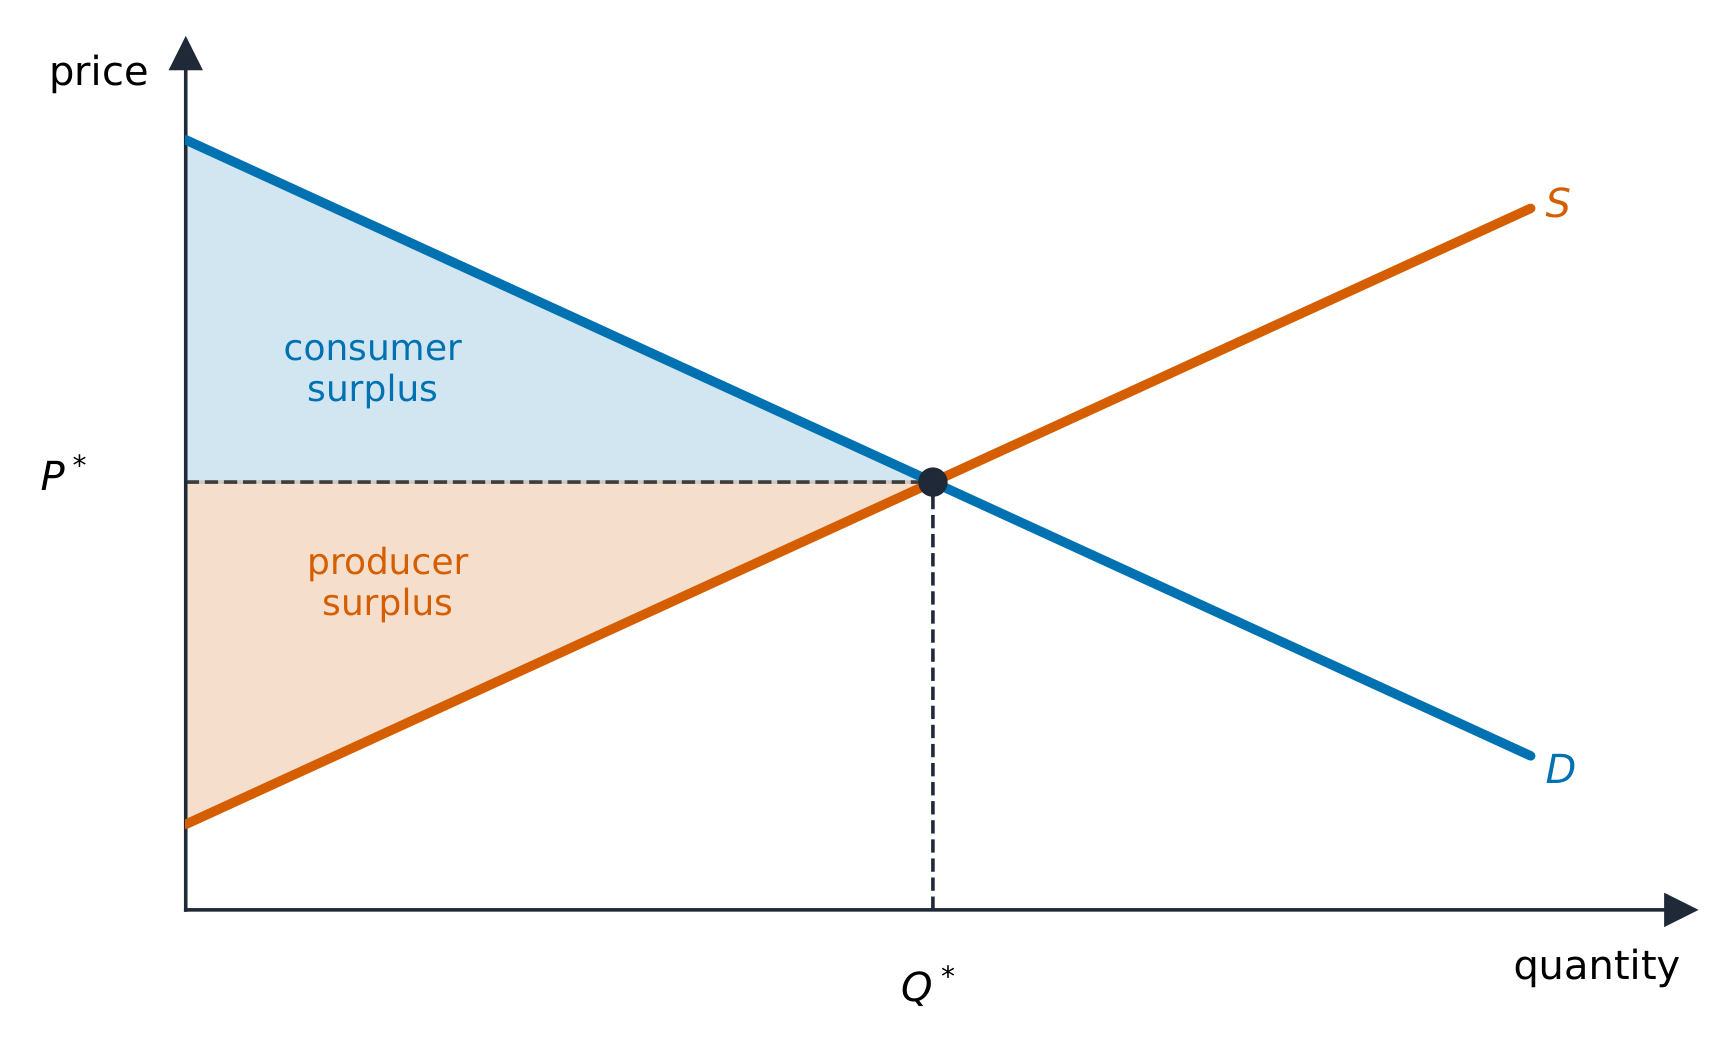
    Consumer & producer surplus

    Equilibrium 均衡 is where supply meets demand: the equilibrium price clears the market, so quantity demanded equals quantity supplied and there is no shortage or surplus.

    • Consumer surplus 消费者剩余 is the area below the demand curve and above the price – the gap between what buyers would pay and what they do pay.
    • Producer surplus 生产者剩余 is the area above the supply curve and below the price – the gap between the price and sellers' minimum acceptable price.
    • Their sum is total surplus 总剩余, and the competitive equilibrium maximizes it – this is why free markets are called allocatively efficient 配置有效率.
    ไทย
    ส่วนเกินของผู้บริโภคและผู้ผลิต

    จุดสมดุล คือจุดที่_supply_碰到了_demand_: ราคาสมดุล ช่วยเคลียร์ตลาด ทำให้ปริมาณที่ต้องการเท่ากับปริมาณที่เสนอขาย และไม่มีการขาดแคลนหรือ surplus

    Consumer surplus and producer surplus at the market equilibrium
    Consumer surplus และ producer surplus ที่จุดสมดุลของตลาด
    • ส่วนต่างของผู้บริโภค (Consumer surplus) คือพื้นที่ ใต้เส้น demand และเหนือราคา –也就是差 between ผู้ซื้อยินดีจ่ายและผู้ซื้อจ่ายจริง
    • ส่วนต่างของผู้ผลิต (Producer surplus) คือพื้นที่ เหนือเส้น supply และใต้ราคา –也就是差 between ราคาและ最低 acceptable price ของผู้ขาย
    • ผลรวมของทั้งสองคือ ส่วนต่างรวม (Total surplus), และจุดสมดุลแบบแข่งขันจะ เพิ่มสูงสุด มันนี่เอง – นี่คือเหตุผลที่ตลาดเสรีถูกเรียกว่า allocatively efficient
    ร้านขายผลไม้และผักในตลาด
    ตลาดจริง: ผู้ซื้อและผู้ขายจำนวนมากมาพบกัน, และราคาจะตกผลึกอยู่ที่จุดที่ปริมาณที่ต้องการเท่ากับปริมาณที่เสนอขาย
    Explore · ⁨สำรวจ⁩

    See consumer and producer surplus · ⁨เห็นส่วนเกินของผู้บริโภคและผู้ผลิต⁩

    At equilibrium the market clears. The gap between what buyers would pay and the price is consumer surplus; the gap above sellers' costs is producer surplus. · ⁨ที่จุด สมดุล ตลาดจะ clears ส่วนต่างระหว่างสิ่งที่ผู้ซื้อยินดีจ่ายกับราคาจริงคือ ส่วนเกินของผู้บริโภค; ส่วนต่างเหนือต้นทุนของผู้ขายคือ ส่วนเกินของผู้ผลิต⁩

    Vocabulary · ⁨คำศัพท์⁩ Train · ⁨ฝึกฝน⁩
    English ไทย
    Equilibrium/ˌiːkwɪˈlɪbrɪəm/ สมดุล
    Consumer surplus/kənˈsuːmə ˈsɜːpləs/ ส่วนเกินของผู้บริโภค
    Producer surplus/prəˈdjuːsə ˈsɜːpləs/ ส่วนเกินของผู้ผลิต
    total surplus/ˈtəʊtl ˈsɜːpləs/ ส่วนเกินรวม
    allocatively efficient/ˈæləkətɪvli ɪˈfɪʃənt/ allocatively efficient
    surplus/ˈsɜːpləs/ ส่วนเกิน
    2.7

    Market Disequilibrium and Changes in Equilibrium · ⁨ความไม่สมดุลของตลาดและการเปลี่ยนแปลงจุดสมดุล⁩

    Syllabus · ⁨หลักสูตร⁩
    English

    Enduring Understanding (MKT-4): Although equilibria are stable, an economy can move from one equilibrium to another if market conditions change.

    Learning Objective MKT-4.B: a. Define a surplus and shortage. b. Explain (using graphs where appropriate) how changes in underlying conditions and shocks to a competitive market can alter price, quantity, consumer surplus, and producer surplus. c. Calculate (using data from a graph or table as appropriate) changes in price, quantity, consumer surplus, and producer surplus in response to changes in market conditions or market disequilibrium.

    • MKT-4.B.1 Whenever markets experience imbalances—creating disequilibrium prices and quantities, surpluses, and shortages—market forces drive price and quantity toward equilibrium.
    • MKT-4.B.2 Factors that shift the market demand and market supply curves cause price, quantity, consumer surplus, producer surplus, and total economic surplus (within that market) to change. The impact of the change depends on the price elasticities of demand and supply.
    ไทย

    ความเข้าใจที่ยั่งยืน (MKT-4): แม้สมดุลจะมีความเสถียร แต่เศรษฐกิจสามารถเปลี่ยนผ่านจากจุดสมดุลหนึ่งไปยังอีกจุดหนึ่งได้หากสภาพตลาดเปลี่ยนแปลง

    วัตถุประสงค์การเรียนรู้ MKT-4.B: ก. นิยามส่วนเกินและส่วนขาด ข. อธิบาย (โดยใช้กราฟเมื่อเหมาะสม) การเปลี่ยนแปลงในเงื่อนไขพื้นฐานและการกระแทกต่อตลาดแข่งขันสามารถเปลี่ยนแปลงราคา ปริมาณ ส่วนเกินของผู้บริโภค และส่วนเกินของผู้ผลิตได้อย่างไร ค. คำนวณ (โดยใช้ข้อมูลจากกราฟหรือตารางเมื่อเหมาะสม) การเปลี่ยนแปลงของราคา ปริมาณ ส่วนเกินของผู้บริโภค และส่วนเกินของผู้ผลิตตอบสนองต่อการเปลี่ยนแปลงในสภาพตลาดหรือความไม่สมดุลของตลาด

    • MKT-4.B.1 ทุกครั้งที่ตลาดประสบความไม่สมดุล—ซึ่งก่อให้เกิดราคาและความไม่สมดุลของปริมาณ surplus และ shortage—แรงกดดันของตลาดจะผลักราคาและปริมาณเข้าหาจุดสมดุล
    • MKT-4.B.2 ปัจจัยที่ทำให้เส้นโค้งอุปสงค์ตลาดและอุปทานตลาด shift ทำให้ราคา ปริมาณ ส่วนเกินของผู้บริโภค ส่วนเกินของผู้ผลิต และส่วนเกินทางเศรษฐกิจรวม (ภายในตลาดนั้น) เปลี่ยนแปลง ผลกระทบของการเปลี่ยนแปลงขึ้นอยู่กับความยืดหยุ่นของราคาของอุปสงค์และอุปทาน

    Source: College Board AP Course and Exam Description · ⁨แหล่งที่มา: คำอธิบายหลักสูตรและข้อสอบ College Board AP⁩

    English

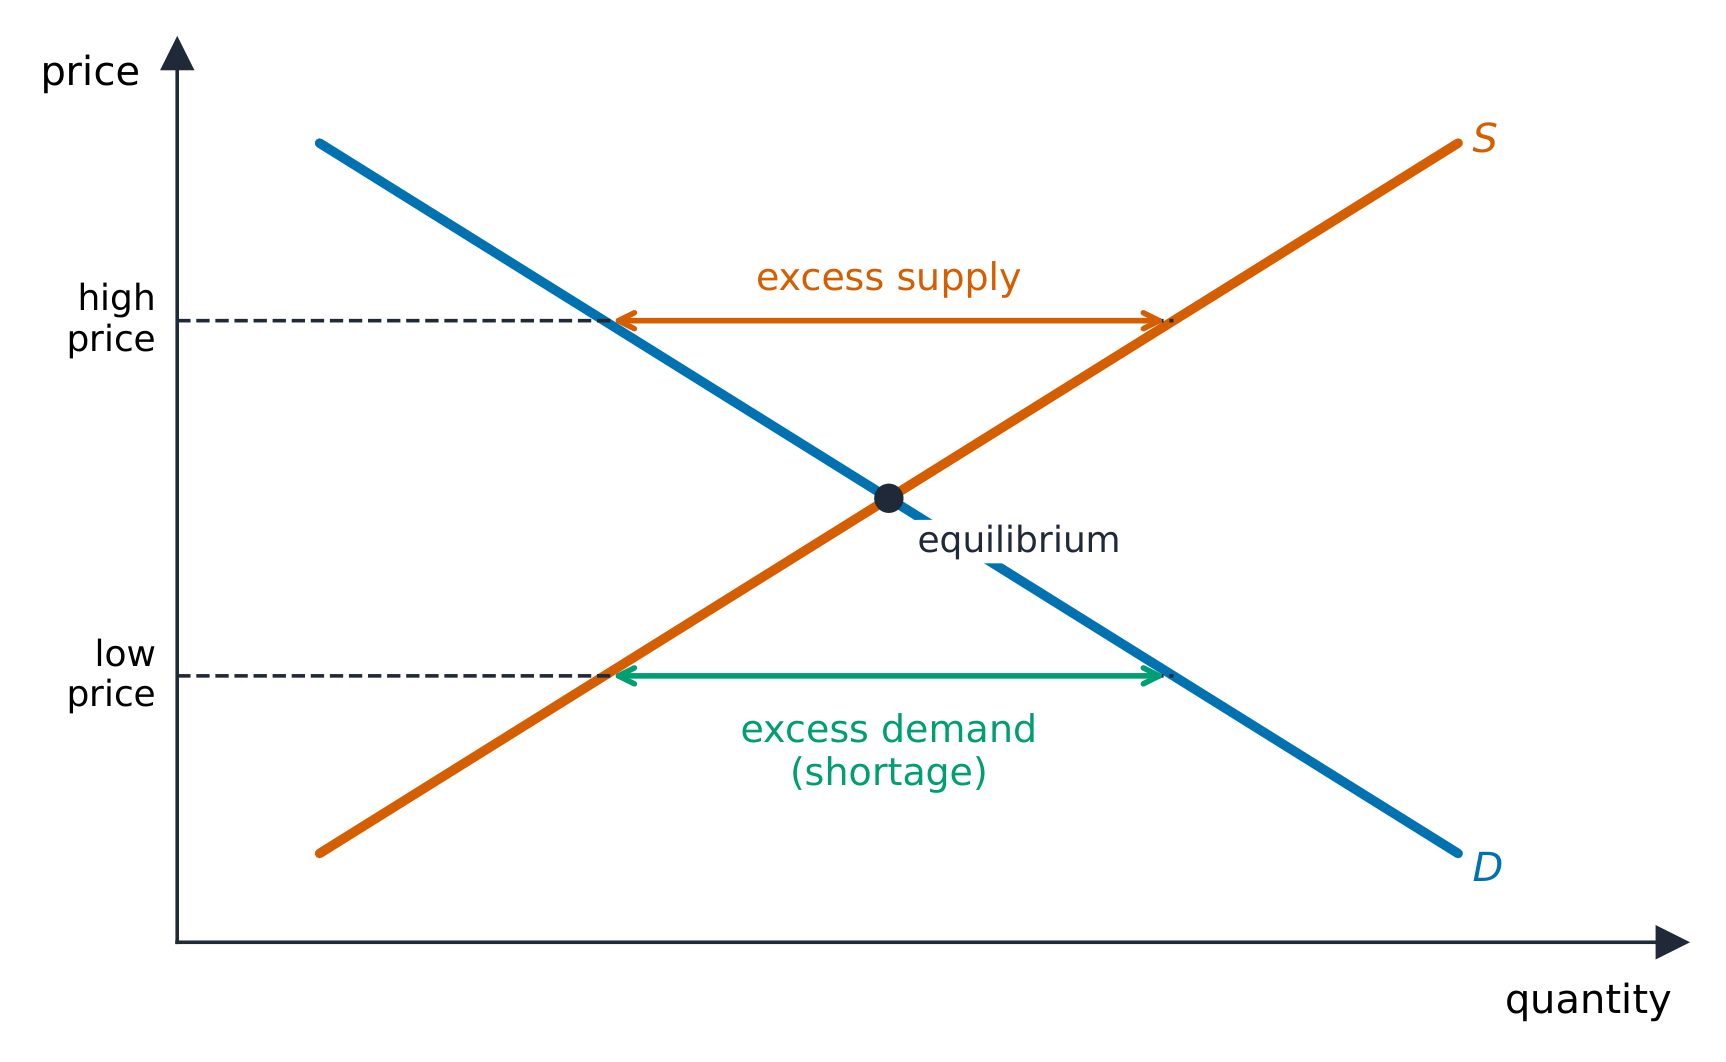
    Away from equilibrium the market self-corrects: above the equilibrium price there is a surplus 过剩 (excess supply) that pushes price down; below it a shortage 短缺 (excess demand) that pushes price up.

    When a determinant shifts a curve, the equilibrium moves predictably. A single shift gives a definite result for both price and quantity. When both curves shift, one of price or quantity is indeterminate (depends on the relative sizes of the shifts) – a favorite exam trap. Work these out by drawing the shifts.

    ไทย

    เมื่อห่างจากจุดสมดุล ตลาดจะปรับตัวเอง: เหนือราคาสมดุลจะมี surplus (excess supply) ซึ่งดันราคาให้ลดลง; ต่ำกว่านั้นจะมี shortage (excess demand) ซึ่งดันราคาให้สูงขึ้น

    เหนือจุดสมดุลมี excess supply; ต่ำกว่ามี excess demand
    เหนือจุดสมดุลมี excess supply; ต่ำกว่ามี excess demand

    เมื่อตัวกำหนดหนึ่งอย่างทำให้เส้น curve เคลื่อนที่ จุดสมดุลจะเคลื่อนที่ได้อย่าง predictable. การ shift เดียว ให้ผลลัพธ์ที่แน่นอนสำหรับทั้งราคาและปริมาณ. แต่เมื่อ ทั้งสอง เส้น curve เคลื่อนที่ ราคาคือปริมาณอย่างใดอย่างหนึ่งจะเป็น indeterminate (ขึ้นอยู่กับขนาดสัมพัทธ์ของการ shift) – ซึ่งเป็นกับดักการสอบยอดนิยม. ทำโจทย์เหล่านี้ได้โดยการวาดกราฟแสดงการ shift

    Vocabulary · ⁨คำศัพท์⁩ Train · ⁨ฝึกฝน⁩
    English ไทย
    shortage/ˈʃɔːtɪdʒ/ ขาดแคลน
    2.8

    The Effects of Government Intervention in Markets · ⁨ผลกระทบของการแทรกแซงของรัฐบาลในตลาด⁩

    Syllabus · ⁨หลักสูตร⁩
    English

    Enduring Understanding (POL-1): Government policies influence consumer and producer behavior and therefore affect market outcomes.

    Learning Objective POL-1.A: a. Define forms of government price and quantity intervention. b. Explain (using graphs where appropriate) how government policies alter consumer and producer behaviors that influence incentives and therefore affect outcomes. c. Calculate (using data from a graph or table where appropriate) changes in market outcomes resulting from government policies.

    • POL-1.A.1 Some government policies, such as price floors, price ceilings, and other forms of price and quantity regulation, affect incentives and outcomes in all market structures.
    • POL-1.A.2 Governments use taxes and subsidies to change incentives in ways that influence consumer and producer behavior, shifting the supply and demand curves accordingly.
    • POL-1.A.3 Taxes and subsidies affect government revenues or costs.
    • POL-1.A.4 Government intervention in a market producing the efficient quantity through taxes, subsidies, price controls, or quantity controls can only decrease allocative efficiency.
    • POL-1.A.5 Deadweight loss represents the losses to buyers and sellers as a result of government intervention in an efficient market.
    • POL-1.A.6 The incidence of taxes and subsidies imposed on goods traded in perfectly competitive markets depends on the elasticity of supply and demand.
    ไทย

    ความเข้าใจที่ยั่งยืน (POL-1): นโยบายของรัฐบาลมีผลต่อพฤติกรรมของผู้บริโภคและผู้ผลิต ดังนั้นจึงส่งผลกระทบต่อผลลัพธ์ของตลาด

    จุดประสงค์การเรียนรู้ POL-1.A: ก. นิยามรูปแบบต่างๆ ของการแทรกแซงราคาและปริมาณของรัฐบาล ข. อธิบาย (โดยใช้กราฟเมื่อเหมาะสม) นโยบายของรัฐบาลเปลี่ยนแปลงพฤติกรรมของผู้บริโภคและผู้ผลิตที่มีผลต่อแรงจูงใจอย่างไร และส่งผลต่อผลลัพธ์อย่างไร ค. คำนวณ (โดยใช้ข้อมูลจากกราฟหรือตารางเมื่อเหมาะสม) การเปลี่ยนแปลงของผลลัพธ์ในตลาดที่เกิดจากนโยบายของรัฐบาล

    • POL-1.A.1 นโยบายบางอย่างของรัฐบาล เช่น ราคาขั้นต่ำ ราคาสูงสุด และการควบคุมราคาและรูปแบบอื่นๆ มีผลต่อแรงจูงใจและผลลัพธ์ในทุกโครงสร้างตลาด
    • POL-1.A.2 รัฐบาลใช้ภาษีและเงินอุดหนุนเพื่อเปลี่ยนแปลงแรงจูงใจในลักษณะที่ส่งผลต่อพฤติกรรมของผู้บริโภคและผู้ผลิต โดย shifting เส้น供需 accordingly.
    • POL-1.A.3 ภาษีและเงินอุดหนุนมีผลต่อรายได้หรือต้นทุนของรัฐบาล
    • POL-1.A.4 การแทรกแซงของรัฐบาลในตลาดที่ผลิตปริมาณที่มีประสิทธิภาพผ่านภาษี เงินอุดหนุน การควบคุมราคา หรือการควบคุมปริมาณ สามารถลดประสิทธิภาพในการจัดสรรทรัพยากรได้เพียงอย่างเดียวเท่านั้น
    • POL-1.A.5 Deadweight loss แสดงถึงการสูญเสียของผู้ซื้อและผู้ขายอันเนื่องมาจากการแทรกแซงของรัฐบาลในตลาดที่มีประสิทธิภาพ
    • POL-1.A.6 การกระจายภาระของภาษีและเงินอุดหนุนที่เก็บกับสินค้าที่ซื้อขายในตลาดแข่งขันสมบูรณ์ขึ้นอยู่กับความยืดหยุ่นของอุปทานและอุปสงค์

    Source: College Board AP Course and Exam Description · ⁨แหล่งที่มา: คำอธิบายหลักสูตรและข้อสอบ College Board AP⁩

    English
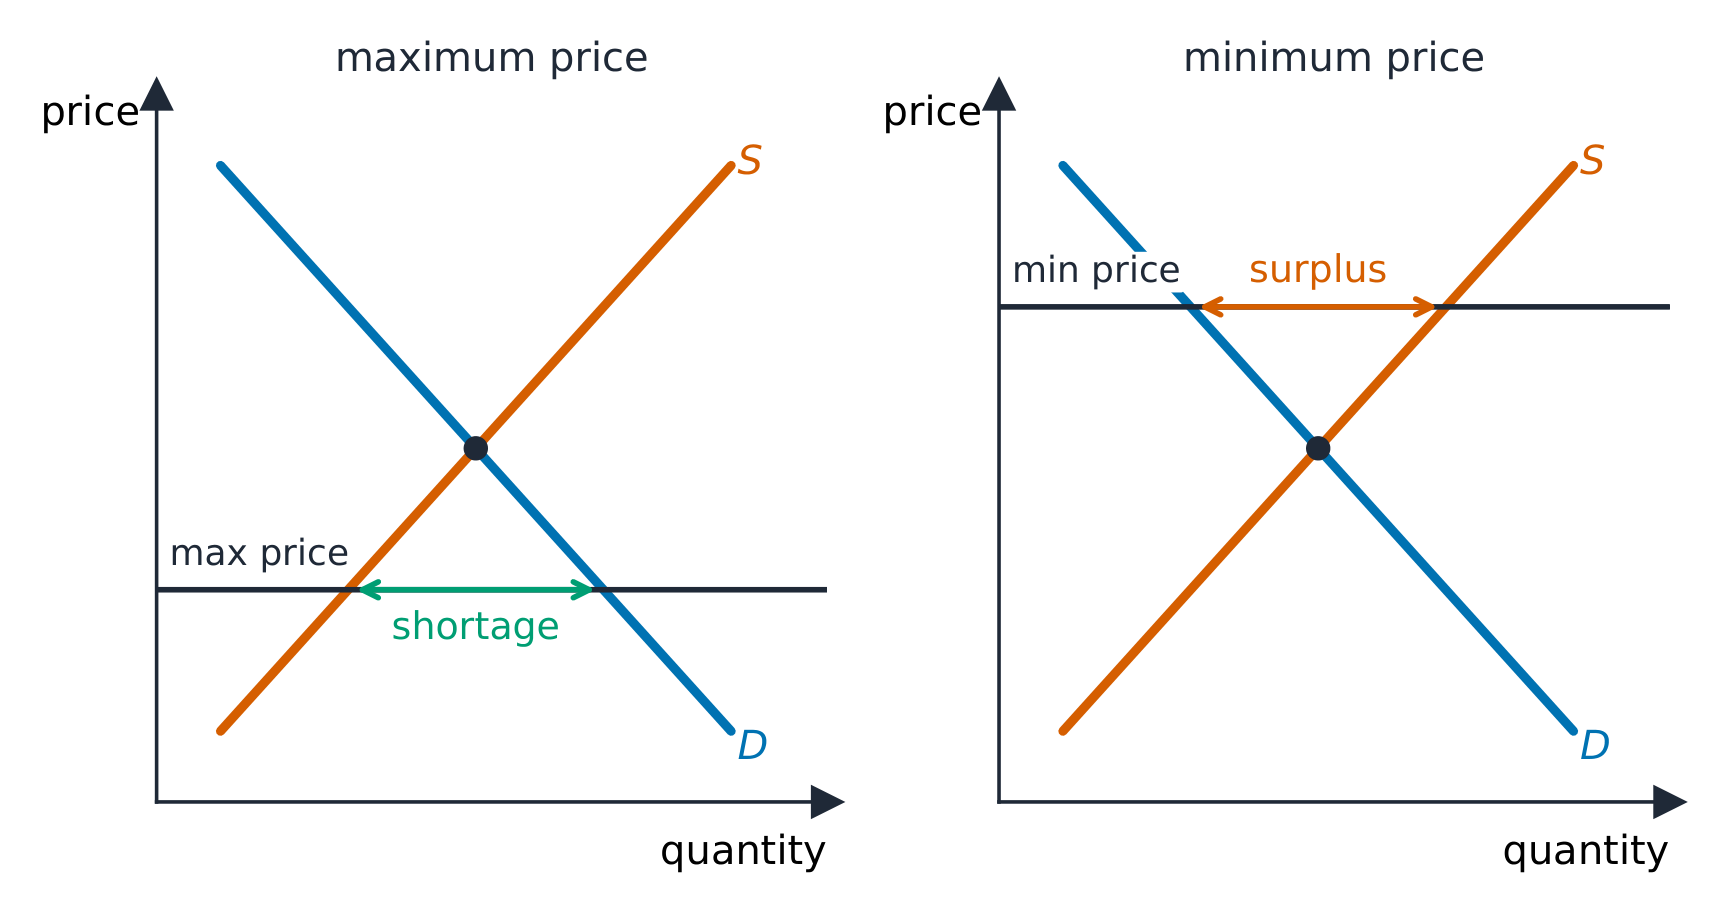
    A price ceiling causes a shortage
    A tax and the deadweight loss

    Governments intervene, usually reducing total surplus:

    • A price ceiling 价格上限 (a legal maximum, like rent control) below equilibrium causes a persistent shortage.
    • A price floor 价格下限 (a legal minimum, like a minimum wage) above equilibrium causes a persistent surplus.
    • An excise tax 消费税 shifts supply up by the tax; the burden (tax incidence 税收归宿) falls more heavily on whichever side is more inelastic.
    • A subsidy shifts supply down, raising quantity.

    Each of these creates deadweight loss 无谓损失 – mutually beneficial trades that no longer happen, shown as a triangle between the curves at the new quantity.

    Exam skill: on a graph, be able to shade consumer surplus, producer surplus, government revenue from a tax, and deadweight loss, and say who bears the tax and why.

    ไทย
    Price ceiling ทำให้เกิด shortage
    Tax และ deadweight loss

    รัฐบาลแทรกแซงตลาด โดยมักจะทำให้ total surplus ลดลง:

    Price ceiling ทำให้เกิด shortage; Price floor ทำให้เกิด surplus
    Price ceiling ทำให้เกิด shortage; Price floor ทำให้เกิด surplus
    • Price ceiling (限价สูงสุดตามกฎหมาย, เช่น การควบคุมค่าเช่า) ต่ำกว่าจุดสมดุลจะทำให้เกิด shortage อย่างถาวร
    • Price floor (限价最低ตามกฎหมาย, เช่น เงินเดือนขั้นต่ำ) สูงกว่าจุดสมดุลจะทำให้เกิด surplus อย่างถาวร
    • Excise tax ทำให้เส้น supply เคลื่อนขึ้นตามจำนวนภาษี; ภาระ (tax incidence) จะตกหนักไปทางฝั่งไหนก็ตามที่เป็น more inelastic
    • Subsidy ทำให้เส้น supply เคลื่อนลง เพิ่มปริมาณการผลิต

    ทุกกรณีเหล่านี้สร้าง deadweight loss –也就是交易 mutually beneficial ที่ไม่เกิดขึ้นอีกต่อไป แสดงเป็นสามเหลี่ยมระหว่างเส้น curves ที่ปริมาณใหม่

    ทักษะการสอบ: ในกราฟ สามารถ shading ส่วนต่างของผู้บริโภค, ส่วนต่างของผู้ผลิต, รายได้รัฐบาลจากภาษี, และ deadweight loss ได้ บอกได้ว่าใครเป็นผู้รับภาระภาษีและทำไมถึงเป็นเช่นนั้น

    Explore · ⁨สำรวจ⁩

    Add a tax or price control · ⁨เพิ่มภาษีหรือการควบคุมราคา⁩

    A price ceiling below equilibrium causes shortages; a tax drives a wedge between what buyers pay and sellers get, shrinking the quantity traded. · ⁨เพดานราคา ที่ต่ำกว่าจุดสมดุลทำให้เกิดภาวะขาดแคลน; ภาษี สร้างช่องว่างระหว่างสิ่งที่ผู้ซื้อจ่ายและผู้ขายได้รับ ลดปริมาณการซื้อขายลง⁩

    Vocabulary · ⁨คำศัพท์⁩ Train · ⁨ฝึกฝน⁩
    English ไทย
    price ceiling/praɪs ˈsiːlɪŋ/ เพดานราคา
    price floor/praɪs flɔː/ ราคาขั้นต่ำ (price floor)
    excise tax/ekˈsaɪz tæks/ ภาษี Consumption excise tax
    tax incidence/tæks ˈɪnsɪdəns/ ภาระภาษี
    deadweight loss/ˈdedweɪt lɒs/ deadweight loss
    2.9

    International Trade and Public Policy · ⁨การค้าระหว่างประเทศและนโยบายสาธารณะ⁩

    Syllabus · ⁨หลักสูตร⁩
    English

    Enduring Understanding (POL-1): Government policies influence consumer and producer behavior and therefore affect market outcomes.

    Learning Objective POL-1.B: a. Define tariffs and quotas. b. Explain (using graphs where appropriate) how markets are affected by public policy related to international trade. c. Calculate (using data from a graph or table as appropriate) changes in market outcomes resulting from public policy related to international trade.

    • POL-1.B.1 Equilibria in competitive markets may be altered by the decision to open an economy to trade with other countries; equilibrium price can be higher or lower than under autarky, and the gap between domestic supply and demand is filled by trade. Opening an economy to trade with other countries affects consumer surplus, producer surplus, and total economic surplus.
    • POL-1.B.2 Tariffs, which governments sometimes use to influence international trade, affect domestic price, quantity, government revenue, and consumer surplus and total economic surplus.
    • POL-1.B.3 Quotas can be used to alter quantities produced and therefore affect price, consumer surplus, and total economic surplus.
      • Exclusion statement: The graphing of quotas is beyond the scope of the course and the AP Exam, but understanding how quotas affect quantities produced is within the scope.
    ไทย

    ความเข้าใจที่ยั่งยืน (POL-1): นโยบายของรัฐบาลมีผลต่อพฤติกรรมของผู้บริโภคและผู้ผลิต ดังนั้นจึงส่งผลกระทบต่อผลลัพธ์ของตลาด

    วัตถุประสงค์การเรียนรู้ POL-1.B: ก. นิยามภาษีศุลกากรและโควตา ข. อธิบาย (โดยใช้กราฟเมื่อเหมาะสม) ตลาดได้รับผลกระทบจากนโยบายสาธารณะที่เกี่ยวข้องกับการค้าระหว่างประเทศอย่างไร ค. คำนวณ (โดยใช้ข้อมูลจากกราฟหรือตารางเมื่อเหมาะสม) การเปลี่ยนแปลงของผลลัพธ์ในตลาดที่เกิดจากนโยบายสาธารณะที่เกี่ยวข้องกับการค้าระหว่างประเทศ

    • POL-1.B.1 จุดสมดุลในตลาดแข่งขันอาจถูกเปลี่ยนแปลงด้วยการตัดสินใจเปิดเศรษฐกิจให้ค้ากับประเทศอื่น; ราคาสมดุลอาจสูงกว่าหรือต่ำกว่าภายใต้ Autarky และช่องว่างระหว่างอุปทานและอุปทานในประเทศจะถูกเติมเต็มผ่านการค้า การเปิดเศรษฐกิจให้ค้ากับประเทศอื่นมีผลต่อส่วนเกินของผู้บริโภค ส่วนเกินของผู้ผลิต และส่วนเกินทางเศรษฐกิจรวม
    • POL-1.B.2 ภาษีศุลกากร ซึ่งรัฐบาลบางครั้งใช้เพื่อส่งอิทธิพลต่อการค้าระหว่างประเทศ ส่งผลต่อราคาภายในประเทศ ปริมาณ รายได้ของรัฐบาล และส่วนเกินของผู้บริโภคและส่วนเกินทางเศรษฐกิจรวม
    • POL-1.B.3 โควตาสามารถใช้เพื่อเปลี่ยนแปลงปริมาณการผลิตและดังนั้นจึงส่งผลต่อราคา ส่วนเกินของผู้บริโภค และส่วนเกินทางเศรษฐกิจรวม
      • ข้อจำกัด: การวาดกราฟของโควตานอกเหนือขอบเขตของหลักสูตรและข้อสอบ AP แต่ความเข้าใจว่าโควตามีผลต่อปริมาณการผลิตอยู่ ضمنขอบเขต

    Source: College Board AP Course and Exam Description · ⁨แหล่งที่มา: คำอธิบายหลักสูตรและข้อสอบ College Board AP⁩

    English

    When a country opens to trade at a world price 世界价格:

    • If the world price is below the domestic price, the country imports 进口 – consumers gain more than producers lose, so total surplus rises.
    • If the world price is above the domestic price, the country exports 出口 – producers gain more than consumers lose.

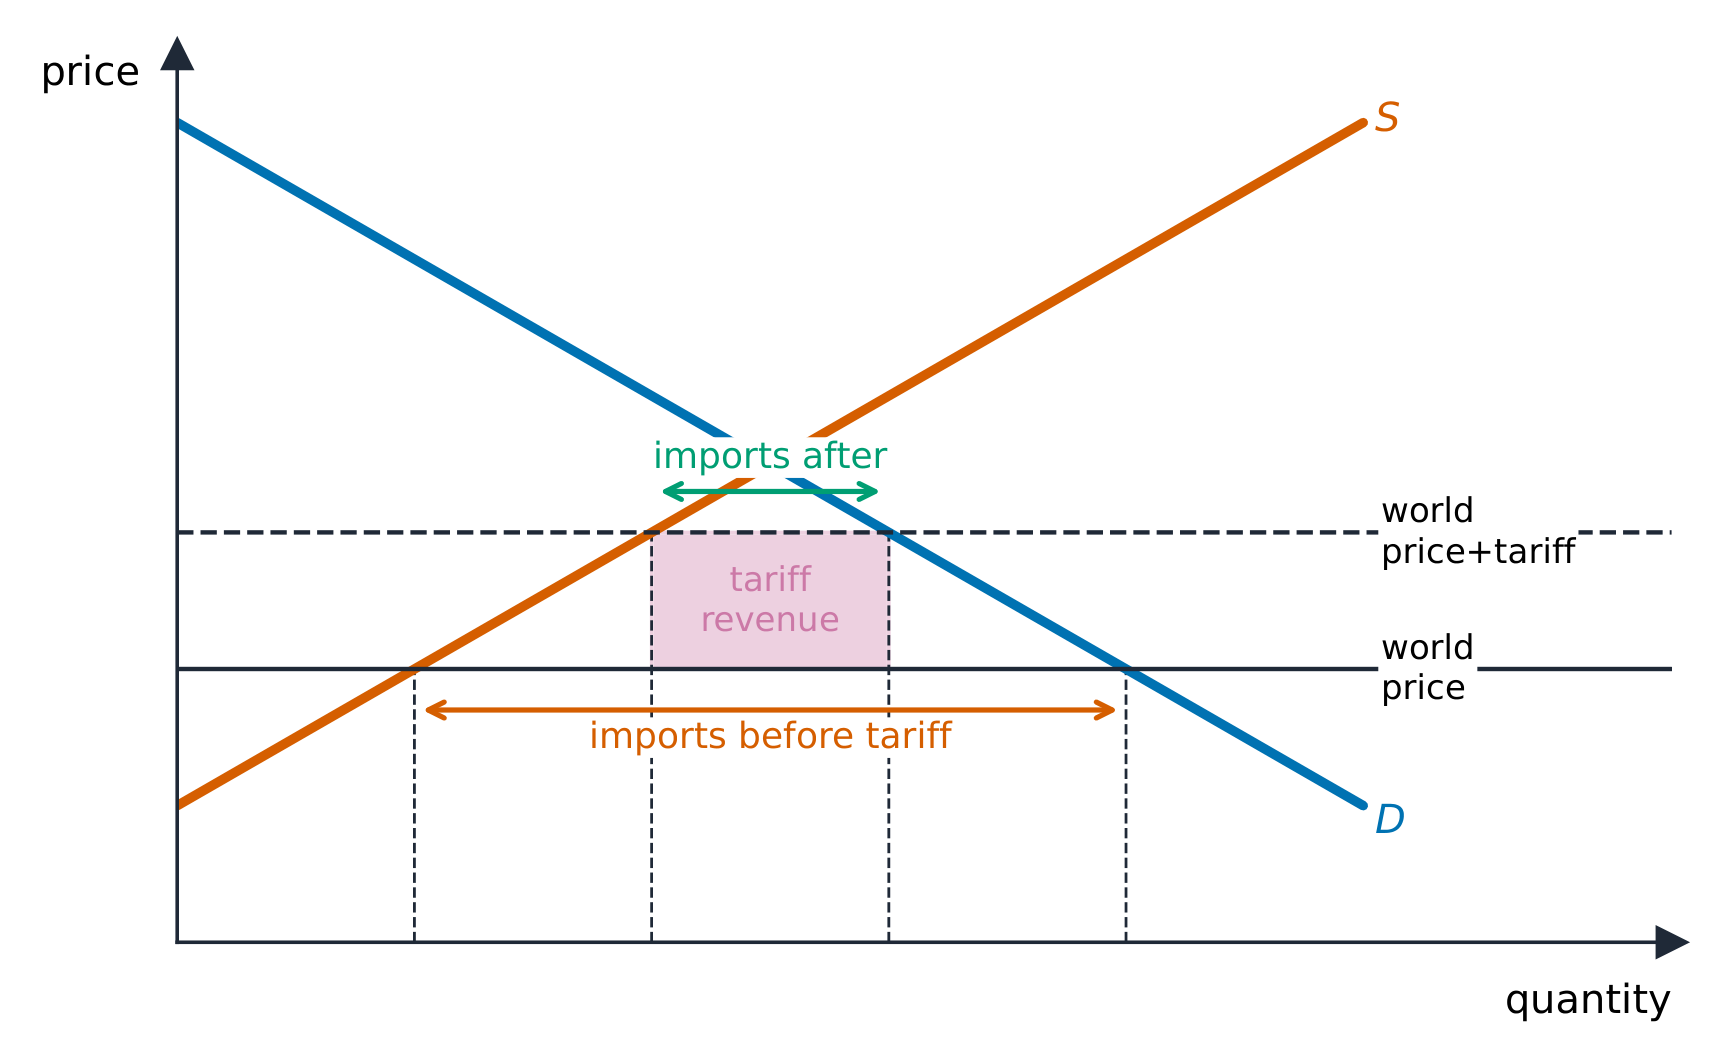
    A tariff 关税 (a tax on imports) or a quota 配额 (a limit on imports) raises the domestic price, helps domestic producers, hurts consumers more, and creates deadweight loss. Free trade maximizes total surplus, which is the core efficiency argument for it.

    ไทย

    当一个国家เปิดการค้าที่ world price:

    ภาษีศุลกากรเพิ่มการผลิตภายในประเทศ ลดความต้องการ และลดการนำเข้า
    ภาษีศุลกากรเพิ่มการผลิตภายในประเทศ ลดความต้องการ และลดการนำเข้า
    • ถ้า world price ต่ำกว่า ราคานอกประเทศ ประเทศนั้นจะ import – ผู้บริโภคได้ประโยชน์มากกว่าผู้ผลิตเสีย利益, ดังนั้น total surplus เพิ่มขึ้น
    • ถ้า world price สูงกว่า ราคานอกประเทศ ประเทศนั้นจะ export – ผู้ผลิตได้ประโยชน์มากกว่าผู้บริโภคเสีย利益

    Tariff (ภาษีนำเข้า) หรือ quota (โควตาจำกัดการนำเข้า) จะทำให้ราคานอกประเทศสูงขึ้น ช่วยผู้ผลิตภายในประเทศ ทำร้ายผู้บริโภคมากขึ้น และสร้าง deadweight loss. การค้าเสรีเพิ่ม total surplus สูงสุด ซึ่งเป็นข้อโต้แย้งด้านประสิทธิภาพหลักของการค้าเสรี

    Vocabulary · ⁨คำศัพท์⁩ Train · ⁨ฝึกฝน⁩
    English ไทย
    world price/wɜːld praɪs/ ราคาโลก
    imports/ɪmˈpɔːts/ การนำเข้า
    exports/ˈekspɔːts/ การส่งออก
    tariff/ˈtærɪf/ ภาษีศุลกากร
    quota/ˈkwəʊtə/ โควตา
    2.9

    Exam tips · ⁨ข้อแนะนำสำหรับการสอบ⁩

    English
    • Separate a movement along a curve (own price) from a shift (a determinant); a single shift gives a definite result, a double shift leaves one variable indeterminate.
    • Compute elasticity $E_d=|\%\Delta Q \div \%\Delta P|$; elastic ($>1$) means a price cut raises total revenue, inelastic ($<1$) lowers it.
    • Read the sign of cross-price elasticity (substitutes $+$, complements $-$) and income elasticity (normal $+$, inferior $-$).
    • Shade consumer/producer surplus and the deadweight loss from a tax or price control; incidence falls on the more inelastic side.
    • A price ceiling below equilibrium causes a shortage; a price floor above causes a surplus.
    ไทย
    • แยกแยะ movement along a curve (own price) ออกจาก shift (a determinant); การ shift เดียวให้ผลลัพธ์ที่แน่นอน, การ shift สองครั้งทำให้ตัวแปรหนึ่ง indeterminate
    • คำนวณ elasticity $E_d=|\%\Delta Q \div \%\Delta P|$; elastic ($>1$) หมายความว่าลดราคาเพิ่ม total revenue, inelastic ($<1$) ลดลง
    • อ่านเครื่องหมายของความยืดหยุ่นต่อราคาสัมพันธ์ (substitutes $+$, complements $-$) และความยืดหยุ่นต่อรายได้ (normal $+$, inferior $-$)
    • Shading consumer/producer surplus และ deadweight loss จากภาษีหรือการควบคุมราคา; incidence ตกที่ฝั่งที่ inelastic มากกว่า
    • Price ceiling ต่ำกว่าจุดสมดุลทำให้เกิด shortage; Price floor สูงกว่าทำให้เกิด surplus
  • 3

    Production, Cost, and the Perfect Competition Model · ⁨การผลิต ต้นทุน และโมเดลการแข่งขันสมบูรณ์⁩

    Watch lesson · ⁨ดูบทเรียน⁩
    3.1

    The Production Function · ⁨ฟังก์ชันการผลิต⁩

    Syllabus · ⁨หลักสูตร⁩
    English

    Enduring Understanding (PRD-1): Firms' production and cost constraints over different input and output levels shape optimal decisions in the short run and long run.

    Learning Objective PRD-1.A: a. Define (using graphs where appropriate) key terms and concepts relating to production and cost. b. Explain (using graphs where appropriate) how production and cost are related in the short run and long run. c. Calculate (using data from a graph or table as appropriate) the various measures of productivity and short-run and long-run costs.

    • PRD-1.A.1 The production function explains the relationship between inputs and outputs both in the short run and the long run.
    • PRD-1.A.2 Marginal product and average product change as input usage changes, and hence, total product changes.
    • PRD-1.A.3 Diminishing marginal returns occur as the firm employs more of one input, holding other inputs constant, to produce a product (output) in the short run.
    ไทย

    ความเข้าใจที่ยั่งยืน (PRD-1): ข้อจำกัดด้านการผลิตและต้นทุนขององค์กรในระดับอินพุตและเอาท์พุตต่างๆ ส่งผลต่อการตัดสินใจที่เหมาะสมที่สุดในระยะสั้นและระยะยาว

    วัตถุประสงค์การเรียนรู้ PRD-1.A: ก. นิยาม (โดยใช้กราฟเมื่อเหมาะสม) คำศัพท์และแนวคิดหลักที่เกี่ยวข้องกับการผลิตและต้นทุน ข. อธิบาย (โดยใช้กราฟเมื่อเหมาะสม) ความสัมพันธ์ระหว่างการผลิตและต้นทุนในระยะสั้นและระยะยาว ค. คำนวณ (โดยใช้ข้อมูลจากกราฟหรือตารางเมื่อเหมาะสม) ตัวชี้วัดต่าง ๆ ของผลผลิต และต้นทุนในระยะสั้นและระยะยาว

    • PRD-1.A.1 ฟังก์ชันการผลิตอธิบายความสัมพันธ์ระหว่างอินพุตและเอาท์พุต ทั้งในระยะสั้นและระยะยาว
    • PRD-1.A.2 ผลผลิตส่วนเพิ่มและผลผลิตเฉลี่ยเปลี่ยนแปลงตามการเปลี่ยนแปลงการใช้อินพุต ดังนั้นผลผลิตรวมจึงเปลี่ยนแปลงด้วย
    • PRD-1.A.3 การลดทอนลงของผลผลิตส่วนเพิ่มเกิดขึ้นเมื่อองค์กรใช้ปัจจัยการผลิตตัวหนึ่งมากขึ้น โดยคงปัจจัยอื่นไว้ เพื่อผลิตสินค้า (เอาท์พุต) ในระยะสั้น

    Source: College Board AP Course and Exam Description · ⁨แหล่งที่มา: คำอธิบายหลักสูตรและข้อสอบ College Board AP⁩

    English

    The production function 生产函数 links inputs to output. In the short run 短期 at least one input (usually capital) is fixed 固定; in the long run 长期 all inputs vary.

    • Total product 总产量 is the total output.
    • Marginal product 边际产量 (MP) is the extra output from one more unit of a variable input (usually labor): $MP=\dfrac{\Delta\ \text{output}}{\Delta\ \text{labor}}$.
    • Average product 平均产量 is output per worker.

    As you add workers to fixed capital, MP eventually falls – the law of diminishing marginal returns 边际收益递减法则. This shape of MP is what drives the shape of the cost curves below.

    ไทย
    โรงงานเหล็ก: Production functions และ costs กำหนดวิธีการที่ firms จัดหาสินค้า
    โรงงานเหล็ก: Production functions และ costs กำหนดวิธีการที่ firms จัดหาสินค้า

    Production function เชื่อมโยง inputs เข้ากับ outputs. ใน short run อย่างน้อย one input (โดยทั่วไปคือ capital) เป็น fixed; ใน long run ทุก inputs เปลี่ยนแปลงได้

    • Total product คือผลผลิตรวม
    • ผลผลิตส่วนเพิ่ม (MP) คือผลผลิตเพิ่มเติมจากการใช้ตัวแปรการผลิตเพิ่มอีกหนึ่งหน่วย (มักจะเป็นแรงงาน): $MP=\dfrac{\Delta\ \text{output}}{\Delta\ \text{labor}}$
    • Average product คือ output ต่อ worker

    เมื่อเพิ่ม workers เข้ากับ fixed capital, MP จะลดลงในที่สุด – law of diminishing marginal returns. รูปแบบของ MP นี้คือสิ่งที่ขับเคลื่อนรูปแบบของ cost curves ด้านล่าง

    แขนหุ่นยนต์ทำงานบนสายการผลิตในโรงงาน
    ฟังก์ชันการผลิตเปลี่ยนปัจจัยการผลิต — เช่น แรงงานและทุนอย่างหุ่นยนต์นี้ — ให้เป็นผลผลิต
    Vocabulary · ⁨คำศัพท์⁩ Train · ⁨ฝึกฝน⁩
    English ไทย
    production function/prəˈdʌkʃn ˈfʌŋkʃn/ ฟังก์ชันการผลิต
    short run/ʃɔːt rʌn/ ระยะสั้น
    fixed/fɪkst/ คงที่
    long run/lɒŋ rʌn/ ระยะยาว
    Total product/ˈtəʊtl ˈprɒdʌkt/ ผลผลิตรวม
    Marginal product/ˈmɑːdʒɪnl ˈprɒdʌkt/ ผลผลิตส่วนเพิ่ม
    Average product/ˈævrɪdʒ ˈprɒdʌkt/ ผลผลิตเฉลี่ย
    law of diminishing marginal returns/lɔː ɒv dɪˈmɪnɪʃɪŋ ˈmɑːdʒɪnl rɪˈtɜːnz/ กฎของการคืนผลส่วนเพิ่มที่ลดลง
    Fixed cost/fɪkst kɒst/ ต้นทุนคงที่
    Variable cost/ˈveərɪəbl kɒst/ ต้นทุนแปรผัน
    3.2

    Short-Run Production Costs · ⁨ต้นทุนการผลิตระยะสั้น⁩

    Syllabus · ⁨หลักสูตร⁩
    English

    Enduring Understanding (PRD-1): Firms' production and cost constraints over different input and output levels shape optimal decisions in the short run and long run.

    Learning Objective PRD-1.A: a. Define (using graphs where appropriate) key terms and concepts relating to production and cost. b. Explain (using graphs where appropriate) how production and cost are related in the short run and long run. c. Calculate (using data from a graph or table as appropriate) the various measures of productivity and short-run and long-run costs.

    • PRD-1.A.4 Fixed costs and variable costs determine the total cost.
    • PRD-1.A.5 Marginal cost, average (fixed, variable, and total) cost, total cost, and total variable cost change as total output changes, but total fixed cost remains constant at all output levels, including zero output.
    • PRD-1.A.6 Production functions with diminishing marginal returns yield an upward-sloping marginal cost curve.
    • PRD-1.A.7 Specialization and the division of labor reduce marginal costs for firms.
    • PRD-1.A.8 Cost curves can shift in response to changes in input costs and productivity.
    ไทย

    ความเข้าใจที่ยั่งยืน (PRD-1): ข้อจำกัดด้านการผลิตและต้นทุนขององค์กรในระดับอินพุตและเอาท์พุตต่างๆ ส่งผลต่อการตัดสินใจที่เหมาะสมที่สุดในระยะสั้นและระยะยาว

    วัตถุประสงค์การเรียนรู้ PRD-1.A: ก. นิยาม (โดยใช้กราฟเมื่อเหมาะสม) คำศัพท์และแนวคิดหลักที่เกี่ยวข้องกับการผลิตและต้นทุน ข. อธิบาย (โดยใช้กราฟเมื่อเหมาะสม) ความสัมพันธ์ระหว่างการผลิตและต้นทุนในระยะสั้นและระยะยาว ค. คำนวณ (โดยใช้ข้อมูลจากกราฟหรือตารางเมื่อเหมาะสม) ตัวชี้วัดต่าง ๆ ของผลผลิต และต้นทุนในระยะสั้นและระยะยาว

    • PRD-1.A.4 ต้นทุนคงที่และต้นทุนแปรผันกำหนดต้นทุนรวม
    • PRD-1.A.5 ต้นทุนส่วนเพิ่ม ต้นทุนเฉลี่ย (คงที่, แปรผัน, และรวม), ต้นทุนรวม และต้นทุนแปรผันรวม เปลี่ยนแปลงตามการเปลี่ยนแปลงของผลผลิตรวม แต่ต้นทุนคงที่จะคงที่ตลอดทุกระดับของผลผลิต รวมถึงผลผลิตเป็นศูนย์
    • PRD-1.A.6 ฟังก์ชันการผลิตที่มีการลดทอนลงของผลผลิตส่วนเพิ่มจะให้เส้นโค้งต้นทุนส่วนเพิ่มที่มีแนวโน้มเพิ่มขึ้น
    • PRD-1.A.7 ความเชี่ยวชาญและการแบ่งงานช่วยลดต้นทุนส่วนเพิ่มสำหรับองค์กร
    • PRD-1.A.8 เส้นโค้งต้นทุนสามารถเคลื่อนย้ายได้เป็นการตอบสนองต่อการเปลี่ยนแปลงของต้นทุนอินพุตและผลผลิต

    Source: College Board AP Course and Exam Description · ⁨แหล่งที่มา: คำอธิบายหลักสูตรและข้อสอบ College Board AP⁩

    English
    Short-run cost curves (MC, ATC, AVC)

    Costs split into fixed and variable:

    • Fixed cost 固定成本 (FC) does not change with output (rent on the factory).
    • Variable cost 可变成本 (VC) rises with output (materials, labor).
    • Total cost 总成本 $TC=FC+VC$.

    The per-unit costs matter most:

    • Average fixed cost $AFC=FC/Q$ falls continuously (spreading fixed cost).
    • Average variable cost $AVC=VC/Q$ and average total cost $ATC=TC/Q$ are U-shaped.
    • Marginal cost 边际成本 $MC=\dfrac{\Delta TC}{\Delta Q}$ is the cost of one more unit.

    Two key facts: MC is the mirror image of MP (when MP rises, MC falls, and vice versa), and MC cuts both AVC and ATC at their minimum points (when marginal is below average, the average falls; when above, it rises).

    Worked example. A firm has fixed cost $FC=\$100$. At $Q=10$ its total cost is $\$300$, so variable cost is $\$200$: then $ATC=\tfrac{300}{10}=\$30$, $AVC=\tfrac{200}{10}=\$20$, and $AFC=\tfrac{100}{10}=\$10$ (note $AFC+AVC=ATC$). If raising output to $Q=11$ pushes total cost to $\$325$, the marginal cost of that $11$th unit is $\dfrac{\Delta TC}{\Delta Q}=\dfrac{325-300}{1}=\$25$.

    ไทย
    เส้นต้นทุนระยะสั้น (MC, ATC, AVC)

    ต้นทุนแบ่งออกเป็น คงที่ และ แปรผัน:

    เส้นโค้งต้นทุนส่วนเพิ่ม ต้นทุนเฉลี่ย และต้นทุนแปรผันระยะสั้น
    เส้นโค้งต้นทุนรวมส่วนเพิ่ม ส่วนเฉลี่ย และส่วนแปรผันระยะสั้น
    • ต้นทุนคงที่ (FC) ไม่เปลี่ยนแปลงตามปริมาณผลผลิต (ค่าเช่าโรงงาน)
    • ต้นทุนแปรผัน (VC) เพิ่มขึ้นตามปริมาณผลผลิต (วัตถุดิบ, แรงงาน)
    • ต้นทุนรวม $TC=FC+VC$.

    ต้นทุนต่อหน่วยมีความสำคัญที่สุด:

    • ต้นทุนคงที่เฉลี่ย $AFC=FC/Q$ ลดลงอย่างต่อเนื่อง (การกระจายต้นทุนคงที่)
    • ต้นทุนแปรผันเฉลี่ย $AVC=VC/Q$ และ ต้นทุนรวมเฉลี่ย $ATC=TC/Q$ มีลักษณะเป็นรูปตัว U
    • ต้นทุนส่วนเพิ่ม $MC=\dfrac{\Delta TC}{\Delta Q}$ คือต้นทุนของหน่วยเพิ่มเติมหนึ่งหน่วย

    ข้อเท็จจริงสำคัญสองประการ: MC เป็นภาพสะท้อนของ MP (เมื่อ MP เพิ่มขึ้น MC จะลดลง และในทางกลับกัน) และ MC ตัดทั้ง AVC และ ATC ที่จุดต่ำสุด (เมื่อส่วนเพิ่มอยู่ต่ำกว่าค่าเฉลี่ย ค่าเฉลี่ยจะลดลง; เมื่อสูงกว่า ค่าเฉลี่ยจะเพิ่มขึ้น)

    ตัวอย่างวิธีทำ. บริษัทมีต้นทุนคงที่ $FC=\$100$. At $Q=10$ its total cost is $\$300$ ดังนั้นต้นทุนแปรผันคือ $\$200$: then $ATC=\tfrac{300}{10}=\$30$, $AVC=\tfrac{200}{10}=\$20$, and $AFC=\tfrac{100}{10}=\$10$ (สังเกต $AFC+AVC=ATC$). หากเพิ่มผลผลิตไปเป็น $Q=11$ ทำให้ต้นทุนรวมเป็น $\$325$, the marginal cost of that $11$th unit is $\dfrac{\Delta TC}{\Delta Q}=\dfrac{325-300}{1}=\$25$.

    Explore · ⁨สำรวจ⁩

    Explore the U-shaped cost curves · ⁨สำรวจเส้นโค้งต้นทุนรูปตัว U⁩

    As output rises, marginal cost eventually climbs (diminishing returns) and cuts through the U-shaped average cost at its minimum — the most efficient scale. · ⁨เมื่อผลผลิตเพิ่มขึ้น ต้นทุนเชิงพจน์ ในที่สุดก็จะเพิ่มขึ้น (จากผลลดถอย) และตัดผ่าน ต้นทุนเฉลี่ย รูปตัว U ที่จุดต่ำสุด — ซึ่งเป็นขนาดการผลิตที่มีประสิทธิภาพที่สุด⁩

    Vocabulary · ⁨คำศัพท์⁩ Train · ⁨ฝึกฝน⁩
    English ไทย
    Total cost/ˈtəʊtl kɒst/ ต้นทุนรวม
    Marginal cost/ˈmɑːdʒɪnl kɒst/ ต้นทุนส่วนเพิ่ม
    3.3

    Long-Run Production Costs · ⁨ต้นทุนการผลิตระยะยาว⁩

    Syllabus · ⁨หลักสูตร⁩
    English

    Enduring Understanding (PRD-1): Firms' production and cost constraints over different input and output levels shape optimal decisions in the short run and long run.

    Learning Objective PRD-1.A: a. Define (using graphs where appropriate) key terms and concepts relating to production and cost. b. Explain (using graphs where appropriate) how production and cost are related in the short run and long run. c. Calculate (using data from a graph or table as appropriate) the various measures of productivity and short-run and long-run costs.

    • PRD-1.A.9 In the long run, firms can adjust all their inputs, and as a result, all costs become variable.
    • PRD-1.A.10 The relationship between inputs and outputs in the long run is described by the scale of production—increasing, decreasing, or constant returns to scale.
    • PRD-1.A.11 The long-run average total cost is characterized by economies of scale, diseconomies of scale, or constant returns to scale (efficient scale).
    • PRD-1.A.12 The minimum efficient scale plays a role in determining the concentration of firms in a market and the market structure.
    ไทย

    ความเข้าใจที่ยั่งยืน (PRD-1): ข้อจำกัดด้านการผลิตและต้นทุนขององค์กรในระดับอินพุตและเอาท์พุตต่างๆ ส่งผลต่อการตัดสินใจที่เหมาะสมที่สุดในระยะสั้นและระยะยาว

    วัตถุประสงค์การเรียนรู้ PRD-1.A: ก. นิยาม (โดยใช้กราฟเมื่อเหมาะสม) คำศัพท์และแนวคิดหลักที่เกี่ยวข้องกับการผลิตและต้นทุน ข. อธิบาย (โดยใช้กราฟเมื่อเหมาะสม) ความสัมพันธ์ระหว่างการผลิตและต้นทุนในระยะสั้นและระยะยาว ค. คำนวณ (โดยใช้ข้อมูลจากกราฟหรือตารางเมื่อเหมาะสม) ตัวชี้วัดต่าง ๆ ของผลผลิต และต้นทุนในระยะสั้นและระยะยาว

    • PRD-1.A.9 ในระยะยาว องค์กรสามารถปรับเปลี่ยนปัจจัยการผลิตทั้งหมดของตนได้ ดังนั้นต้นทุนทั้งหมดจึงกลายเป็นต้นทุนแปรผัน
    • PRD-1.A.10 ความสัมพันธ์ระหว่างอินพุตและเอาท์พุตในระยะยาวอธิบายได้ด้วยขนาดการผลิต—ผลผลิตส่วนเพิ่ม, ผลผลิตลดทอน, หรือผลผลิตคงที่
    • PRD-1.A.11 ต้นทุนเฉลี่ยรวมในระยะยาวมีลักษณะเฉพาะโดย economies of scale, diseconomies of scale, หรือผลผลิตคงที่ (ขนาดที่มีประสิทธิภาพ)
    • PRD-1.A.12 ขนาดที่มีประสิทธิภาพต่ำสุด (minimum efficient scale) มีบทบาทในการกำหนดความเข้มข้นขององค์กรในตลาดและโครงสร้างตลาด

    Source: College Board AP Course and Exam Description · ⁨แหล่งที่มา: คำอธิบายหลักสูตรและข้อสอบ College Board AP⁩

    English

    In the long run all inputs – including plant size – can change, so only the long-run average total cost (LRATC) curve matters. Its shape shows returns to scale:

    • Economies of scale 规模经济: LRATC falls as output grows (bulk buying, specialization).
    • Constant returns to scale: LRATC flat.
    • Diseconomies of scale 规模不经济: LRATC rises (a firm too big to manage well).

    Exam skill: know that "diminishing returns" is a short-run idea (one fixed input) while "economies of scale" is a long-run idea (all inputs vary) – examiners test the distinction.

    ไทย

    ในระยะยาว ปัจจัยทั้งหมด – รวมถึงขนาดโรงงาน – สามารถเปลี่ยนแปลงได้ ดังนั้นจึงมีเพียงเส้นโค้ง ต้นทุนรวมเฉลี่ยระยะยาว (LRATC) เท่านั้นที่สำคัญ รูปร่างของมันแสดงถึง ผลตอบแทนต่อขนาดการผลิต:

    ประโยชน์และผลเสียจากเศรษฐกิจต่อขนาดการผลิตบนเส้นโค้งต้นทุนเฉลี่ยระยะยาว
    ประโยชน์และผลเสียจากเศรษฐกิจต่อขนาดการผลิตบนเส้นโค้งต้นทุนเฉลี่ยระยะยาว
    • ประหยัดต่อขนาดการผลิต: LRATC ลดลงเมื่อผลผลิตเพิ่มขึ้น (การซื้อจำนวนมาก, การแบ่งแยกความเชี่ยวชาญ)
    • ผลตอบแทนต่อขนาดการผลิตคงที่: LRATC เป็นเส้นราบ
    • ไม่ประหยัดต่อขนาดการผลิต: LRATC เพิ่มขึ้น (บริษัทที่ใหญ่เกินไปจนบริหารจัดการไม่ดี)

    ทักษะในการสอบ: ต้องรู้ว่า "การลดทอนผลตอบแทน" เป็นแนวคิด ระยะสั้น (มีปัจจัยคงที่หนึ่งตัว) ในขณะที่ "ประหยัดต่อขนาดการผลิต" เป็นแนวคิด ระยะยาว (ปัจจัยทั้งหมดแปรผัน) – ผู้สอบจะทดสอบความแตกต่างนี้

    Vocabulary · ⁨คำศัพท์⁩ Train · ⁨ฝึกฝน⁩
    English ไทย
    Economies of scale/ɪˈkɒnəmiz ɒv skeɪl/ เศรษฐกิจของขนาด
    Diseconomies of scale/ˌdɪsɪˈkɒnəmiz ɒv skeɪl/ Diseconomies of scale
    Explicit costs/ekˈsplɪsɪt kɒsts/ ค่าใช้จ่ายที่เห็นได้ชัด
    implicit costs/ɪmˈplɪsɪt kɒsts/ ต้นทุนโดยนัย
    Accounting profit/əˈkaʊntɪŋ ˈprɒfɪt/ กำไรทางบัญชี
    Economic profit/ˌiːkəˈnɒmɪk ˈprɒfɪt/ กำไรทางเศรษฐศาสตร์
    normal profit/ˈnɔːml ˈprɒfɪt/ กำไรปกติ
    entry/ˈentri/ เข้าสู่ตลาด
    exit/ˈeɡzɪt/ ออกนอกตลาด
    perfectly competitive/ˈpɜːfektlɪ kəmˈpetɪtɪv/ การแข่งขันสมบูรณ์
    price taker/praɪs ˈteɪkə/ ผู้รับราคา
    allocatively efficient/ˈæləkətɪvli ɪˈfɪʃənt/ allocatively efficient
    productively efficient/prəˈdʌktɪvli ɪˈfɪʃənt/ ประสิทธิภาพในการผลิต
    3.4

    Types of Profit · ⁨ประเภทของกำไร⁩

    Syllabus · ⁨หลักสูตร⁩
    English

    Enduring Understanding (CBA-2): To determine the optimal level at which to pursue an activity whose total benefits exceed total cost, rational economic agents compare marginal benefits and marginal costs.

    Learning Objective CBA-2.C: a. Define the different types of profit. b. Explain how firms respond to profit opportunities. c. Calculate a firm's profit or loss.

    • CBA-2.C.1 Firms respond to economic profit (loss) rather than accounting profit.
    • CBA-2.C.2 Accounting profit fails to account for implicit costs (such as cost of financial capital, compensation for risk, or an entrepreneur's time), which, if fully compensated, result in normal profit.
    ไทย

    ความเข้าใจที่ยั่งยืน (CBA-2): เพื่อระบุระดับที่เหมาะสมในการดำเนินกิจกรรมซึ่งผลได้รวมเกินกว่าต้นทุนรวม ตัวแทนทางเศรษฐกิจที่มีเหตุผลจะเปรียบเทียบผลได้ส่วนเพิ่มและต้นทุนส่วนเพิ่ม

    วัตถุประสงค์การเรียนรู้ CBA-2.C: ก. นิยามประเภทของกำไรที่แตกต่างกัน ข. อธิบายว่าองค์กรตอบสนองต่อโอกาสทางกำไรได้อย่างไร ค. คำนวณกำไรหรือขาดทุนขององค์กร

    • CBA-2.C.1 องค์กรตอบสนองต่อกำไรทางเศรษฐกิจ (หรือขาดทุน) มากกว่ากำไรทางบัญชี
    • CBA-2.C.2 กำไรทางบัญชีไม่คำนึงถึงต้นทุนนัยยะ (เช่น ต้นทุนของเงินทุน, ค่าตอบแทนความเสี่ยง, หรือเวลาของนักธุรกิจ) ซึ่งหากชดเชยเต็มจำนวนแล้วจะทำให้เกิดกำไรปกติ

    Source: College Board AP Course and Exam Description · ⁨แหล่งที่มา: คำอธิบายหลักสูตรและข้อสอบ College Board AP⁩

    English

    Economists count all opportunity costs, including the owner's:

    • Explicit costs 显性成本 are out-of-pocket payments; implicit costs 隐性成本 are the opportunity costs of owner-supplied resources (forgone salary, forgone interest).
    • Accounting profit 会计利润 $=$ revenue $-$ explicit costs.
    • Economic profit 经济利润 $=$ revenue $-$ explicit $-$ implicit costs.

    Because economic profit subtracts more, it is smaller. Zero economic profit (a normal profit 正常利润) still means the owner is earning exactly the opportunity cost of their resources – a perfectly acceptable outcome.

    Worked example. A shopkeeper takes in $\$200{,}000$ of revenue and pays $\$120{,}000$ in explicit costs, so accounting profit is $\$80{,}000$. But she gave up a $\$70{,}000$ salary elsewhere and $\$5{,}000$ of interest on the savings she invested – $\$75{,}000$ of implicit costs. Her economic profit is $80{,}000-75{,}000=\$5{,}000$: still positive, so staying in business genuinely beats her next-best alternative.

    ไทย

    นักเศรษฐศาสตร์นับ ทุก โอกาสLost cost รวมถึงของผู้เจ้าของ:

    • ต้นทุนชัดแจ้ง คือเงินจ่ายออกจริง; ต้นทุนแฝง คือโอกาสLost cost ของทรัพยากรที่เจ้าของจัดเตรียมเอง (เงินเดือนที่พลาดไป, ดอกเบี้ยที่พลาดไป)
    • กำไรบัญชี $=$ รายรับ $-$ ต้นทุนชัดแจ้ง
    • กำไรทางเศรษฐศาสตร์ $=$ รายรับ $-$ ต้นทุนชัดแจ้ง $-$ ต้นทุนแฝง

    เนื่องจากกำไรทางเศรษฐศาสตร์หักค่าใช้จ่ายมากกว่า จึงมีค่าน้อยกว่า กำไรทางเศรษฐศาสตร์เป็นศูนย์ (กำไรปกติ) ยังหมายถึงเจ้าของได้รับเท่ากับโอกาสLost cost ของทรัพยากรของตนพอดี – ซึ่งเป็นผลลัพธ์ที่ยอมรับได้อย่างสมบูรณ์แบบ

    ตัวอย่างวิธีทำ. เจ้าของร้านรับรายได้ $\$200{,}000$ of revenue and pays $\$120{,}000$ ในต้นทุนชัดแจ้ง ดังนั้น กำไรบัญชี คือ $\$80{,}000$. But she gave up a $\$70{,}000$ เงินเดือนในที่อื่น และ $\$5{,}000$ of interest on the savings she invested – $\$75{,}000$ ของ ต้นทุนแฝง กำไรทางเศรษฐศาสตร์ ของเธอคือ $80{,}000-75{,}000=\$5{,}000$: ยังเป็นบวก ดังนั้นการดำเนินธุรกิจยังคงดีกว่าทางเลือกที่ดีที่สุดถัดของเธออย่างแท้จริง

    3.5

    Profit Maximization · ⁨การสร้างกำไรสูงสุด⁩

    Syllabus · ⁨หลักสูตร⁩
    English

    Enduring Understanding (CBA-2): To determine the optimal level at which to pursue an activity whose total benefits exceed total cost, rational economic agents compare marginal benefits and marginal costs.

    Learning Objective CBA-2.D: a. Define (using graphs or data as appropriate) the profit-maximizing rule. b. Explain (using a graph or data as appropriate) the profit-maximizing level of production.

    • CBA-2.D.1 Firms are assumed to produce output to maximize their profits by comparing marginal revenue and marginal cost.
    ไทย

    ความเข้าใจที่ยั่งยืน (CBA-2): เพื่อระบุระดับที่เหมาะสมในการดำเนินกิจกรรมซึ่งผลได้รวมเกินกว่าต้นทุนรวม ตัวแทนทางเศรษฐกิจที่มีเหตุผลจะเปรียบเทียบผลได้ส่วนเพิ่มและต้นทุนส่วนเพิ่ม

    วัตถุประสงค์การเรียนรู้ CBA-2.D: ก. นิยาม (โดยใช้กราฟหรือข้อมูลเมื่อเหมาะสม) กฎการทำให้กำไรสูงสุด ข. อธิบาย (โดยใช้กราฟหรือข้อมูลเมื่อเหมาะสม) ระดับการผลิตที่ทำให้กำไรสูงสุด

    • CBA-2.D.1 องค์กรถูกสมมติว่าผลิตเอาท์พุตเพื่อทำให้กำไรสูงสุดโดยการเปรียบเทียบรายได้ส่วนเพิ่มกับต้นทุนส่วนเพิ่ม

    Source: College Board AP Course and Exam Description · ⁨แหล่งที่มา: คำอธิบายหลักสูตรและข้อสอบ College Board AP⁩

    English

    Every firm, in every market structure, maximizes profit at the quantity where marginal revenue equals marginal cost:

    $$MR=MC.$$
    Produce each unit whose MR exceeds its MC; stop when they are equal. Producing less leaves profitable units unmade; producing more adds units that cost more than they earn.

    ไทย

    บริษัททุกแห่ง ในทุกโครงสร้างตลาด สร้างกำไรสูงสุดที่ปริมาณที่ รายได้ส่วนเพิ่มเท่ากับต้นทุนส่วนเพิ่ม:

    $$MR=MC.$$
    ผลิตแต่ละหน่วยwhose MR สูงกว่า MC; หยุดเมื่อเท่ากัน การผลิตน้อยกว่าทำให้หน่วยที่มีกำไรไม่ถูกผลิต; การผลิตมากกว่าเพิ่มหน่วยที่成本高กว่าที่มันสร้างรายได้

    3.6

    Deciding to Produce, Enter, or Exit · ⁨การตัดสินใจผลิต เข้า หรือ ออกจากตลาด⁩

    Syllabus · ⁨หลักสูตร⁩
    English

    Enduring Understanding (PRD-2): Firms' short-run decisions to produce output, and long-run decisions to enter or exit a market, are based on profitability.

    Learning Objective PRD-2.A: Explain (using graphs or data where appropriate) firms' short-run decisions to produce positive output levels, or long-run decisions to enter or exit a market in response to profit-making opportunities.

    • PRD-2.A.1 In the short run, firms decide to operate (i.e., produce positive output) or shut down (i.e., produce zero output) by comparing total revenue to total variable cost or price to average variable cost (AVC).
    • PRD-2.A.2 In the absence of barriers to entry or exit, in the long run (i.e., once factors that are fixed in the short run become variable), firms enter a market in which there are profit-making opportunities and exit a market when they anticipate economic losses.
    ไทย

    ความเข้าใจที่ยั่งยืน (PRD-2): การตัดสินใจในระยะสั้นขององค์กรในการผลิตเอาท์พุต และการตัดสินใจในระยะยาวในการเข้าสู่หรือออกจากตลาด นั้นขึ้นอยู่กับความคุ้มค่าทางกำไร

    วัตถุประสงค์การเรียนรู้ PRD-2.A: อธิบาย (โดยใช้กราฟหรือข้อมูลเมื่อเหมาะสม) การตัดสินใจในระยะสั้นขององค์กรในการผลิตระดับเอาท์พุตที่เป็นบวก หรือการตัดสินใจในระยะยาวในการเข้าสู่หรือออกจากตลาด เพื่อตอบสนองต่อโอกาสทางกำไร

    • PRD-2.A.1 ในระยะสั้น องค์กรตัดสินใจดำเนินการ ( tức ผลิตเอาท์พุตที่เป็นบวก ) หรือหยุดผลิต ( tức ผลิตเอาท์พุตเป็นศูนย์ ) โดยการเปรียบเทียบรายได้รวมกับต้นทุนแปรผันรวม หรือราคาเทียบกับต้นทุนแปรผันเฉลี่ย (AVC)
    • PRD-2.A.2 เมื่อไม่มีอุปสรรคต่อการเข้าสู่หรือออกจากตลาด ในระยะยาว (即 เมื่อปัจจัยที่คงที่ในระยะสั้นกลายเป็นแปรผัน) องค์กรจะเข้าสู่ตลาดที่มีโอกาสทำกำไร และออกจากตลาดเมื่อคาดการณ์ว่าจะเกิดขาดทุนทางเศรษฐกิจ

    Source: College Board AP Course and Exam Description · ⁨แหล่งที่มา: คำอธิบายหลักสูตรและข้อสอบ College Board AP⁩

    English

    Even at $MR=MC$, a firm must check whether to operate:

    • Short run – the shutdown rule: keep producing only if price covers average variable cost ($P\geq AVC$). If $P, shut down and lose only fixed cost. So the firm's short-run supply curve is its MC curve above minimum AVC.
    • Profit check: compare $P$ to $ATC$ at the profit-maximizing quantity – $P>ATC$ means economic profit, $P means a loss, $P=ATC$ means break-even.
    • Long run – entry and exit: economic profits attract entry 进入; losses cause exit 退出. This continues until economic profit is zero.
    ไทย

    แม้ที่ $MR=MC$ บริษัทก็ต้องตรวจสอบว่าควรดำเนินการหรือไม่:

    • ระยะสั้น – กฎการหยุดดำเนินการ: ผลิตต่อก็ต่อเมื่อราคาครอบคลุม ต้นทุนแปรผันเฉลี่ย ($P\geq AVC$). หาก $P ให้หยุดผลิตและขาดทุนเพียงต้นทุนคงที่ ดังนั้นเส้นอุปทานระยะสั้นของบริษัทคือ MC curve ที่อยู่เหนือจุดต่ำสุดของ AVC.
    • ตรวจสอบกำไร: เปรียบเทียบ $P$ กับ $ATC$ ที่ปริมาณสร้างกำไรสูงสุด – $P>ATC$ หมายถึง กำไรทางเศรษฐศาสตร์, $P หมายถึง ขาดทุน, $P=ATC$ หมายถึง.ico break-even.
    • ระยะยาว – การเข้าและออกจากตลาด: กำไรทางเศรษฐศาสตร์ดึงดูด การเข้า; ขาดทุนทำให้ การออก. นี้จะดำเนินต่อไปจนกำไรทางเศรษฐศาสตร์เป็นศูนย์
    3.7

    Perfect Competition · ⁨ตลาดการแข่งขันสมบูรณ์⁩

    Syllabus · ⁨หลักสูตร⁩
    English

    Enduring Understanding (PRD-3): Even with a common goal of profit-maximization, market structure constrains and influences prices, output, and efficiency.

    Learning Objective PRD-3.A: a. Define (using graphs as appropriate) the characteristics of perfectly competitive markets and efficiency. b. Explain (using graphs where appropriate) equilibrium and firm decision making in perfectly competitive markets and how prices in perfectly competitive markets lead to efficient outcomes. c. Calculate (using data from a graph or table as appropriate) economic profit (loss) in perfectly competitive markets.

    • PRD-3.A.1 A perfectly competitive market is efficient. Firms in perfectly competitive markets face no barriers to entry and have no market power.
    • PRD-3.A.2 In perfectly competitive markets, prices communicate to consumers and producers the magnitude of others' marginal costs of production and marginal benefits of consumption and provide incentives to act on that information (i.e., price equals marginal cost in an efficient market).
    • PRD-3.A.3 In perfectly competitive markets, firms can sell all their outputs at a constant price determined by the market.
    • PRD-3.A.4 At a competitive market equilibrium, firms are price takers and select output to maximize profit by producing the level of output where the marginal cost equals marginal revenue (at the price).
    • PRD-3.A.5 At a competitive market equilibrium, the price of a product equals both the private marginal benefit received by the last unit consumed and the private marginal cost incurred to produce the last unit, thus achieving allocative efficiency.
    • PRD-3.A.6 In a short-run competitive equilibrium, price can either be above or below its long-run competitive level resulting in profits or losses, motivating entry or exit of firms and moving prices and quantities toward long-run equilibrium.
    • PRD-3.A.7 In a long-run perfectly competitive equilibrium, productive efficiency implies all operating firms produce at efficient scale, price equals marginal cost and minimum average total cost, and firms earn zero economic profit.
    • PRD-3.A.8 Firms may be in a constant cost, increasing cost, or decreasing cost industry. Long-run prices depend on the portion of the long-run cost curves on which firms operate.
    • PRD-3.A.9 A perfectly competitive market in long-run equilibrium is allocatively and productively efficient.
    ไทย

    ความเข้าใจที่ยั่งยืน (PRD-3): แม้จะมีเป้าหมายร่วมกันคือการทำให้กำไรสูงสุด โครงสร้างตลาดก็จำกัดและมีอิทธิพลต่อราคา outputs และประสิทธิภาพ

    วัตถุประสงค์การเรียนรู้ PRD-3.A: ก. นิยาม (โดยใช้กราฟเมื่อเหมาะสม) ลักษณะของตลาดแข่งขันสมบูรณ์และประสิทธิภาพ ข. อธิบาย (โดยใช้กราฟเมื่อเหมาะสม) สภาวะสมดุลและการตัดสินใจขององค์กรในตลาดแข่งขันสมบูรณ์以及如何使ราคาในตลาดแข่งขันสมบูรณ์นำไปสู่ผลลัพธ์ที่มีประสิทธิภาพ ค. คำนวณ (โดยใช้ข้อมูลจากกราฟหรือตารางเมื่อเหมาะสม) กำไรทางเศรษฐกิจ (หรือขาดทุน) ในตลาดแข่งขันสมบูรณ์

    • PRD-3.A.1 ตลาดแข่งขันสมบูรณ์มีประสิทธิภาพ องค์กรในตลาดแข่งขันสมบูรณ์เผชิญกับอุปสรรคต่อการเข้าไม่มี และไม่มีอำนาจตลาด
    • PRD-3.A.2 ในตลาดแข่งขันสมบูรณ์ ราคาสื่อสารไปยังผู้บริโภคและผู้ผลิตเกี่ยวกับขนาดของต้นทุนส่วนเพิ่มของการผลิตและประโยชน์ส่วนเพิ่มจากการบริโภคของผู้อื่น และให้แรงจูงใจในการกระทำตามข้อมูลนั้น (即 ราคาเท่ากับต้นทุนส่วนเพิ่มในตลาดที่มีประสิทธิภาพ)
    • PRD-3.A.3 ในตลาดแข่งขันสมบูรณ์ องค์กรสามารถขายเอาท์พุตทั้งหมดของตนได้ในราคาที่คงที่ซึ่งกำหนดโดยตลาด
    • PRD-3.A.4 ที่สภาวะสมดุลของตลาดแข่งขัน องค์กรเป็นผู้รับราคาและเลือกเอาท์พุตเพื่อทำให้กำไรสูงสุดโดยการผลิตในระดับเอาท์พุตที่ต้นทุนส่วนเพิ่มเท่ากับรายได้ส่วนเพิ่ม (ที่ราคา)
    • PRD-3.A.5 ในภาวะสมดุลของตลาดที่แข่งขันกัน ราคาของสินค้าจะเท่ากับทั้งประโยชน์ส่วนเพิ่มส่วนบุคคลที่ได้รับจากหน่วยสุดท้ายที่ถูกบริโภค และต้นทุนส่วนเพิ่มส่วนบุคคลที่เกิดขึ้นจากการผลิตหน่วยสุดท้าย ดังนั้นจึงเกิดประสิทธิภาพในการจัดสรรทรัพยากร
    • PRD-3.A.6 ในภาวะสมดุลระยะสั้นของตลาดที่แข่งขันกัน ราคาอาจอยู่สูงกว่าหรือต่ำกว่าระดับสมดุลระยะยาว ทำให้เกิดกำไรหรือขาดทุน ซึ่งกระตุ้นให้บริษัทเข้าหรือออกจากตลาด และทำให้ราคาและปริมาณการผลิตเคลื่อนที่เข้าสู่ภาวะสมดุลระยะยาว
    • PRD-3.A.7 ในภาวะสมดุลการแข่งขันสมบูรณ์ระยะยาว ประสิทธิภาพในการผลิตหมายถึง บริษัททั้งหมดที่ดำเนินธุรกิจผลิตที่ขนาดที่มีประสิทธิภาพ ราคาเท่ากับต้นทุนส่วนเพิ่มและค่าเฉลี่ยรวมต่ำสุดที่สุด และบริษัทได้รับกำไรทางเศรษฐกิจเป็นศูนย์
    • PRD-3.A.8 บริษัทอาจอยู่ในอุตสาหกรรมที่มีต้นทุนคงที่ ต้นทุนเพิ่มขึ้น หรือต้นทุนลดลง ราคาในระยะยาวขึ้นอยู่กับส่วนของเส้นโค้งต้นทุนระยะยาวที่บริษัทดำเนินการ
    • PRD-3.A.9 ตลาดที่แข่งขันสมบูรณ์ในภาวะสมดุลระยะยาวมีประสิทธิภาพทั้งในการจัดสรรทรัพยากรและการผลิต

    Source: College Board AP Course and Exam Description · ⁨แหล่งที่มา: คำอธิบายหลักสูตรและข้อสอบ College Board AP⁩

    English

    A perfectly competitive 完全竞争 market has many small firms, an identical (homogeneous) product, free entry and exit, and perfect information. Each firm is a price taker 价格接受者 – too small to affect the price – so it faces a horizontal demand curve at the market price, and price = marginal revenue = average revenue ($P=MR=AR$).

    This is why economists prize perfect competition. In long-run equilibrium it is both allocatively efficient 配置效率 and productively efficient 生产效率. Allocative efficiency holds because the firm produces where $P = MC$: the price (society's marginal benefit from the last unit) equals its marginal cost, so exactly the right amount is made. Productive efficiency holds because free entry drives price down to the minimum of average total cost, so goods are made as cheaply as possible. The market price is itself a signal that communicates everyone's marginal costs and benefits.

    The side-by-side panel is the graph the exam wants: the market (left) fixes the price $P^{*}$; the firm (right) takes it as a horizontal line and produces where $MC=P$. When $P>ATC$ there is a short-run profit (the shaded box); that profit attracts entry, which shifts market supply right and pushes the price down.

    • Short run: the firm can earn profit, break even, or take a loss, producing where $P=MC$.
    • Long run: entry and exit drive the firm to zero economic profit, producing where $P=MC=ATC$ at minimum ATC. This double efficiency – productive efficiency (lowest-cost output) and allocative efficiency ($P=MC$, so the last unit's value equals its cost) – is the benchmark against which every other market structure is judged.

    Exam skill: be able to draw the side-by-side market and single-firm graphs, show a short-run profit or loss, then show how entry/exit restores long-run equilibrium at minimum ATC.

    ไทย

    ตลาด แข่งขันสมบูรณ์ มีบริษัทเล็กๆ จำนวนมาก, ผลิตภัณฑ์ที่เหมือนกัน (homogeneous), การเข้าและออกอิสระ, และข้อมูลสมบูรณ์แบบ แต่ละบริษัทเป็น ผู้รับราคา – เล็กเกินไปที่จะส่งผลกระทบต่อราคา – ดังนั้นจึงเผชิญกับเส้น ความต้องการแบบราบ ที่ราคาตลาด, และ ราคา = รายได้ส่วนเพิ่ม = รายได้เฉลี่ย ($P=MR=AR$).

    นี่คือเหตุผลที่นักเศรษฐศาสตร์ชื่นชมการแข่งขันสมบูรณ์. ใน สมดุลระยะยาว มันมีประสิทธิภาพทั้งด้าน การจัดสรร และ การผลิต. ประสิทธิภาพการจัดสรรเกิดขึ้นเพราะบริษัทผลิตที่ $P = MC$: ราคา (ผลประโยชน์ส่วนเพิ่มของสังคมจากหน่วยสุดท้าย) เท่ากับต้นทุนส่วนเพิ่มของมัน, ดังนั้นผลิตในปริมาณที่ถูกต้องพอดี. ประสิทธิภาพการผลิตเกิดขึ้นเพราะการเข้าอิสระดันราคาลงสู่จุดต่ำสุดของต้นทุนรวมเฉลี่ย, ดังนั้นสินค้าถูกผลิตด้วยราคาถูกที่สุด. ราคาตลาดเป็น สัญญาณ ที่สื่อสารต้นทุนส่วนเพิ่มและผลประโยชน์ของทุกคน

    ตลาดกำหนดราคา; บริษัทผู้รับราคาผลิตที่จุดที่ MC = P, ที่นี่แสดงกำไรในระยะสั้น
    ตลาดกำหนดราคา; บริษัทผู้รับราคาผลิตที่ MC = P, ที่นี่มีกำไรระยะสั้น

    แผงกราฟคู่ขนานคือกราฟที่ข้อสอบต้องการ: ตลาด (ซ้าย) กำหนดราคา $P^{*}$; บริษัท (ขวา) รับมันเป็นเส้นราบและผลิตที่ $MC=P$. เมื่อ $P>ATC$ จะมีกำไรระยะสั้น (กล่องทึบ); กำไรนี้ดึงดูดการเข้า, ซึ่งเลื่อนเส้น supply ตลาดไปทางขวาและดันราคาลง

    บริษัทแข่งขันสมบูรณ์สร้างเพียงกำไรปกติในระยะยาว
    บริษัทในสภาพตลาดแข่งขันสมบูรณ์จะกำไรเพียงปกติในระยะยาว
    • ระยะสั้น: บริษัทอาจได้รับกำไร,平衡 (break even), หรือขาดทุน โดยผลิตที่ $P=MC$
    • ระยะยาว: การเข้าและออกของตลาดจะ驱使บริษัทสู่ กำไรทางเศรษฐศาสตร์เป็นศูนย์ โดยผลิตที่ $P=MC=ATC$ ที่ระดับ ATC ต่ำสุด ประสิทธิภาพสองด้านนี้ – ประสิทธิภาพการผลิต (ผลผลิตต้นทุนต่ำสุด) และ ประสิทธิภาพการกระจายทรัพยากร ($P=MC$, ดังนั้นมูลค่าของหน่วยสุดท้ายเท่ากับต้นทุน) – เป็นเกณฑ์มาตรฐานในการตัดสินโครงสร้างตลาดอื่นๆ ทุกประเภท

    ทักษะข้อสอบ: สามารถวาดกราฟตลาดและกราฟบริษัทเดี่ยววางคู่กัน แสดงกำไรหรือขาดทุนในระยะสั้น จากนั้นแสดงว่าการเข้า/ออกของตลาด如何去 restore ความสมดุลระยะยาวที่ระดับ ATC ต่ำสุด

    Explore · ⁨สำรวจ⁩

    A price-taking firm in a competitive market · ⁨บริษัทที่เป็นผู้รับราคาในตลาดแข่งขัน⁩

    In perfect competition the market sets the price and each firm is a price-taker. It produces where price equals marginal cost, earning zero economic profit in the long run. · ⁨ใน การแข่งขันสมบูรณ์ ตลาดกำหนดราคาและแต่ละบริษัทเป็น ผู้รับราคา They ผลิตที่จุดที่ราคาเท่ากับต้นทุนเชิงพจน์ โดยได้รับกำไรทางเศรษฐศาสตร์เป็นศูนย์ในระยะยาว⁩

    3.7

    Exam tips · ⁨ข้อแนะนำสำหรับการสอบ⁩

    English
    • Know the cost curves: AFC falls, ATC/AVC are U-shaped, and MC cuts ATC and AVC at their minimums.
    • Every firm maximises profit at MR = MC; check the shutdown rule ($P \ge AVC$ in the short run).
    • Distinguish accounting profit (revenue − explicit costs) from economic profit (also minus implicit/opportunity costs); zero economic profit is normal.
    • "Diminishing returns" is short-run (one fixed input); "economies of scale" is long-run (all inputs vary).
    • In perfect competition $P=MR=AR$; entry/exit drive long-run economic profit to zero at minimum ATC.
    ไทย
    • รู้เส้นโค้งต้นทุน: AFC ลดลง, ATC/AVC มีรูปตัว U, และ MC ตัด ATC และ AVC ที่จุดต่ำสุด ของแต่ละเส้น
    • บริษัททุกแห่งเพิ่มกำไรสูงสุดที่ MR = MC; ตรวจสอบกฎปิดกิจการ ($P \ge AVC$ ในระยะสั้น)
    • แยกแยะระหว่าง กำไรทางบัญชี (รายได้ − ต้นทุนชัดเจน) กับ กำไรทางเศรษฐศาสตร์ (ลบต้นทุนอ้อม/โอกาสด้วย); กำไรทางเศรษฐศาสตร์เป็นศูนย์คือกำไรปกติ
    • "ผลตอบแทนลดถอย" (Diminishing returns) เป็นระยะสั้น (มีปัจจัยการผลิตหนึ่งตัวคงที่); " economies of scale " เป็นระยะยาว (ปัจจัยการผลิตทั้งหมดเปลี่ยนแปลง)
    • ในตลาดแข่งขันสมบูรณ์ $P=MR=AR$; การเข้า/ออกของตลาดไปทำให้กำไรทางเศรษฐศาสตร์ระยะยาวเป็นศูนย์ที่ระดับ ATC ต่ำสุด
  • 4

    Imperfect Competition · ⁨การแข่งขันที่ไม่สมบูรณ์⁩

    Watch lesson · ⁨ดูบทเรียน⁩
    4.1

    Imperfect Competition and Market Power · ⁨ตลาดไม่สมบูรณ์แบบและอำนาจตลาด⁩

    Syllabus · ⁨หลักสูตร⁩
    English

    Enduring Understanding (PRD-3): Even with a common goal of profit-maximization, market structure constrains and influences prices, output, and efficiency.

    Learning Objective PRD-3.B: a. Define (using graphs where appropriate) the characteristics of imperfectly competitive markets and inefficiency.

    • PRD-3.B.1 Imperfectly competitive markets include monopoly, oligopoly, and monopolistic competition in product markets and monopsony in factor markets.
    • PRD-3.B.2 In imperfectly competitive output markets and assuming all else is constant, a firm must lower price to sell additional units.
    • PRD-3.B.3 In imperfectly competitive markets, consumers and producers respond to prices that are above the marginal costs of production and/or marginal benefits of consumption (i.e., price is greater than marginal cost in an inefficient market).
    • PRD-3.B.4 Incentives to enter an industry may be mitigated by barriers to entry. Barriers to entry—such as high fixed/start-up costs, legal barriers to entry, and exclusive ownership of key resources—can sustain imperfectly competitive market structures.
    ไทย

    ความเข้าใจที่ยั่งยืน (PRD-3): แม้จะมีเป้าหมายร่วมกันคือการทำให้กำไรสูงสุด โครงสร้างตลาดก็จำกัดและมีอิทธิพลต่อราคา outputs และประสิทธิภาพ

    วัตถุประสงค์การเรียนรู้ PRD-3.B: a. นิยาม (โดยใช้กราฟเมื่อเหมาะสม) ลักษณะของตลาดที่ไม่แข่งขันสมบูรณ์และความไม่ประสิทธิภาพ

    • PRD-3.B.1 ตลาดที่ไม่แข่งขันสมบูรณ์ประกอบด้วย มอนوپولی โอลิโกปولی และการแข่งขันแบบมอโนโปลิสติกในตลาดสินค้า และโมโนปซันในตลาดปัจจัยการผลิต
    • PRD-3.B.2 ในตลาดผลผลิตที่ไม่แข่งขันสมบูรณ์และโดยสมมติว่าสิ่งอื่นใดคงที่ บริษัทต้องลดราคาเพื่อขายหน่วยเพิ่มเติมได้
    • PRD-3.B.3 ในตลาดที่ไม่แข่งขันสมบูรณ์ ผู้บริโภคและผู้ผลิตตอบสนองต่อราคาที่สูงกว่าต้นทุนส่วนเพิ่มของการผลิตและ/หรือประโยชน์ส่วนเพิ่มจากการบริโภค (นั่นคือ ราคาสูงกว่าต้นทุนส่วนเพิ่มในตลาดที่ไม่มีประสิทธิภาพ)
    • PRD-3.B.4 แรงจูงใจในการเข้าสู่อุตสาหกรรมอาจถูกจำกัดด้วยกำแพงการเข้า壁垒 barriers to entry กำแพงการเข้า壁垒 เช่น ต้นทุนคงที่/เริ่มต้นสูง ขีดจำกัดทางกฎหมายต่อการเข้า壁垒 และการเป็นเจ้าของแหล่งทรัพยากรสำคัญเพียงฝ่ายเดียว สามารถรักษาโครงสร้างตลาดที่ไม่แข่งขันสมบูรณ์ไว้ได้

    Source: College Board AP Course and Exam Description · ⁨แหล่งที่มา: คำอธิบายหลักสูตรและข้อสอบ College Board AP⁩

    English

    Most real markets are imperfectly competitive 不完全竞争: firms have some market power 市场势力 – the ability to set price rather than take it. The source of that power is a downward-sloping demand curve facing the firm, which means that to sell one more unit the firm must lower the price on all units.

    Because of this, marginal revenue is below price ($MR) for every firm with market power. On a straight-line demand curve the MR curve has the same intercept but twice the slope, lying below demand. This one fact – $MR – separates every imperfect market from perfect competition and explains why they produce less and charge more.

    Worked example. A firm with market power faces demand $P=100-Q$. Selling $1$ unit gives $P=\$99$ and total revenue $\$99$; selling a $2$nd forces the price down to $\$98$ on both units, so revenue rises to $2\times98=\$196$. The marginal revenue of that $2$nd unit is $196-99=\$97$ – below its $\$98$ price. In general $MR=100-2Q$, falling twice as fast as demand.

    ไทย
    สายประกอบรถยนต์: อำนาจตลาดและขนาดบริษัทแตกต่างกันภายใต้ตลาดไม่สมบูรณ์แบบ
    สายประกอบรถยนต์: อำนาจตลาดและขนาดบริษัทแตกต่างกันภายใต้ตลาดไม่สมบูรณ์แบบ

    ตลาดส่วนใหญ่ในโลกจริงเป็น ตลาดไม่สมบูรณ์แบบ: บริษัทมี อำนาจตลาด บางส่วน – ซึ่งคือการกำหนดราคาเองได้แทนที่จะรับราคาตามตลาด แหล่งที่มาของอำนาจนี้คือ เส้นความต้องการที่มีแนวโน้มลดลง ที่บริษัทเผชิญ ซึ่งหมายความว่าเพื่อขายสินค้าเพิ่มอีกหนึ่งหน่วย บริษัทต้อง ลดราคาสำหรับสินค้าทุกหน่วย

    โครงสร้างตลาดมีความหลากหลายตั้งแต่ตลาดแข่งขันสมบูรณ์ไปจนถึงผูกขาด
    โครงสร้างตลาดมีความหลากหลายตั้งแต่ตลาดแข่งขันสมบูรณ์ไปจนถึงผูกขาด

    เนื่องจาก原因นี้ รายได้ส่วนเพิ่ม (Marginal Revenue) จะต่ำกว่าราคา ($MR) สำหรับบริษัททุกแห่งที่มีอำนาจตลาด บนเส้นความต้องการที่เป็นเส้นตรง เส้น MR จะมีจุดตัดแกนเดียวกันแต่มี ความชันเป็นสองเท่า อยู่ใต้เส้นความต้องการ ข้อเท็จจริงเดียวนี้ – $MR – แยกตลาดที่ไม่สมบูรณ์แบบออกจากตลาดแข่งขันสมบูรณ์ และอธิบายว่าทำไมจึงผลิต น้อยลง และคิดราคา สูงกว่า

    ตัวอย่างวิธีทำ. บริษัทที่มีอำนาจตลาดเผชิญกับเส้นความต้องการ $P=100-Q$. การขาย $1$ หน่วย ให้ $P=\$99$ and total revenue $\$99$; การขาย $2$nd ทำให้ราคาตกลงมาอยู่ที่ $\$98$ on both units, so revenue rises to $2×98=$196$. รายได้ส่วนเพิ่มของ$2$nd หน่วยนั้นคือ$196-99=$97$– below its$$98$ราคา โดยทั่วไป$MR=100-2Q$, ลดลงสองเท่าของความชันของเส้นความต้องการ

    4.2

    Monopoly · ⁨การผูกขาด⁩

    Syllabus · ⁨หลักสูตร⁩
    English

    Enduring Understanding (PRD-3): Even with a common goal of profit-maximization, market structure constrains and influences prices, output, and efficiency.

    Learning Objective PRD-3.B: b. Explain (using graphs where appropriate) equilibrium, firm decision making, consumer surplus, producer surplus, profit (loss), and deadweight loss in imperfectly competitive markets and why prices in imperfectly competitive markets cannot be relied on to coordinate the actions of all possible market participants and can lead to inefficient outputs. c. Calculate (using data from a graph or table as appropriate) areas of consumer surplus, producer surplus, profit (loss), and deadweight loss in imperfectly competitive markets.

    • PRD-3.B.5 A monopoly exists because of barriers to entry.
    • PRD-3.B.6 In a monopoly, equilibrium (profit-maximizing) quantity is determined by equating marginal revenue (MR) to marginal cost (MC). The price charged is greater than the marginal cost.
      • Equation: $MR = MC$
    • PRD-3.B.7 In a natural monopoly, long-run economies of scale for a single firm exist throughout the entire effective demand of its product.
    ไทย

    ความเข้าใจที่ยั่งยืน (PRD-3): แม้จะมีเป้าหมายร่วมกันคือการทำให้กำไรสูงสุด โครงสร้างตลาดก็จำกัดและมีอิทธิพลต่อราคา outputs และประสิทธิภาพ

    วัตถุประสงค์การเรียนรู้ PRD-3.B: b. อธิบาย (โดยใช้กราฟเมื่อเหมาะสม) ภาวะสมดุล การตัดสินใจของบริษัท ความเหลือเฟือของผู้บริโภค ความเหลือเฟือของผู้ผลิต กำไร (ขาดทุน) และความสูญเสียที่ไร้ประสิทธิภาพ (deadweight loss) ในตลาดที่ไม่แข่งขันสมบูรณ์ และทำไมราคาในตลาดที่ไม่แข่งขันสมบูรณ์จึงไม่สามารถเชื่อถือได้ว่าจะประสานการกระทำของผู้เข้าร่วมตลาดทั้งหมดและนำไปสู่ผลลัพธ์ที่ไม่มีประสิทธิภาพ c. คำนวณ (โดยใช้ข้อมูลจากกราฟหรือตารางเมื่อเหมาะสม) พื้นที่ของความเหลือเฟือของผู้บริโภค ความเหลือเฟือของผู้ผลิต กำไร (ขาดทุน) และความสูญเสียที่ไร้ประสิทธิภาพในตลาดที่ไม่แข่งขันสมบูรณ์

    • PRD-3.B.5 มอนوپolibol เกิดขึ้นเนื่องจากกำแพงการเข้า壁垒
    • PRD-3.B.6 ในมอนوپolibol ปริมาณในภาวะสมดุล (เพื่อทำกำไรมากที่สุด) ถูกกำหนดโดยการทำให้รายได้ส่วนเพิ่ม (MR) เท่ากับต้นทุนส่วนเพิ่ม (MC) ราคาที่เรียกเก็บจะสูงกว่าต้นทุนส่วนเพิ่ม
      • สมการ: $MR = MC$
    • PRD-3.B.7 ในมอนوپolibol ตามธรรมชาติ ประโยชน์จาก economies of scale ของบริษัทเดียวมีอยู่ตลอดทั้งช่วงความต้องการที่มีประสิทธิผลของผลิตภัณฑ์

    Source: College Board AP Course and Exam Description · ⁨แหล่งที่มา: คำอธิบายหลักสูตรและข้อสอบ College Board AP⁩

    English
    Monopoly: MR = MC pricing

    A monopoly 垄断 is a single seller of a product with no close substitutes, protected by barriers to entry 进入壁垒 (economies of scale – a natural monopoly 自然垄断 – control of a key resource, patents, or government license).

    • The monopolist maximizes profit at $MR=MC$, then charges the highest price the demand curve allows at that quantity (read price up to the demand curve, not the MR curve).
    • Compared with perfect competition it produces less and charges more, earning long-run economic profit because entry is blocked.
    • This under-production creates deadweight loss 无谓损失 – the monopoly is allocatively inefficient because $P>MC$: the last unit is worth more than it costs, yet is not made.

    Governments may respond with antitrust 反垄断 law, or regulate a natural monopoly's price toward $P=MC$ (socially optimal, but may cause a loss) or $P=ATC$ (fair-return, break-even).

    Exam skill: the monopoly graph is a staple – show quantity at $MR=MC$, price up on the demand curve, and shade profit (between $P$ and $ATC$) and deadweight loss (the triangle to the competitive quantity).

    ไทย
    การผูกขาด: กำหนดราคาโดย MR = MC

    การผูกขาด คือผู้ขายรายเดียวของผลิตภัณฑ์ที่ไม่มีสินค้าทดแทนที่ใกล้เคียงกัน ปกป้องด้วย กำแพงการเข้าสู่ตลาด (economies of scale – natural monopoly – การควบคุมแหล่งทรัพยากรสำคัญ, สิทธิบัตร, หรือใบอนุญาตจากรัฐบาล)

    การผูกขาดเพิ่มกำไรสูงสุดที่ MC = MR และสามารถทำกำไรเกินปกติ
    การผูกขาดเพิ่มกำไรสูงสุดที่ MC = MR และสามารถทำกำไรเกินปกติ
    • ผู้ผูกขาดเพิ่มกำไรสูงสุดที่ $MR=MC$, จากนั้นกำหนด ราคาสูงสุดที่เส้นความต้องการอนุญาต ที่ปริมาณนั้น (อ่านราคาขึ้นไปที่เส้นความต้องการ ไม่ใช่เส้น MR)
    • เมื่อเทียบกับตลาดแข่งขันสมบูรณ์ ผลิต น้อยลง และคิดราคา สูงกว่า, ทำกำไรทางเศรษฐศาสตร์ในระยะยาวเพราะการเข้าสู่ตลาดถูกขัดขวาง
    • การผลิตที่น้อยเกินไปนี้สร้าง deadweight loss – การผูกขาดเป็น allocatively inefficient เพราะ $P>MC$: หน่วยสุดท้ายมีค่ามากกว่าต้นทุน แต่ไม่ได้ผลิตออกมา

    รัฐบาลอาจตอบสนอง bằng กฎหมายต่อต้านการผูกขาด, หรือควบคุมราคาของ natural monopoly ให้เข้าใกล้ $P=MC$ (** socially optimal , แต่อาจทำให้ขาดทุน) หรือ $P=ATC$ ( fair-return **, break-even)

    ทักษะข้อสอบ: กราฟการผูกขาดเป็นเรื่องพื้นฐาน – แสดงปริมาณที่ $MR=MC$, ราคาขึ้นไปที่เส้นความต้องการ, และ shade กำไร (ระหว่าง $P$ และ $ATC$) และ deadweight loss (สามเหลี่ยมไปยังปริมาณตลาดแข่งขัน)

    โรงงานพลังงานขนาดใหญ่: การผูกขาดและอำนาจตลาดหมายถึงบริษัทเดียวสามารถกำหนดราคาเหนือ marginal cost
    โรงงานพลังงานขนาดใหญ่: การผูกขาดและอำนาจตลาดหมายถึงบริษัทเดียวสามารถกำหนดราคาเหนือ marginal cost
    Explore · ⁨สำรวจ⁩

    A monopoly's cost curves · ⁨เส้นโค้งต้นทุนของมอโนโพลี⁩

    A monopoly is the sole seller, so it faces the whole downward demand curve and its marginal revenue lies below price. It produces where MR = MC — less output, higher price than competition. · ⁨มอโนโพลี เป็นผู้ขายเพียงรายเดียว ดังนั้นจึง面对的ทั้งเส้นอุปสงค์แนวลง และรายได้เชิงพจน์จะต่ำกว่าราคา They ผลิตที่ MR = MC — ผลผลิตน้อยกว่า ราคาสูงกว่าในตลาดแข่งขัน⁩

    Vocabulary · ⁨คำศัพท์⁩ Train · ⁨ฝึกฝน⁩
    English ไทย
    imperfectly competitive/ɪmˈpɜːfektlɪ kəmˈpetɪtɪv/ การแข่งขันไม่สมบูรณ์
    market power/ˈmɑːkɪt ˈpaʊə/ อำนาจตลาด
    monopoly/məˈnɒpəli/ มอนوپولی
    barriers to entry/ˈbærɪəz tʊ ˈentri/ กำแพงเข้าสู่ตลาด
    natural monopoly/ˈnætʃərəl məˈnɒpəli/ моноโพลธรรมชาติ
    deadweight loss/ˈdedweɪt lɒs/ deadweight loss
    antitrust/ˌæntɪˈtrʌst/ antitrust
    4.3

    Price Discrimination · ⁨การแบ่งแยกราคา⁩

    Syllabus · ⁨หลักสูตร⁩
    English

    Enduring Understanding (PRD-3): Even with a common goal of profit-maximization, market structure constrains and influences prices, output, and efficiency.

    Learning Objective PRD-3.B: b. Explain (using graphs where appropriate) equilibrium, firm decision making, consumer surplus, producer surplus, profit (loss), and deadweight loss in imperfectly competitive markets and why prices in imperfectly competitive markets cannot be relied on to coordinate the actions of all possible market participants and can lead to inefficient outputs. c. Calculate (using data from a graph or table as appropriate) areas of consumer surplus, producer surplus, profit (loss), and deadweight loss in imperfectly competitive markets.

    • PRD-3.B.8 A firm with market power can engage in price discrimination to increase its profits or capture additional consumer surplus under certain conditions.
    • PRD-3.B.9 With perfect price discrimination, a monopolist produces the quantity where price equals marginal cost (just as a competitive market would) but extracts all economic surplus associated with its product and eliminates all deadweight loss.
      • Equation: $P = MC$
    ไทย

    ความเข้าใจที่ยั่งยืน (PRD-3): แม้จะมีเป้าหมายร่วมกันคือการทำให้กำไรสูงสุด โครงสร้างตลาดก็จำกัดและมีอิทธิพลต่อราคา outputs และประสิทธิภาพ

    วัตถุประสงค์การเรียนรู้ PRD-3.B: b. อธิบาย (โดยใช้กราฟเมื่อเหมาะสม) ภาวะสมดุล การตัดสินใจของบริษัท ความเหลือเฟือของผู้บริโภค ความเหลือเฟือของผู้ผลิต กำไร (ขาดทุน) และความสูญเสียที่ไร้ประสิทธิภาพ (deadweight loss) ในตลาดที่ไม่แข่งขันสมบูรณ์ และทำไมราคาในตลาดที่ไม่แข่งขันสมบูรณ์จึงไม่สามารถเชื่อถือได้ว่าจะประสานการกระทำของผู้เข้าร่วมตลาดทั้งหมดและนำไปสู่ผลลัพธ์ที่ไม่มีประสิทธิภาพ c. คำนวณ (โดยใช้ข้อมูลจากกราฟหรือตารางเมื่อเหมาะสม) พื้นที่ของความเหลือเฟือของผู้บริโภค ความเหลือเฟือของผู้ผลิต กำไร (ขาดทุน) และความสูญเสียที่ไร้ประสิทธิภาพในตลาดที่ไม่แข่งขันสมบูรณ์

    • PRD-3.B.8 บริษัทที่มีอำนาจในตลาดสามารถดำเนินการแบ่งแยก pricing เพื่อเพิ่มกำไรหรือจับความเหลือเฟือของผู้บริโภคเพิ่มเติมภายใต้เงื่อนไขบางประการ
    • PRD-3.B.9 ด้วยการแบ่งแยก price อย่างสมบูรณ์ มอนوپolibol ผลิตที่ปริมาณที่ราคาเท่ากับต้นทุนส่วนเพิ่ม (เหมือนตลาดที่แข่งขัน) แต่ดึงเอาความเหลือเฟือทางเศรษฐกิจทั้งหมดที่เกี่ยวข้องกับผลิตภัณฑ์ของตนออกมาและกำจัดความสูญเสียที่ไร้ประสิทธิภาพทั้งหมด
      • สมการ: $P = MC$

    Source: College Board AP Course and Exam Description · ⁨แหล่งที่มา: คำอธิบายหลักสูตรและข้อสอบ College Board AP⁩

    English

    Price discrimination 价格歧视 is charging different buyers different prices for the same good. It requires market power, the ability to separate buyers by willingness to pay, and the ability to prevent resale.

    Under perfect (first-degree) price discrimination, the firm charges each buyer their maximum price. The result: the firm produces the efficient quantity (where $P=MC$, no deadweight loss), but converts all consumer surplus into producer surplus (profit). Real examples – student discounts, airline fares, coupons – are partial versions.

    ไทย

    Price discrimination คือการเรียกเก็บราคาต่างจากลูกค้าแต่ละคนสำหรับสินค้าเดียวกัน ต้องมี อำนาจตลาด, ความสามารถในการ แยก ลูกค้าตาม willingness to pay, และความสามารถในการ ป้องกันการขายต่อ

    ภายใต้ perfect (first-degree) price discrimination, บริษัทเรียกเก็บราคาสูงสุดจากลูกค้าแต่ละคน ผลลัพธ์: บริษัทผลิตปริมาณ efficient (ที่ $P=MC$, ไม่มี deadweight loss), แต่แปลง consumer surplus ทั้งหมด เป็น producer surplus (กำไร) ตัวอย่างในโลกจริง – ส่วนลดนักศึกษา, fares flights, คูปอง – เป็นรูปแบบ partial

    Explore · ⁨สำรวจ⁩

    Elasticity and price discrimination · ⁨ความยืดหยุ่นและการแบ่งแยกราคา⁩

    Price discrimination charges each group a different price by their elasticity: inelastic buyers (who won't switch) pay more, elastic buyers pay less. Stretch the curve to see why. · ⁨การแบ่งแยกราคา เก็บเงินจากแต่ละกลุ่มด้วยราคาต่างกันตาม ความยืดหยุ่น: ผู้ซื้อที่ไม่ยืดหยุ่น (who ไม่เปลี่ยนแบรนด์) จ่ายแพงกว่า ผู้ซื้อที่ยืดหยุ่นจ่ายน้อยกว่า ดึงเส้นโค้งเพื่อดูเหตุผล⁩

    Vocabulary · ⁨คำศัพท์⁩ Train · ⁨ฝึกฝน⁩
    English ไทย
    Price discrimination/praɪs dɪˌskrɪmɪˈneɪʃn/ การแบ่งราคา
    4.4

    Monopolistic Competition · ⁨การแข่งขันแบบ Monopolistic Competition⁩

    Syllabus · ⁨หลักสูตร⁩
    English

    Enduring Understanding (PRD-3): Even with a common goal of profit-maximization, market structure constrains and influences prices, output, and efficiency.

    Learning Objective PRD-3.B: b. Explain (using graphs where appropriate) equilibrium, firm decision making, consumer surplus, producer surplus, profit (loss), and deadweight loss in imperfectly competitive markets and why prices in imperfectly competitive markets cannot be relied on to coordinate the actions of all possible market participants and can lead to inefficient outputs. c. Calculate (using data from a graph or table as appropriate) areas of consumer surplus, producer surplus, profit (loss), and deadweight loss in imperfectly competitive markets.

    • PRD-3.B.10 In a market with monopolistic competition, firms producing differentiated products may earn positive, negative, or zero economic profit in the short run. Firms typically use advertising as a means of differentiating their product. Free entry and exit drive profits to zero in the long run. The output level, however, is smaller than the output level needed to minimize average total costs, creating excess capacity. The price is greater than marginal cost, creating allocative inefficiency.
    ไทย

    ความเข้าใจที่ยั่งยืน (PRD-3): แม้จะมีเป้าหมายร่วมกันคือการทำให้กำไรสูงสุด โครงสร้างตลาดก็จำกัดและมีอิทธิพลต่อราคา outputs และประสิทธิภาพ

    วัตถุประสงค์การเรียนรู้ PRD-3.B: b. อธิบาย (โดยใช้กราฟเมื่อเหมาะสม) ภาวะสมดุล การตัดสินใจของบริษัท ความเหลือเฟือของผู้บริโภค ความเหลือเฟือของผู้ผลิต กำไร (ขาดทุน) และความสูญเสียที่ไร้ประสิทธิภาพ (deadweight loss) ในตลาดที่ไม่แข่งขันสมบูรณ์ และทำไมราคาในตลาดที่ไม่แข่งขันสมบูรณ์จึงไม่สามารถเชื่อถือได้ว่าจะประสานการกระทำของผู้เข้าร่วมตลาดทั้งหมดและนำไปสู่ผลลัพธ์ที่ไม่มีประสิทธิภาพ c. คำนวณ (โดยใช้ข้อมูลจากกราฟหรือตารางเมื่อเหมาะสม) พื้นที่ของความเหลือเฟือของผู้บริโภค ความเหลือเฟือของผู้ผลิต กำไร (ขาดทุน) และความสูญเสียที่ไร้ประสิทธิภาพในตลาดที่ไม่แข่งขันสมบูรณ์

    • PRD-3.B.10 ในตลาดที่มีการแข่งขันแบบมอโนโปลิสติก บริษัทที่ผลิตสินค้าที่แตกต่างอาจได้รับกำไรทางเศรษฐกิจเป็นบวก เป็นลบ หรือเป็นศูนย์ในระยะสั้น บริษัทมักใช้การโฆษณาเป็น Means เพื่อสร้างความแตกต่างให้กับสินค้า loro Entry และ Exit ที่อิสระจะผลักกำไรให้เป็นศูนย์ในระยะยาว อย่างไรก็ตาม ระดับผลผลิตนั้นน้อยกว่าระดับผลผลิตที่ต้องการเพื่อลดค่าเฉลี่ยรวมให้ต่ำสุดที่สุด สร้าง excess capacity ราคาสูงกว่าต้นทุนส่วนเพิ่ม สร้างความไม่ประสิทธิภาพในการจัดสรรทรัพยากร

    Source: College Board AP Course and Exam Description · ⁨แหล่งที่มา: คำอธิบายหลักสูตรและข้อสอบ College Board AP⁩

    English

    Monopolistic competition 垄断竞争 has many firms selling differentiated 差异化 products with easy entry and exit (restaurants, salons, clothing brands). Product differentiation gives each firm a downward-sloping demand curve and thus some price-setting power.

    • Short run: like a monopoly – produce at $MR=MC$, and profit or loss is possible.
    • Long run: easy entry competes away profit, so each firm earns zero economic profit, producing where demand is tangent to ATC.
    • Because it still charges $P>MC$ and does not produce at minimum ATC, it has excess capacity 过剩产能 and is neither allocatively nor productively efficient. The trade-off society accepts is product variety and choice.
    ไทย

    Monopolistic competition มี many firms ขาย differentiated products พร้อม easy entry and exit (ร้านอาหาร, สาลอน, แบรนด์เสื้อผ้า) Product differentiation ให้แต่ละบริษัทมี downward-sloping demand curve และดังนั้นจึงมีอำนาจกำหนดราคาบ้าง

    • ระยะสั้น: เหมือนการผูกขาด – ผลิตที่ $MR=MC$, และกำไรหรือขาดทุนเป็นไปได้
    • ระยะยาว: การเข้าตลาดที่ง่ายจะแข่งขันจนกำไรหายไป, ดังนั้นแต่ละบริษัทจะได้ zero economic profit, ผลิตที่เส้นความต้องการ tangent กับ ATC
    • เนื่องจากยังกำหนด $P>MC$ และ not ผลิตที่ระดับ ATC ต่ำสุด จึงมี excess capacity และไม่ neither allocatively nor productively efficient. Trade-off ที่สังคมยอมรับคือ product variety และทางเลือก
    Vocabulary · ⁨คำศัพท์⁩ Train · ⁨ฝึกฝน⁩
    English ไทย
    Monopolistic competition/məˈnɒpəlɪstɪk ˌkɒmpəˈtɪʃn/ การแข่งขันแบบผูกขาด
    differentiated/ˌdɪfəˈrenʃɪeɪtɪd/ มีความแตกต่างกัน
    excess capacity/ekˈses kəˈpæsɪti/ ความจุส่วนเกิน
    4.5

    Oligopoly and Game Theory · ⁨Oligopoly และทฤษฎีเกม⁩

    Syllabus · ⁨หลักสูตร⁩
    English

    Enduring Understanding (PRD-3): Even with a common goal of profit-maximization, market structure constrains and influences prices, output, and efficiency.

    Learning Objective PRD-3.C: a. Define (using tables as appropriate) key terms, strategies, and concepts relating to oligopolies and simple games. b. Explain (using tables as appropriate) strategies and equilibria in simple games and the connections to theoretical behaviors in various oligopoly market and non-market settings. c. Calculate (using tables as appropriate) the incentive sufficient to alter a player's dominant strategy.

    • PRD-3.C.1 An oligopoly is an inefficient market structure with high barriers to entry, where there are few firms acting interdependently.
    • PRD-3.C.2 Firms in an oligopoly have an incentive to collude and form cartels.
    • PRD-3.C.3 A game is a situation in which a number of individuals take actions, and the payoff for each individual depends directly on both the individual's own choice and the choices of others.
    • PRD-3.C.4 A strategy is a complete plan of actions for playing a game; the normal form model of a game shows the payoffs that result from each collection of strategies (one for each player).
    • PRD-3.C.5 A player has a dominant strategy when the payoff to a particular action is always higher independent of the action taken by the other player.
    • PRD-3.C.6 A Nash equilibrium is a condition describing the set of actions in which no player can increase his or her payoff by unilaterally taking another action, given the other players' actions.
      • Exclusion statement: Dominant strategies and Nash equilibrium with more than two players or more than two actions per player, mixed-strategy equilibria, extensive form games, and normal form games with more than two players or more than two actions per player are beyond the scope of the course and the AP Exam.
    • PRD-3.C.7 Oligopolists have difficulty achieving the monopoly outcome for reasons similar to those that prevent players from achieving a cooperative outcome in the Prisoner's Dilemma; nevertheless, prices are generally higher and quantities lower with oligopoly (or duopoly) than with perfect competition.
    ไทย

    ความเข้าใจที่ยั่งยืน (PRD-3): แม้จะมีเป้าหมายร่วมกันคือการทำให้กำไรสูงสุด โครงสร้างตลาดก็จำกัดและมีอิทธิพลต่อราคา outputs และประสิทธิภาพ

    วัตถุประสงค์การเรียนรู้ PRD-3.C: a. นิยาม (โดยใช้ตารางเมื่อเหมาะสม) คำศัพท์ กลยุทธ์ และแนวคิดหลักเกี่ยวกับโอลิگوปoli และเกม đơn giản b. อธิบาย (โดยใช้ตารางเมื่อเหมาะสม) กลยุทธ์และภาวะสมดุลในเกม đơn giảnและความเชื่อมโยงกับพฤติกรรมเชิงทฤษฎีในสภาพแวดล้อมตลาดและนอกตลาดต่างๆ ของโอลิگوปoli c. คำนวณ (โดยใช้ตารางเมื่อเหมาะสม) แรงจูงใจที่เพียงพอที่จะเปลี่ยน dominant strategy ของผู้เล่น

    • PRD-3.C.1 โอลิگوปoli เป็นโครงสร้างตลาดที่ไม่มีประสิทธิภาพซึ่งมีกำแพงการเข้า壁垒สูง และมีบริษัทจำนวนน้อยที่กระทำอย่างพึ่งพาซึ่งกันและกัน
    • PRD-3.C.2 บริษัทในโอลิگوปoli มีแรงจูงใจที่จะ collusion และสร้าง cartel
    • PRD-3.C.3 เกมคือสถานการณ์ที่บุคคลจำนวนมาก采取行动 และผลตอบแทนของแต่ละบุคคลขึ้นอยู่กับทั้งตัวเลือกของตนเองและตัวเลือกของผู้อื่นโดยตรง
    • PRD-3.C.4 กลยุทธ์คือแผนการกระทำที่ครบถ้วนสำหรับการเล่นเกม; แบบจำลองรูปแบบปกติ (normal form model) ของเกมแสดงผลตอบแทนที่เกิดจากการรวมกลยุทธ์แต่ละชุด (หนึ่งสำหรับแต่ละผู้เล่น)
    • PRD-3.C.5 ผู้เล่นมี dominant strategy เมื่อผลตอบแทนจากการกระทำเฉพาะอย่างหนึ่งสูงกว่าเสมอโดยไม่ขึ้นอยู่กับ اینکه player คนอื่นเลือกทำอะไร
    • PRD-3.C.6 Nash equilibrium คือสภาวะที่อธิบายชุดการกระทำซึ่งไม่มีผู้เล่นคนใดสามารถเพิ่มผลตอบแทนของตนได้โดยการเปลี่ยนทางเลือกโดยลำพัง给定การกระทำของผู้เล่นคนอื่น
      • ข้อความยกเว้น: กลยุทธ์เด่นและสมดุลแนชที่มีผู้เล่นมากกว่าสองคนหรือมากกว่าสองทางเลือกต่อผู้เล่น, สมดุลกลยุทธ์ผสม, เกมในรูปขยาย และเกมในรูปปกติที่มีผู้เล่นมากกว่าสองคนหรือมากกว่าสองทางเลือกต่อผู้เล่นอยู่นอกเหนือขอบเขตของหลักสูตรและข้อสอบ AP
    • PRD-3.C.7 บริษัทในอุตสาหกรรมออลิโกปอลیมีความยากที่จะบรรลุผลลัพธ์แบบผูกขาด เนื่องจากเหตุผลคล้ายคลึงกับที่ขัดขวางผู้เล่นจากการบรรลุผลลัพธ์ร่วมมือในเกม Prisoner's Dilemma; อย่างไรก็ตาม ราคาโดยทั่วไปจะสูงกว่าและปริมาณต่ำกว่าในกรณีของออลิโกปอลี (หรือไดโอปอลี) เมื่อเทียบกับตลาดแข่งขันสมบูรณ์

    Source: College Board AP Course and Exam Description · ⁨แหล่งที่มา: คำอธิบายหลักสูตรและข้อสอบ College Board AP⁩

    English

    An oligopoly 寡头垄断 is a market with a few large, interdependent 相互依存 firms (cars, airlines, phones). Because each firm's best move depends on rivals' moves, we analyze them with game theory 博弈论.

    • A payoff matrix 收益矩阵 shows each firm's profit for every combination of choices.
    • A dominant strategy 优势策略 is a firm's best choice regardless of what the rival does.
    • A Nash equilibrium 纳什均衡 is an outcome where no firm can do better by unilaterally changing its choice.
    • The classic prisoners' dilemma 囚徒困境 shows why firms often fail to cooperate: both would gain by colluding 勾结 (acting like a monopoly), but each has an incentive to cheat, so they end up at the competitive-ish, lower-profit outcome. Collusion and cartels 卡特尔 are unstable for the same reason (and usually illegal).

    Worked example. Two firms each choose a High or Low price. Profits (A, B): both High $\to(10,10)$; A Low, B High $\to(14,4)$; A High, B Low $\to(4,14)$; both Low $\to(6,6)$. For A: if B plays High, Low ($14$) beats High ($10$); if B plays Low, Low ($6$) beats High ($4$) – so Low is A's dominant strategy, and by symmetry B's too. The Nash equilibrium is both Low $(6,6)$, worse for both than the cooperative $(10,10)$ – the prisoners' dilemma in action.

    Exam skill: be able to find each firm's dominant strategy and the Nash equilibrium from a 2×2 payoff matrix, and explain why the cooperative outcome is hard to sustain.

    ไทย

    ออลิกوپอลี่ (oligopoly) คือตลาดที่มี บริษัทใหญ่จำนวนน้อย ที่มีความ พึ่งพาซึ่งกันและกัน (เช่น รถยนต์, สายการบิน, โทรศัพท์) เนื่องจากกลยุทธ์ที่ดีที่สุดของแต่ละบริษัทขึ้นอยู่กับกลยุทธ์ของคู่แข่ง เราจึงวิเคราะห์ด้วย ทฤษฎีเกม

    • เมทริกซ์ผลตอบแทน (payoff matrix) แสดงกำไรของแต่ละบริษัทสำหรับทุกชุดการเลือก
    • กลยุทธ์ที่เหนือกว่า (dominant strategy) คือทางเลือกที่ดีที่สุดของบริษัท โดยไม่ importar ว่าคู่แข่งจะทำอะไร
    • สมดุลนัช (Nash equilibrium) คือผลลัพธ์ที่ ไม่มี บริษัทใดสามารถทำได้ดีขึ้นโดยการเปลี่ยนทางเลือกเพียงฝ่ายเดียว
    • กรณีศึกษาคลาสสิกเรื่อง ความขัดแย้งของนักโทษ (prisoners' dilemma) แสดงว่าทำไมบริษัทมักล้มเหลวในการร่วมมือ: ทั้งคู่จะได้ประโยชน์จากการ ** collusion** ( behaving like a monopoly) แต่แต่ละฝ่ายมีแรงจูงใจที่จะโกง ดังนั้นจึงจบลงที่ผลลัพธ์ที่คล้ายการแข่งขันและมีกำไรต่ำกว่า Collusion และ คาร์เทล ไม่เสถียรด้วยเหตุผลเดียวกัน (และมักผิดกฎหมาย)

    ตัวอย่างวิธีทำ. บริษัทสองแห่งเลือก ราคาสูง หรือ ราคาต่ำ กำไร (A, B): สูงทั้งคู่ $\to(10,10)$; A ต่ำ, B สูง $\to(14,4)$; A สูง, B ต่ำ $\to(4,14)$; ต่ำทั้งคู่ $\to(6,6)$. สำหรับ A: ถ้า B เลือกสูง, ต่ำ ($14$) ดีกว่า สูง ($10$); ถ้า B เลือกต่ำ, ต่ำ ($6$) ดีกว่า สูง ($4$) – ดังนั้น ต่าคือกลยุทธ์ที่เหนือกว่าของ A และโดยสมมาตร B ก็เช่นกัน สมดุลนัชคือ ทั้งสองเลือกต่ำ $(6,6)$, ซึ่งแย่กว่าทั้งสองเมื่อเทียบกับผลรวมความร่วมมือ $(10,10)$ – ความขัดแย้งของนักโทษในทางปฏิบัติ

    ความขัดแย้งของนักโทษ: กลยุทธ์ที่เหนือกว่าของแต่ละบริษัทคือต่ำ ซึ่งนำไปสู่สมดุลนัช
    ความขัดแย้งของนักโทษ: กลยุทธ์ที่เหนือกว่าของแต่ละบริษัทคือต่ำ ซึ่งนำไปสู่สมดุลนัช

    ทักษะการสอบ: สามารถหากลยุทธ์ที่เหนือกว่าของแต่ละบริษัทและสมดุลนัชจากเมทริกซ์ผลตอบแทน 2×2 และอธิบายว่าทำไมผลลัพธ์ความร่วมมือถึงยากต่อการรักษาไว้

    Vocabulary · ⁨คำศัพท์⁩ Train · ⁨ฝึกฝน⁩
    English ไทย
    oligopoly/ˌɒlɪˈɡɒpəli/ โอளிโกปอลิ
    interdependent/ˌɪntədɪˈpendənt/ salingสัมพันธ์
    game theory/ɡeɪm ˈθɪəri/ ทฤษฎีเกม
    payoff matrix/ˈpeɪɒf ˈmeɪtrɪks/ เมทริกซ์ผลตอบแทน
    dominant strategy/ˈdɒmɪnənt ˈstrætədʒi/ กลยุทธ์เด่น
    Nash equilibrium/næʃ ˌiːkwɪˈlɪbrɪəm/ จุดสมดุลของนาช
    prisoners' dilemma/ˈprɪzənəz daɪˈlemə/ dilemma ของนักโทษ
    colluding/kəˈluːdɪŋ/ การ collusion
    cartels/kɑːˈtelz/ 卡特尔 cartels
    4.5

    Exam tips · ⁨ข้อแนะนำสำหรับการสอบ⁩

    English
    • A firm with market power faces a downward-sloping demand, so MR < P (MR has twice the slope).
    • A monopoly produces where MR = MC, then charges the price up on the demand curve; it makes deadweight loss because $P > MC$.
    • Under perfect price discrimination the firm produces the efficient quantity but captures all consumer surplus.
    • Monopolistic competition earns zero long-run profit with excess capacity (product variety is the trade-off).
    • In an oligopoly find the dominant strategy and Nash equilibrium from the payoff matrix; the cooperative outcome is hard to sustain.
    ไทย
    • บริษัทที่มีอำนาจตลาดเผชิญกับเส้นความต้องการที่ชันลง ทำให้ MR < P (MR มีความชันเป็นสองเท่า)
    • มอนोโพลผลิตที่ MR = MC แล้วตั้งราคา ตามเส้นความต้องการ; มันสร้าง deadweight loss เพราะ $P > MC$.
    • ภายใต้การกำหนดราคาแบบสมบูรณ์ (perfect price discrimination) บริษัทผลิตปริมาณที่มีประสิทธิภาพแต่เก็บส่วนเกินของผู้บริโภคทั้งหมด
    • การแข่งขันแบบมอโนปอลิสติก (monopolistic competition) ได้กำไรศูนย์ในระยะยาวพร้อมกับความจุส่วนเกิน (ความหลากหลายของสินค้าคือสิ่งที่ต้องแลกมา)
    • ในออลิกอปอลี่ ให้หา กลยุทธ์ที่เหนือกว่า และ สมดุลนัช จากเมทริกซ์ผลตอบแทน; ผลรวมความร่วมมือยากที่จะรักษาไว้
  • 5

    Factor Markets · ⁨ตลาดปัจจัยการผลิต⁩

    Watch lesson · ⁨ดูบทเรียน⁩
    5.1

    Introduction to Factor Markets

    Syllabus · ⁨หลักสูตร⁩
    English

    Enduring Understanding (PRD-4): Factor prices provide incentives and convey information to firms and factors of production.

    Learning Objective PRD-4.A: a. Define (using graphs where appropriate) key terms and concepts relating to factor markets. b. Explain (using graphs where appropriate) the relationship between factors of production, firms, and factor prices. c. Calculate (using data from a graph or table where appropriate) the marginal revenue product and marginal resource cost.

    • PRD-4.A.1 Factors of production (labor, capital, and land) respond to factor prices (wages, interest, and rent), and employers' (firms') decision to hire is based on the productivity of the factors, output price, and cost of the factor.
    • PRD-4.A.2 The quantity of labor demanded is negatively related to the wage rate, while the quantity of labor supplied is positively related to the wage rate in a given labor market, other things constant.
    ไทย

    ความเข้าใจที่ยั่งยืน (PRD-4): ราคาปัจจัยการผลิตทำหน้าที่เป็นแรงจูงใจและส่งข้อมูลไปยังบริษัทและผู้ผลิต

    วัตถุประสงค์การเรียนรู้ PRD-4.A: ก. นิยาม (ใช้กราฟเมื่อเหมาะสม) คำศัพท์และแนวคิดสำคัญที่เกี่ยวข้องกับตลาดปัจจัยการผลิต ข. อธิบาย (ใช้กราฟเมื่อเหมาะสม) ความสัมพันธ์ระหว่างปัจจัยการผลิต บริษัท และราคาปัจจัยการผลิต ค. คำนวณ (ใช้ข้อมูลจากกราฟหรือตารางเมื่อเหมาะสม) ผลผลิตรายเพิ่ม marginal revenue product และต้นทุนทรัพยากรรายเพิ่ม marginal resource cost

    • PRD-4.A.1 ปัจจัยการผลิต (แรงงาน, ทุน, และที่ดิน) ตอบสนองต่อราคาปัจจัยการผลิต (ค่าจ้าง, ดอกเบี้ย, และค่าเช่า) และการตัดสินใจจ้างงานของผู้ประกอบการ (บริษัท) ขึ้นอยู่กับผลผลิตของปัจจัย, ราคาผลผลิต และต้นทุนของปัจจัยนั้น
    • PRD-4.A.2 ปริมาณแรงงานที่ต้องการมีความสัมพันธ์เชิงลบกับอัตราค่าจ้าง ในขณะที่ปริมาณแรงงานที่เสนอมีความสัมพันธ์เชิงบวกกับอัตราค่าจ้างในตลาดแรงงานที่กำหนดให้ โดยพิจารณาเงื่อนไขอื่นคงที่

    Source: College Board AP Course and Exam Description · ⁨แหล่งที่มา: คำอธิบายหลักสูตรและข้อสอบ College Board AP⁩

    A garment factory: factor markets determine wages for labour and other inputs
    A garment factory: factor markets determine wages for labour and other inputs

    A factor market 要素市场 is where firms buy the factors of production – labor, land, capital. The roles reverse: firms demand and households supply. The most-tested factor is labor.

    A competitive labour market sets the wage where labour demand meets labour supply
    A competitive labour market sets the wage where labour demand meets labour supply

    Factor demand is a derived demand 派生需求 – firms want labor not for itself but for the output (and revenue) it produces. So the demand for workers depends on the demand for the product they make.

    Explore · ⁨สำรวจ⁩

    A labour (factor) market · ⁨ตลาดแรงงาน (ปัจจัยการผลิต)⁩

    In a factor market firms demand labour and households supply it; the wage settles where demand meets supply. Shift either curve and watch the wage and employment move. · ⁨ใน ตลาดปัจจัยการผลิต บริษัทต้องการแรงงานและครัวเรือนจัดจำหน่ายแรงงาน; ค่าจ้างจะ/settle ที่จุดอุปสงค์และอุปทานบรรจบกัน ย้ายเส้นใดเส้นหนึ่งแล้วดูว่าค่าจ้างและการจ้างงานเคลื่อนที่อย่างไร⁩

    Vocabulary · ⁨คำศัพท์⁩ Train · ⁨ฝึกฝน⁩
    English ไทย
    factor market/ˈfæktə ˈmɑːkɪt/ ตลาดปัจจัยการผลิต
    derived demand/dɪˈraɪvd dɪˈmænd/ ความต้องการที่มาจาก
    5.2

    Changes in Factor Demand and Factor Supply

    Syllabus · ⁨หลักสูตร⁩
    English

    Enduring Understanding (PRD-4): Factor prices provide incentives and convey information to firms and factors of production.

    Learning Objective PRD-4.B: Explain (using graphs where appropriate) firms' and factors' responses to changes in incentives and constraints.

    • PRD-4.B.1 Changes in the determinants of labor demand, such as the output price and the productivity of the worker, cause the labor demand curve to shift.
    • PRD-4.B.2 Changes in the determinants of labor supply (such as immigration, education, working conditions, age distribution, availability of alternative options, preferences for leisure, and cultural expectations) cause the labor supply curve to shift.
    ไทย

    ความเข้าใจที่ยั่งยืน (PRD-4): ราคาปัจจัยการผลิตทำหน้าที่เป็นแรงจูงใจและส่งข้อมูลไปยังบริษัทและผู้ผลิต

    วัตถุประสงค์การเรียนรู้ PRD-4.B: อธิบาย (ใช้กราฟเมื่อเหมาะสม) การตอบสนองของบริษัทและผู้ผลิตต่อการเปลี่ยนแปลงของแรงจูงใจและข้อจำกัด

    • PRD-4.B.1 การเปลี่ยนแปลงตัวกำหนดความต้องการแรงงาน เช่น ราคาผลผลิต และผลผลิตของลูกจ้าง ทำให้เส้นความต้องการแรงงานเคลื่อนที่
    • PRD-4.B.2 การเปลี่ยนแปลงตัวกำหนดอุปทานแรงงาน (เช่น การอพยพ, การศึกษา, สภาพแวดล้อมการทำงาน, โครงสร้างอายุ, ความพร้อมของทางเลือกอื่น, ความชอบในการพักผ่อน放松, และความคาดหวังทางวัฒนธรรม) ทำให้เส้นอุปทานแรงงานเคลื่อนที่

    Source: College Board AP Course and Exam Description · ⁨แหล่งที่มา: คำอธิบายหลักสูตรและข้อสอบ College Board AP⁩

    Labor demand shifts when:

    • the product price or product demand changes (more valuable output $\Rightarrow$ more labor demanded),
    • worker productivity changes (better training or capital),
    • the price of other inputs changes (a substitute input like machines, or a complement).

    Labor supply shifts with the number of qualified workers, immigration, workers' preferences (wages needed to attract them), and the wages available in other jobs. The market wage is set where labor demand meets labor supply.

    5.3

    Profit-Maximizing Behavior in Perfectly Competitive Factor Markets

    Syllabus · ⁨หลักสูตร⁩
    English

    Enduring Understanding (PRD-4): Factor prices provide incentives and convey information to firms and factors of production.

    Learning Objective PRD-4.C: a. Define (using graphs as appropriate) the characteristics of perfectly competitive factor markets. b. Explain (using graphs where appropriate) the profit-maximizing behavior of firms buying labor (with other inputs fixed) in perfectly competitive markets. c. Calculate (using data from a graph or table where appropriate) measures representing the profit-maximizing behavior of firms buying labor (with other inputs fixed) in perfectly competitive markets.

    • PRD-4.C.1 In a perfectly competitive labor market, the wage is set by the market and each firm hires the quantity of workers, where the marginal factor (resource) cost (wage) equals the marginal revenue product of labor. A typical firm may be a perfect competitor in the labor market even if it is an imperfect competitor in its output markets.
    • PRD-4.C.2 A typical firm hires labor in a perfectly competitive labor market as long as the marginal revenue product of labor is greater than the market wage.
    • PRD-4.C.3 To minimize costs or maximize profits, firms allocate inputs such that the last dollar spent on each input yields the same amount of marginal product.
    ไทย

    ความเข้าใจที่ยั่งยืน (PRD-4): ราคาปัจจัยการผลิตทำหน้าที่เป็นแรงจูงใจและส่งข้อมูลไปยังบริษัทและผู้ผลิต

    วัตถุประสงค์การเรียนรู้ PRD-4.C: ก. นิยาม (ใช้กราฟเมื่อเหมาะสม) ลักษณะของตลาดปัจจัยการผลิตแบบแข่งขันสมบูรณ์ ข. อธิบาย (ใช้กราฟเมื่อเหมาะสม) พฤติกรรมเพื่อผลกำไรสูงสุดของบริษัทผู้ซื้อแรงงาน (โดยสมมติว่าปัจจัยอื่นๆ คงที่) ในตลาดแข่งขันสมบูรณ์ ค. คำนวณ (ใช้ข้อมูลจากกราฟหรือตารางเมื่อเหมาะสม) ตัวชี้วัดที่แสดงถึงพฤติกรรมเพื่อผลกำไรสูงสุดของบริษัทผู้ซื้อแรงงาน (โดยสมมติว่าปัจจัยอื่นๆ คงที่) ในตลาดแข่งขันสมบูรณ์

    • PRD-4.C.1 ในตลาดแรงงานแบบแข่งขันสมบูรณ์ ค่าจ้างถูกกำหนดโดยตลาด และแต่ละบริษัทจะจ้างแรงงานในปริมาณที่ต้นทุนทรัพยากรรายเพิ่ม (ค่าจ้าง) เท่ากับผลผลิตรายเพิ่มของแรงงาน A firm อาจเป็นผู้แข่งขันสมบูรณ์ในตลาดแรงงาน แม้ว่าจะเป็นผู้ไม่สมบูรณ์ในตลาดขายสินค้าก็ตาม
    • PRD-4.C.2 บริษัททั่วไปจะจ้างแรงงานในตลาดแรงงานแบบแข่งขัน solange ผลผลิตรายเพิ่มของแรงงานสูงกว่าค่าจ้างในตลาด
    • PRD-4.C.3 เพื่อลดต้นทุนหรือเพิ่มผลกำไร บริษัทจะจัดสรรปัจจัยการผลิตโดย使得การใช้จ่ายเงินหนึ่งบาทสุดท้ายในแต่ละปัจจัยให้ผลผลิตรายเพิ่มเท่ากัน

    Source: College Board AP Course and Exam Description · ⁨แหล่งที่มา: คำอธิบายหลักสูตรและข้อสอบ College Board AP⁩

    A firm decides how many workers to hire with the same marginal logic as everything else – compare the marginal benefit and marginal cost of one more worker.

    • The marginal benefit of a worker is the marginal revenue product 边际收益产品 (MRP): the extra revenue from one more worker, $MRP = MP \times$ product price (in a competitive product market, where $P=MR$). MRP falls as more workers are hired, because of diminishing marginal product.
    • The marginal cost of a worker is the wage (in a competitive labor market the firm is a wage taker, so marginal factor cost $=$ the wage).
    • Hiring rule: hire workers up to where $MRP = \text{wage}$ (more generally, $MRP = MFC$). The MRP curve is the firm's labor demand curve.

    Worked example. A worker's marginal product is $8$ units and the firm sells each in a competitive market for $\$5$, so $MRP=8\times\$5=\$40$. If the wage is $\$30$, the firm hires this worker because $MRP>\text{wage}$. As more workers join, diminishing marginal product pulls MRP down; the firm keeps hiring until a worker whose $MP=6$ gives $MRP=6\times\$5=\$30$, exactly the wage – the profit-maximizing stopping point.

    To choose the least-cost combination of two inputs, set the MP-per-dollar equal across inputs: $\dfrac{MP_L}{P_L}=\dfrac{MP_K}{P_K}$ – the same equal-bang-per-buck rule as consumer choice.

    Exam skill: compute MRP from a table (marginal product $\times$ price) and find how many workers to hire at a given wage – a common free-response task.

    A car assembly line: firms hire labour until the marginal revenue product equals the wage
    A car assembly line: firms hire labour until the marginal revenue product equals the wage
    Vocabulary · ⁨คำศัพท์⁩ Train · ⁨ฝึกฝน⁩
    English ไทย
    marginal revenue product/ˈmɑːdʒɪnl ˈrevənjuː ˈprɒdʌkt/ รายได้ส่วนเพิ่มจากปัจจัย
    5.4

    Monopsonistic Markets

    Syllabus · ⁨หลักสูตร⁩
    English

    Enduring Understanding (PRD-4): Factor prices provide incentives and convey information to firms and factors of production.

    Learning Objective PRD-4.D: a. Define (using graphs as appropriate) the characteristics of monopsonistic markets. b. Explain (using graphs where appropriate) the profit-maximizing behavior of firms buying labor (with other inputs fixed) in monopsonistic markets. c. Calculate (using data from a graph or table where appropriate) measures representing the profit-maximizing behavior of firms buying labor (with other inputs fixed) in monopsonistic markets.

    • PRD-4.D.1 In a monopsonistic labor market, a typical firm hires additional labor as long as the marginal revenue product is greater than the marginal factor (resource) cost (the wage of a new unit of labor plus the wage increase given to all existing labor).
    • PRD-4.D.2 When a typical firm hires additional workers in a monopsonistic labor market, the marginal factor (resource) cost is greater than the supply price of labor.
    ไทย

    ความเข้าใจที่ยั่งยืน (PRD-4): ราคาปัจจัยการผลิตทำหน้าที่เป็นแรงจูงใจและส่งข้อมูลไปยังบริษัทและผู้ผลิต

    วัตถุประสงค์การเรียนรู้ PRD-4.D: ก. นิยาม (ใช้กราฟเมื่อเหมาะสม) ลักษณะของตลาด monopsonistic ข. อธิบาย (ใช้กราฟเมื่อเหมาะสม) พฤติกรรมเพื่อผลกำไรสูงสุดของบริษัทผู้ซื้อแรงงาน (โดยสมมติว่าปัจจัยอื่นๆ คงที่) ในตลาด monopsonistic ค. คำนวณ (ใช้ข้อมูลจากกราฟหรือตารางเมื่อเหมาะสม) ตัวชี้วัดที่แสดงถึงพฤติกรรมเพื่อผลกำไรสูงสุดของบริษัทผู้ซื้อแรงงาน (โดยสมมติว่าปัจจัยอื่นๆ คงที่) ในตลาด monopsonistic

    • PRD-4.D.1 ในตลาดแรงงานแบบ monopsonistic บริษัททั่วไปจะจ้างแรงงานเพิ่มเติมตราบใดที่ผลผลิตรายเพิ่มสูงกว่าต้นทุนทรัพยากรรายเพิ่ม (ค่าจ้างของหน่วยแรงงานใหม่บวกกับการขึ้นค่าจ้างให้กับแรงงานทั้งหมดที่มีอยู่)
    • PRD-4.D.2 เมื่อบริษัททั่วไปจ้างแรงงานเพิ่มขึ้นในตลาดแรงงานแบบ monopsonistic ต้นทุนทรัพยากรรายเพิ่มจะสูงกว่าราคาอุปทานของแรงงาน

    Source: College Board AP Course and Exam Description · ⁨แหล่งที่มา: คำอธิบายหลักสูตรและข้อสอบ College Board AP⁩

    A monopsony 买方垄断 is a market with a single buyer of a factor – for example, the only large employer in a town.

    • Because it is the whole market, the monopsonist faces an upward-sloping labor supply curve: to hire more workers it must raise the wage for everyone.
    • So the marginal factor cost 边际要素成本 (MFC) is above the wage (like $MR for a monopoly, in reverse), and the MFC curve lies above the supply curve.
    • The monopsonist hires where $MRP = MFC$, then pays the lower wage the supply curve allows at that quantity.
    • Result: compared with a competitive labor market, a monopsony hires fewer workers at a lower wage – the mirror image of monopoly.
    A monopsony hires where MFC = MRP and pays a lower wage than a competitive market
    A monopsony hires where MFC = MRP and pays a lower wage than a competitive market

    Exam skill: draw the monopsony graph (supply, MFC above it, MRP as demand), mark quantity at $MRP=MFC$ and the wage down on the supply curve, and contrast it with the competitive wage and quantity.

    Vocabulary · ⁨คำศัพท์⁩ Train · ⁨ฝึกฝน⁩
    English ไทย
    monopsony/ˈmɒnəʊpsəni/ โมโนปอสนี
    marginal factor cost/ˈmɑːdʒɪnl ˈfæktə kɒst/ ต้นทุนปัจจัยส่วนเพิ่ม
    5.4

    Exam tips

    • Factor demand is derived demand; hire labour up to where MRP = wage (MRP = marginal product × price).
    • MRP falls as more workers are hired (diminishing marginal product).
    • For least-cost input use, equalise the marginal product per dollar across inputs.
    • A monopsony faces an upward supply, so its marginal factor cost is above the wage; it hires fewer workers at a lower wage.
    • Draw the monopsony graph (supply, MFC above it, MRP as demand) and contrast with the competitive outcome.
  • 6

    Market Failure and the Role of Government · ⁨ความล้มเหลวของตลาดและบทบาทของรัฐบาล⁩

    Watch lesson · ⁨ดูบทเรียน⁩
    6.1

    Socially Efficient and Inefficient Market Outcomes · ⁨ผลลัพธ์ทางเศรษฐกิจที่มีประสิทธิภาพและไม่มีประสิทธิภาพทางสังคม⁩

    Syllabus · ⁨หลักสูตร⁩
    English

    Enduring Understanding (POL-2): Perfectly competitive markets allocate resources efficiently, but imperfect competition often results in market inefficiencies.

    Learning Objective POL-2.A: a. Define social efficiency. b. Explain (using graphs where appropriate) why resource allocation in perfectly competitive markets is socially efficient.

    • POL-2.A.1 The optimal quantity of a good occurs where the marginal benefit of consuming the last unit equals the marginal cost of producing that last unit, thus maximizing total economic surplus.
    • POL-2.A.2 The market equilibrium quantity is equal to the socially optimal quantity only when all social benefits and costs are internalized by individuals in the market. Total economic surplus is maximized at that quantity. [See also PRD-3 and POL-3.]

    Learning Objective POL-2.B: Explain (using graphs where appropriate) how private incentives can lead to actions by rational agents that are socially undesirable (inefficient) market outcomes.

    • POL-2.B.1 Rational agents can pursue private actions to exploit or exercise market characteristics known as market power.
    • POL-2.B.2 Rational agents make optimal decisions by equating private marginal benefits and private marginal costs that can result in market inefficiencies.
    • POL-2.B.3 Policymakers use cost-benefit analysis to evaluate different actions to reduce or eliminate market inefficiencies.
    • POL-2.B.4 Market inefficiencies can be eliminated by designing policies that equate marginal social benefit with marginal social cost.

    Learning Objective POL-2.C: a. Explain equilibrium allocations in imperfect markets relative to efficient allocations (using graphs where appropriate) and why these markets are inefficient. b. Calculate (using graphs where appropriate) the deadweight loss resulting from the production of a non-efficient quantity.

    • POL-2.C.1 Equilibrium allocations can deviate from efficient allocations due to situations such as monopoly; oligopoly; monopolistic competition; negative and positive externalities in production or consumption; asymmetric information; and insufficient production of public goods.
    • POL-2.C.2 Producing any non-efficient quantity results in deadweight loss.
    ไทย

    ความเข้าใจที่ยั่งยืน (POL-2): ตลาดแข่งขันสมบูรณ์จัดสรรทรัพยากรอย่างมีประสิทธิภาพ แต่การแข่งขันที่ไม่สมบูรณ์มักนำไปสู่ความไม่มีประสิทธิภาพของตลาด

    วัตถุประสงค์การเรียนรู้ POL-2.A: ก. นิยามประสิทธิภาพทางสังคม ข. อธิบาย (ใช้กราฟเมื่อเหมาะสม) เหตุผลที่การจัดสรรทรัพยากรในตลาดแข่งขันสมบูรณ์มีประสิทธิภาพในทางสังคม

    • POL-2.A.1 ปริมาณที่เหมาะสมของสินค้าเกิดขึ้นเมื่อผลประโยชน์รายเพิ่มของการบริโภคหน่วยสุดท้ายเท่ากับต้นทุนรายเพิ่มของการผลิตหน่วยสุดท้าย ซึ่งทำให้ส่วนเกินทางเศรษฐกิจรวมสูงสุด
    • POL-2.A.2 ปริมาณสมดุลของตลาดจะเท่ากับปริมาณที่เหมาะสมในทางสังคมก็ต่อเมื่อผลประโยชน์และต้นทุนทางสังคมทั้งหมดถูกนำมารวมไว้ในพฤติกรรมของบุคคลในตลาด ส่วนเกินทางเศรษฐกิจรวมจะสูงสุดที่ปริมาณนี้ [ดูHEADER: PRD-3 และ POL-3]

    วัตถุประสงค์การเรียนรู้ POL-2.B: อธิบาย (ใช้กราฟเมื่อเหมาะสม) แรงจูงใจส่วนตัวสามารถนำไปสู่การกระทำของ agen ที่มีความเหตุผลซึ่งส่งผลต่อผลลัพธ์ตลาดที่ไม่พึงประสงค์ (ไม่มีประสิทธิภาพ) ในทางสังคมได้อย่างไร

    • POL-2.B.1 Agen ที่มีความเหตุผลอาจดำเนินการส่วนตัวเพื่อแสวงหาประโยชน์หรือใช้คุณสมบัติของตลาดที่เรียกว่าอำนาจตลาด
    • POL-2.B.2 ตัวแทนที่มีเหตุผลตัดสินใจอย่างเหมาะสมโดยเทียบเท่าผลประโยชน์ส่วนเพิ่มส่วนบุคคลและต้นทุนส่วนเพิ่มส่วนบุคคล ซึ่งอาจนำไปสู่ความไม่ประสิทธิภาพของตลาด
    • POL-2.B.3 ผู้กำหนดนโยบายใช้การวิเคราะห์ต้นทุนและผลประโยชน์เพื่อประเมินทางเลือกต่างๆ ในการลดหรือขจัดความไม่ประสิทธิภาพของตลาด
    • POL-2.B.4 ความไม่ประสิทธิภาพของตลาดสามารถถูกขจัดได้โดยการออกแบบนโยบายที่เทียบเท่าผลประโยชน์ส่วนเพิ่มทางสังคมกับต้นทุนส่วนเพิ่มทางสังคม

    จุดประสงค์การเรียนรู้ POL-2.C: a. อธิบายการจัดสรรสมดุลในตลาดที่ไม่สมบูรณ์เมื่อเทียบกับการจัดสรรที่มีประสิทธิภาพ (โดยใช้กราฟเมื่อเหมาะสม) และทำไมตลาดเหล่านี้จึงไม่มีประสิทธิภาพ b. คำนวณ (โดยใช้กราฟเมื่อเหมาะสม) ความสูญเสียทางเศรษฐกิจจากการผลิตปริมาณที่ไม่มีประสิทธิภาพ

    • POL-2.C.1 การจัดสรรสมดุลอาจเบี่ยงเบนไปจากการจัดสรรที่มีประสิทธิภาพเนื่องจากสถานการณ์เช่น มอนوپولی; ออลิโกปอลี่; การแข่งขันแบบมอนوپoliko; ผลภายนอกเชิงลบและบวกในการผลิตหรือการบริโภค; ข้อมูลที่ไม่สมมาตร; และการผลิตสาธารณูปโภคที่ไม่เพียงพอ
    • POL-2.C.2 การผลิตปริมาณที่ไม่ประสิทธิภาพใดๆ ล้วนก่อให้เกิดความสูญเสียทางเศรษฐกิจ

    Source: College Board AP Course and Exam Description · ⁨แหล่งที่มา: คำอธิบายหลักสูตรและข้อสอบ College Board AP⁩

    English

    A market outcome is socially efficient 社会有效率 when it maximizes total surplus – when the marginal social benefit equals the marginal social cost of the last unit. Perfect competition reaches this on its own. But sometimes markets fail to, producing too much or too little. This is market failure 市场失灵, and it is the main economic justification for government action.

    ไทย

    ผลลัพธ์ทางตลาดจะ มีประสิทธิภาพทางสังคม เมื่อเพิ่มส่วนเกินรวมสูงสุด – เมื่อ ประโยชน์ทางสังคมผลเพิ่ม เท่ากับ ต้นทุนทางสังคมผลเพิ่ม ของหน่วยสุดท้าย การแข่งขันที่สมบูรณ์ถึงจุดนี้ได้โดยธรรมชาติ แต่บางครั้งตลาดล้มเหลวที่จะทำ如此会产生过多หรือ过少的产品。นี่คือ ความล้มเหลวของตลาด และเป็นเหตุผลหลักทางเศรษฐศาสตร์สำหรับการแทรกแซงของรัฐบาล

    ประสิทธิภาพในการผลิตคือต้นทุนต่ำสุด; ประสิทธิภาพในการจัดสรรคือการผลิตสิ่งที่ผู้คนต้องการ
    ประสิทธิภาพในการผลิตคือต้นทุนต่ำสุด; ประสิทธิภาพในการจัดสรรคือการผลิตสิ่งที่ผู้คนต้องการ
    6.2

    Externalities · ⁨ภายนอกities⁩

    Syllabus · ⁨หลักสูตร⁩
    English

    Enduring Understanding (POL-3): Private incentives can fail to account for all socially relevant considerations.

    Learning Objective POL-3.A: a. Define externalities. b. Explain (using graphs where appropriate) how in the presence of externalities, private markets do not take into consideration social costs or social benefits.

    • POL-3.A.1 The socially optimal quantity of a good occurs where the marginal social benefit of consuming the last unit equals the marginal social cost of producing that last unit, thus maximizing total economic surplus.
    • POL-3.A.2 Externalities are either positive or negative and arise from lack of well-defined property rights and/or high transaction costs.
    • POL-3.A.3 In the presence of externalities, rational agents respond to private costs and benefits and not to external costs and benefits.
    • POL-3.A.4 Rational agents have the incentive to free ride when a good is non-excludable.

    Learning Objective POL-3.B: Explain (using graphs where appropriate) how public policies address positive or negative externalities.

    • POL-3.B.1 Policies that address positive or negative externalities include taxes/subsidies, environmental regulation, public provision, the assignment of property rights, and the reassignment of property rights through private transactions.
    ไทย

    ความเข้าใจที่ยั่งยืน (POL-3): แรงจูงใจส่วนบุคคลอาจไม่ได้พิจารณาข้อพิจารณาที่เกี่ยวข้องต่อสังคมทั้งหมด

    วัตถุประสงค์การเรียนรู้ POL-3.A: a. นิยามผลภายนอก b. อธิบาย (โดยใช้กราฟเมื่อเหมาะสม) ว่าภายใต้สภาวะที่มีผลภายนอก ตลาดส่วนบุคคลไม่ได้คำนึงถึงต้นทุนทางสังคมหรือผลประโยชน์ทางสังคม

    • POL-3.A.1 ปริมาณที่เหมาะสมทางสังคมเกิดขึ้นเมื่อผลประโยชน์ส่วนเพิ่มจากการบริโภคหน่วยสุดท้ายเท่ากับต้นทุนส่วนเพิ่มจากการผลิตหน่วยสุดท้าย thereby สูงสุดรวมความ surplus ทางเศรษฐกิจ
    • POL-3.A.2 ผลภายนอกมีทั้งเชิงบวกและเชิงลบ เกิดขึ้นจากความขาดแคลนสิทธิในทรัพย์สินที่กำหนดไว้ชัดเจนและ/หรือต้นทุนการทำธุรกรรมที่สูง
    • POL-3.A.3 ภายใต้สภาวะที่มีผลภายนอก ตัวแทนที่มีเหตุผลตอบสนองต่อต้นทุนและผลประโยชน์ส่วนบุคคล ไม่ใช่ต่อต้นทุนและผลประโยชน์ภายนอก
    • POL-3.A.4 ตัวแทนที่มีเหตุผลมีแรงจูงใจที่จะใช้ประโยชน์จากบริการสาธารณะโดยไม่จ่าย (free ride) เมื่อสินค้ามีลักษณะไม่สามารถกีดกันการเข้าถึงได้

    จุดประสงค์การเรียนรู้ POL-3.B: อธิบาย (โดยใช้กราฟเมื่อเหมาะสม) ว่านโยบายสาธารณะ如何解决ผลภายนอกเชิงบวกหรือเชิงลบ

    • POL-3.B.1 นโยบายที่จัดการกับผลภายนอกเชิงบวกหรือเชิงลบ ได้แก่ ภาษี/เงินอุดหนุน, กฎระเบียบด้านสิ่งแวดล้อม, การให้บริการสาธารณะ, การมอบสิทธิในทรัพย์สิน, และการโอนย้ายสิทธิในทรัพย์สินผ่านธุรกรรมส่วนตัว

    Source: College Board AP Course and Exam Description · ⁨แหล่งที่มา: คำอธิบายหลักสูตรและข้อสอบ College Board AP⁩

    English
    Negative externalities

    An externality 外部性 is a cost or benefit that falls on a third party not involved in the transaction – so the private decision-makers ignore it.

    • A negative externality 负外部性 (pollution) means marginal social cost > marginal private cost. The market over-produces; the deadweight loss is a triangle. Fixes: a Pigovian tax 庇古税 or regulation to make producers "internalize" the cost (shifting private cost up to social cost).
    • A positive externality 正外部性 (vaccination, education) means marginal social benefit > marginal private benefit. The market under-produces. Fixes: a subsidy to consumers or producers.
    • Coase theorem 科斯定理: if property rights are clear and bargaining is costless, private parties can solve an externality themselves – but that is rare with many people involved.

    Worked example. A factory's private marginal cost of a chemical is $\$8$ per unit, but each unit also dumps $\$3$ of pollution on neighbors, so the marginal social cost is $\$11$. Ignoring the $\$3$, the market over-produces. A Pigovian tax of exactly $\$3$ per unit raises the firm's private cost to $\$11$ – now equal to the social cost – so the firm cuts output to the efficient quantity and the externality is "internalized."

    Exam skill: identify whether an externality is positive or negative, show on a graph that private and social curves diverge, mark the deadweight loss, and name the correcting tax or subsidy.

    ไทย
    บุหรี่: Externalities หมายความว่าตลาดเอกชนอาจไม่สามารถถึงผลลัพธ์ที่มีประสิทธิภาพทางสังคม
    บุหรี่: Externalities หมายความว่าตลาดเอกชนอาจไม่สามารถถึงผลลัพธ์ที่มีประสิทธิภาพทางสังคม
    Externalities แบบลบ

    Externalities คือต้นทุนหรือประโยชน์ที่ตกอยู่กับ บุคคลที่สาม ที่ไม่เกี่ยวข้องกับการซื้อขาย – ดังนั้นผู้ตัดสินใจด้านเอกชนจึงเพิกเฉยต่อมัน
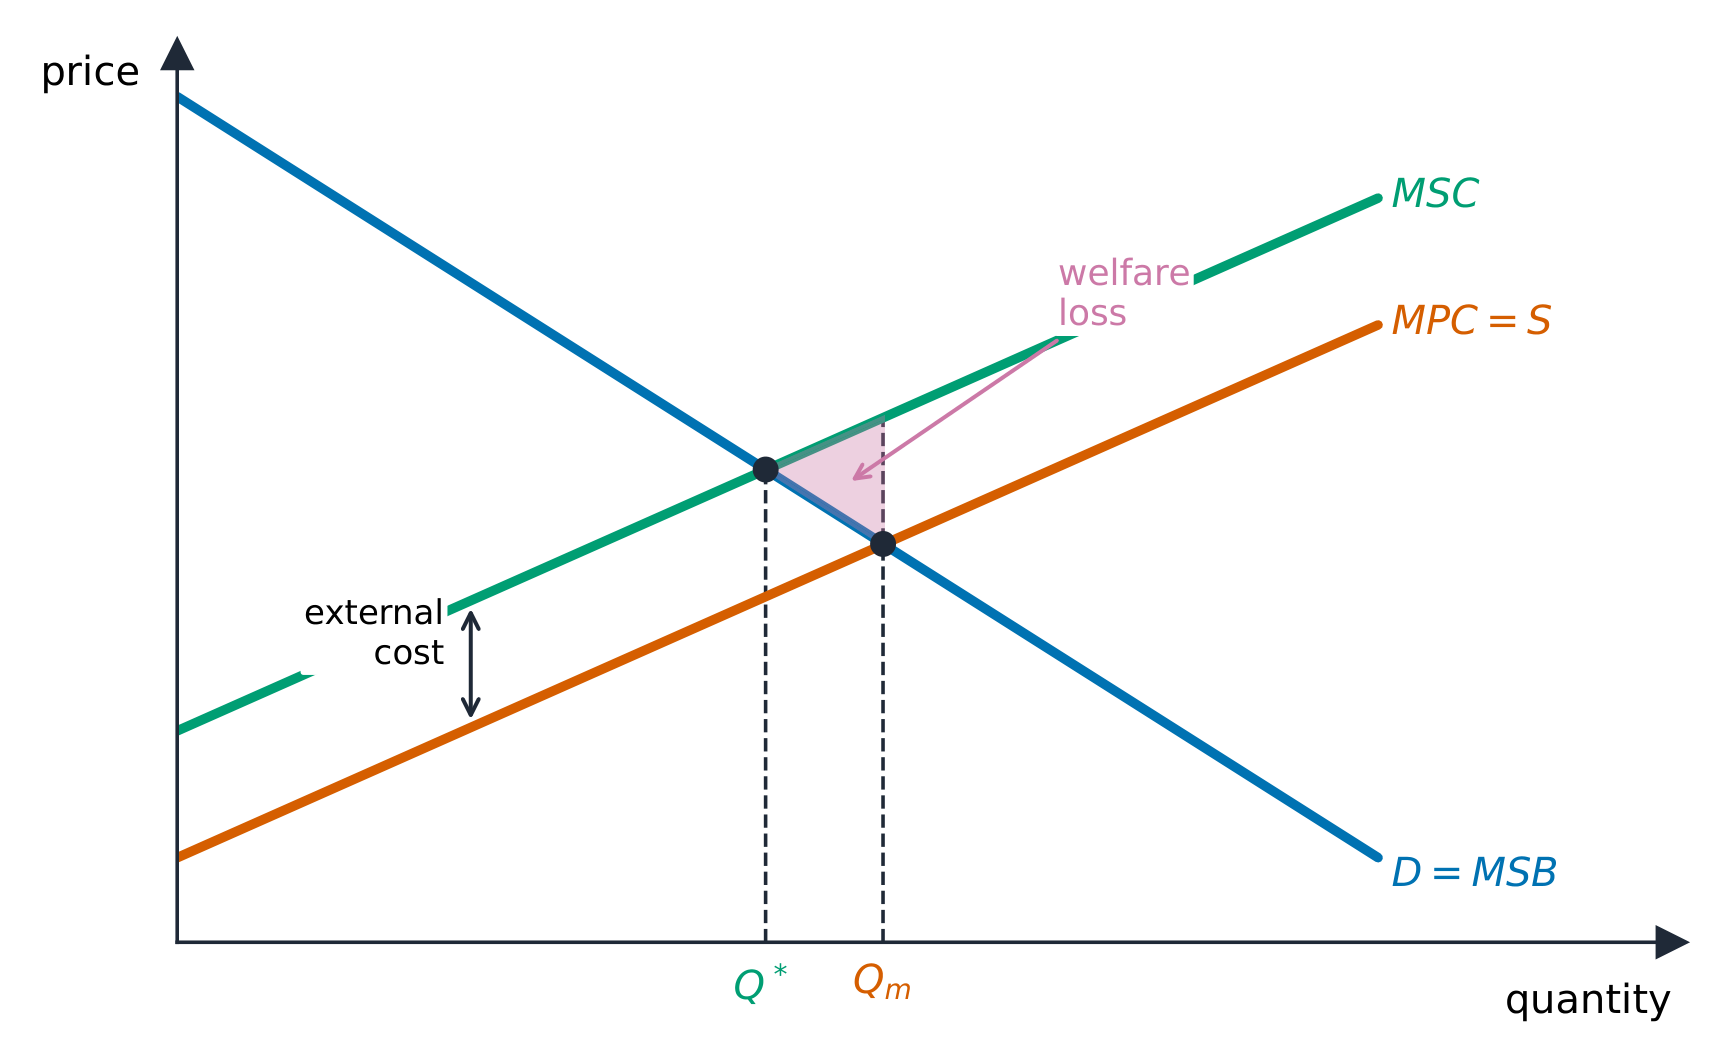
    Externalities แบบลบ: ตลาดผลิตมากเกินไป ส่งผลให้เกิดความสูญเสียสวัสดิการ
    Externalities แบบลบ: ตลาดผลิตมากเกินไป ส่งผลให้เกิดความสูญเสียสวัสดิการ
    • Externalities แบบลบ (มลพิษ) หมายความว่า ต้นทุนทางสังคมผลเพิ่ม > ต้นทุนภาคเอกชนผลเพิ่ม ตลาด ผลิตมากเกินไป ส่วนที่เสียไป (deadweight loss) เป็นรูปสามเหลี่ยม วิธีแก้ไข: ภาษี Pigovian หรือกฎระเบียบเพื่อให้ผู้ผลิต "รับต้นทุนมาไว้ในตัว" (ย้ายต้นทุนภาคเอกชนขึ้นสู่ต้นทุนทางสังคม)
    • Externalities แบบบวก (วัคซีน, การศึกษา) หมายความว่า ประโยชน์ทางสังคมผลเพิ่ม > ประโยชน์ภาคเอกชนผลเพิ่ม ตลาด ผลิตน้อยเกินไป วิธีแก้ไข: เงินอุดหนุน แก่ผู้บริโภคหรือผู้ผลิต
    • ทฤษฎี Coase: หากสิทธิในทรัพย์สินชัดเจนและการเจรจาไม่มีค่าใช้จ่าย ฝ่ายเอกชนสามารถแก้ปัญหา Externalities ได้เอง –แต่นั้นหายากเมื่อมีผู้มีส่วนร่วมจำนวนมาก
    ถนนในเมืองติดขัดแน่นไปด้วยรถยนต์จนหยุดนิ่ง
    ความติดขัดเป็น Externalities แบบลบ: แต่ละคนขับรถสร้างต้นทุนให้กับทุกคนที่ขับรถคนอื่นโดยไม่มีราคาใดเก็บค่า tersebut

    ตัวอย่างวิธีทำ. ต้นทุนผลเพิ่มภาคเอกชนของโรงงานสำหรับสารเคมีหนึ่งคือ $\$8$ per unit, but each unit also dumps $\$3$ จากมลพิษต่อเพื่อนบ้าน ดังนั้นต้นทุน ทางสังคม ผลเพิ่มคือ $\$11$. Ignoring the $\$3$ ตลาดผลิตมากเกินไป ภาษี Pigovian ที่เท่ากับ $\$3$ per unit raises the firm's private cost to $\$11$ พอดี** – ตอนนี้เท่ากับต้นทุนทางสังคม – เพื่อให้บริษัทตัดกำลังการผลิตลงสู่ปริมาณที่มีประสิทธิภาพและ Externalities ถูก "รับเข้ามาภายใน"

    ทักษะการสอบ: ระบุว่าเป็น Externalities แบบบวกหรือลบ แสดงบนกราฟว่าเส้นภาคเอกชนและทางสังคมแยกออกจากกัน标记 deadweight loss และชื่อภาษีหรือเงินอุดหนุนที่ใช้แก้ไข

    มลพิษทางอุตสาหกรรม: ภายนอกเชิงลบที่ต้นทุนทางสังคมสูงกว่าต้นทุนส่วนตัว
    มลพิษอุตสาหกรรม: negative externality ที่ social cost สูงกว่า private cost
    Explore · ⁨สำรวจ⁩

    A market with an externality · ⁨ตลาดที่มี externalities⁩

    An externality makes private cost differ from social cost, so the free-market quantity is inefficient. See the deadweight loss and how a tax or subsidy corrects it. · ⁨Externality ทำให้ต้นทุนส่วนตัวต่างจากต้นทุนสังคม ดังนั้นปริมาณในตลาดเสรีจึงไม่มีประสิทธิภาพ เห็นการสูญเสียdeadweight และวิธีที่ภาษีหรือเงินอุดหนุนแก้ไขปัญหานี้⁩

    Vocabulary · ⁨คำศัพท์⁩ Train · ⁨ฝึกฝน⁩
    English ไทย
    socially efficient/ˈsəʊʃəli ɪˈfɪʃənt/ มีประสิทธิภาพทางสังคม
    market failure/ˈmɑːkɪt ˈfeɪlɪə/ ความล้มเหลวของตลาด
    externality/ekˈstɜːnælɪti/ externality (ผลกระทบภายนอก)
    negative externality/ˈneɡətɪv ekˈstɜːnælɪti/ ผลภายนอกเชิงลบ
    Pigovian tax/pɪˈɡəʊvɪən tæks/ ภาษี Pigovian
    positive externality/ˈpɒzɪtɪv ekˈstɜːnælɪti/ ผลภายนอกเชิงบวก
    Coase theorem/kəʊs ˈθɪərəm/ ทฤษฎี Coase
    rivalry/ˈraɪvəlri/ การแข่งขัน

    excludability/eksˌkluːdəˈbɪlɪti/ ความเป็นข้อยกเว้น

    private good/ˈpraɪvət ɡʊd/ สินค้าเอกชน
    public good/ˈpʌblɪk ɡʊd/ สินค้าสาธารณะ
    free-ride/friː raɪd/ การ游离 free-ride
    Common resources/ˈkɒmən rɪˈzɔːsɪz/ ทรัพยากรร่วม
    6.3

    Public and Private Goods · ⁨สินค้าสาธารณะและสินค้าเอกชน⁩

    Syllabus · ⁨หลักสูตร⁩
    English
    Enduring UnderstandingLearning ObjectiveEssential Knowledge

    POL-3
    Private incentives can fail to account for all socially relevant considerations.

    POL-3.C
    a. Define whether goods are rival and/or excludable.
    b. Explain how the nature of rival and/or excludable goods influences the behavior of individuals and groups.

    • POL-3.C.1 Private goods are rival and excludable, and public goods are non-rival and non-excludable.
    • POL-3.C.2 Due to the free rider problem, private individuals usually lack the incentive to produce public goods, leaving government as the only producer.
    • POL-3.C.3 Governments sometimes choose to produce private goods, such as educational services, and to allow free access to them.
    • POL-3.C.4 Some natural resources are, by their nature, non-excludable and rival and therefore open access. Private individuals inefficiently overconsume such resources.
    ไทย

    ความเข้าใจที่ยั่งยืน (POL-3): แรงจูงใจส่วนบุคคลอาจไม่ได้พิจารณาข้อพิจารณาที่เกี่ยวข้องต่อสังคมทั้งหมด

    Learning ObjectiveEssential Knowledge

    POL-3.C
    a. นิยามว่าสินค้าเป็นแบบใช้ร่วมกัน (rival) และ/หรือ สามารถกีดกันการเข้าถึงได้หรือไม่ (excludable)
    b. อธิบายว่าลักษณะของสินค้าที่เป็นแบบใช้ร่วมกันและ/หรือ กีดกันการเข้าถึงได้ส่งผลต่อพฤติกรรมของบุคคลและกลุ่มอย่างไร

    • POL-3.C.1 สินค้าส่วนบุคคลเป็นแบบใช้ร่วมกันและกีดกันการเข้าถึงได้ ส่วนสาธารณูปโภคเป็นแบบไม่ใช่ใช้ร่วมกันและไม่กีดกันการเข้าถึงได้
    • POL-3.C.2 เนื่องจากปัญหาการใช้ประโยชน์จากบริการสาธารณะโดยไม่จ่าย บุคคลทั่วไปมักขาดแรงจูงใจในการผลิตสาธารณูปโภค ทำให้รัฐบาลเป็นผู้ผลิตเพียงรายเดียว
    • POL-3.C.3 รัฐบาลบางครั้งเลือกที่จะผลิตสินค้าส่วนบุคคล เช่น บริการการศึกษา และอนุญาตให้เข้าถึงได้อย่างอิสระ
    • POL-3.C.4 ทรัพยากรธรรมชาติบางชนิดตามธรรมชาติแล้วไม่กีดกันการเข้าถึงและใช้ร่วมกันได้ จึงเป็นทรัพยากรเปิด (open access) บุคคลทั่วไปใช้ทรัพยากรเหล่านี้เกินความจำเป็นอย่างไม่มีประสิทธิภาพ

    Source: College Board AP Course and Exam Description · ⁨แหล่งที่มา: คำอธิบายหลักสูตรและข้อสอบ College Board AP⁩

    English

    Goods differ along two traits: rivalry 竞争性 (does one person's use reduce another's?) and excludability 排他性 (can non-payers be kept out?).

    • A private good 私人物品 is rival and excludable (a sandwich) – markets handle these well.
    • A public good 公共物品 is non-rival and non-excludable (national defense, a lighthouse). Because non-payers cannot be excluded, people free-ride 搭便车 – enjoy it without paying – so markets under-provide it, and government usually supplies it.
    • Common resources 公共资源 are rival but non-excludable (ocean fish); over-use ruins them – the tragedy of the commons 公地悲剧.
    ไทย

    สินค้าแตกต่างกันตามสองลักษณะ: ความเป็นคู่แข่ง (การใช้ของคนหนึ่งลดการใช้อีกคนหรือไม่?) และ ความสามารถในการกีดกัน (สามารถกัน人不จ่ายออกได้หรือไม่?)

    จำแนกสินค้าตามความเป็นคู่แข่งและความสามารถในการกีดกัน
    จำแนกสินค้าตามความเป็นคู่แข่งและความสามารถในการกีดกัน
    • สินค้าเอกชน เป็นทั้งคู่แข่งและกีดกันได้ (แซนด์วิช) – ตลาดจัดการสิ่งเหล่านี้ได้ดี
    • สินค้าสาธารณะ เป็น ไม่คู่แข่งและไม่กีดกันได้ (การป้องกันประเทศ, เสาไฟ) เนื่องจากไม่จ่ายไม่สามารถถูกกีดกันได้ ผู้คนจึง ขี่ฟรี – ใช้โดยไม่จ่าย – ดังนั้นตลาดจึง จัดหาน้อยเกินไป และรัฐบาลมักเป็นผู้จัดหา
    • ทรัพยากรสาธารณะ เป็นคู่แข่งแต่ไม่กีดกันได้ (ปลาในทะเล); การใช้มากเกินไปทำลายมัน – โศกนาฏกรรมของทรัพยากรสาธารณะ
    6.4

    The Effects of Government Intervention in Different Market Structures · ⁨ผลกระทบของการแทรกแซงของรัฐบาลในโครงสร้างตลาดต่างๆ⁩

    Syllabus · ⁨หลักสูตร⁩
    English
    Enduring UnderstandingLearning ObjectiveEssential Knowledge

    POL-4
    In imperfect markets, well-designed government policy can reduce waste.

    POL-4.A
    a. Define government policy interventions in imperfect markets.
    b. Explain (using graphs where appropriate) how government policies can alter market outcomes in perfectly and imperfectly competitive markets.
    c. Calculate (using data from a graph or table as appropriate) changes in market outcomes resulting from government policies in perfectly competitive and imperfectly competitive markets.

    • POL-4.A.1 Per-unit taxes and subsidies affect the total price consumers pay, net price firms receive, equilibrium quantity, consumer and producer surpluses, deadweight loss, and government revenue or cost. The impact of change depends on the price elasticity of demand and supply.
    • POL-4.A.2 Lump-sum taxes and lump-sum subsidies do not change either marginal cost or marginal benefit; only fixed costs will be affected.
    • POL-4.A.3 Binding price ceilings and floors affect prices and quantities differently depending on the market structures (perfect competition, monopoly, monopolistic competition, and monopsony) and the price elasticities of supply and demand.
    • POL-4.A.4 Government intervention in imperfect markets can increase efficiency if the policy correctly addresses the incentives that led to the market failure.
    • POL-4.A.5 Government can use price regulation to address inefficiency due to monopoly.
    • POL-4.A.6 A natural monopoly will require a lump-sum subsidy to produce at the allocatively efficient quantity.
    • POL-4.A.7 Governments use antitrust policy in an attempt to make markets more competitive.
      • Exclusion statement: A graph of inefficiency and policy due to collusion is beyond the scope of the course and the AP Exam.
    ไทย

    ความเข้าใจที่ยั่งยืน (POL-4): ในตลาดที่ไม่สมบูรณ์ นโยบายรัฐบาลที่ออกแบบอย่างดีสามารถลดการสิ้นเปลืองได้

    Learning ObjectiveEssential Knowledge

    POL-4.A
    a. นิยามการแทรกแซงนโยบายรัฐบาลในตลาดที่ไม่สมบูรณ์
    b. อธิบาย (โดยใช้กราฟเมื่อเหมาะสม) ว่านโยบายรัฐบาลสามารถเปลี่ยนแปลงผลลัพธ์ในตลาดที่แข่งขันสมบูรณ์และไม่สมบูรณ์ได้อย่างไร
    c. คำนวณ (โดยใช้ข้อมูลจากกราฟหรือตารางเมื่อเหมาะสม) การเปลี่ยนแปลงของผลลัพธ์ตลาดอันเกิดจากนโยบาย政府在ตลาดที่แข่งขันสมบูรณ์และไม่สมบูรณ์

    • POL-4.A.1 ภาษีและเงินอุดหนุนต่อหน่วยส่งผลต่อราคาทั้งหมดที่ผู้บริโภคจ่าย, ราคาสุทธิที่ผู้ผลิตได้รับ, ปริมาณสมดุล, ความ surplus ของผู้บริโภคและผู้ผลิต, ความสูญเสียทางเศรษฐกิจ, และรายได้หรือค่าใช้จ่ายของรัฐบาล ผลกระทบของการเปลี่ยนแปลงขึ้นอยู่กับความยืดหยุ่นของราคาของความต้องการและอุปทาน
    • POL-4.A.2 ภาษีและเงินอุดหนุนแบบก้อนรวม (lump-sum) ไม่เปลี่ยนแปลงต้นทุนส่วนเพิ่มหรือผลประโยชน์ส่วนเพิ่ม; เพียงแต่ต้นทุนคงที่เท่านั้นที่จะได้รับผลกระทบ
    • POL-4.A.3 การกำหนดเพดานและเพดานราคาที่มีผลบังคับใช้ส่งผลต่อราคาและปริมาณแตกต่างกันไปตามโครงสร้างตลาด (การแข่งขันสมบูรณ์, มอนوپولی, การแข่งขันแบบมอนوپólico, และ monopsony) และความยืดหยุ่นของราคาของอุปทานและ Demand
    • POL-4.A.4 การแทรกแซงของรัฐบาลในตลาดที่ไม่สมบูรณ์สามารถเพิ่มประสิทธิภาพได้หากนโยบายแก้ไขแรงจูงใจที่นำไปสู่ความล้มเหลวของตลาดได้อย่างถูกต้อง
    • POL-4.A.5 รัฐบาลสามารถใช้การควบคุมราคาเพื่อแก้ไขความไม่ประสิทธิภาพจากมอנוโพลี
    • POL-4.A.6 มอโนโพลีธรรมชาติจะต้องการเงินอุดหนุนแบบก้อนรวมเพื่อผลิตที่ปริมาณที่มีประสิทธิภาพในการจัดสรร
    • POL-4.A.7 รัฐบาลใช้นโยบาย反垄断 (antitrust policy) เพื่อพยายามทำให้ตลาดมีการแข่งขันมากขึ้น
      • คำ声明: กราฟของความไม่ประสิทธิภาพและนโยบายจากการร่วมมือกัน (collusion) อยู่นอกขอบเขตของหลักสูตรและการสอบ AP

    Source: College Board AP Course and Exam Description · ⁨แหล่งที่มา: คำอธิบายหลักสูตรและข้อสอบ College Board AP⁩

    English

    Government tools change outcomes differently by structure:

    • Regulating a monopoly's price toward $P=MC$ can increase efficiency (unlike a price control in a competitive market, which creates shortage/surplus).
    • Antitrust laws 反垄断法 break up or block anti-competitive mergers and collusion.
    • Taxes and subsidies shift output toward the socially efficient quantity when externalities are present.

    The key insight: the same policy can help or hurt efficiency depending on whether the market was already efficient (competitive) or already failing (monopoly, externality).

    Per-unit vs lump-sum. A per-unit tax 从量税 adds to marginal cost, so it shifts supply up, raises price, cuts quantity, and creates deadweight loss. A lump-sum tax 定额税 (a fixed charge like a licence fee) does not change marginal cost or marginal benefit, so in the short run the profit-maximising price and quantity are unchanged – only the firm's profit falls; in the long run it changes entry and exit. For a natural monopoly, regulating price down to $P=MC$ (allocatively efficient) forces a loss, so a lump-sum subsidy 定额补贴 is needed to keep it producing that efficient quantity.

    ไทย

    เครื่องมือของรัฐบาลเปลี่ยนแปลงผลลัพธ์ต่างกันตามโครงสร้าง:

    • การควบคุมราคาคู่моноปولی เข้าใกล้ $P=MC$ สามารถ เพิ่ม ประสิทธิภาพ (ต่างจากการควบคุมราคาในตลาดแบบแข่งขันซึ่งทำให้เกิดการขาดแคลน/ส่วนเกิน)
    • กฎหมาย反垄断 ย่อยสลายหรือ阻止การควบรวมที่ไม่แข่งขันและการ collusion
    • ภาษีและเงินอุดหนุน ย้ายกำลังการผลิตไปสู่ปริมาณที่มีประสิทธิภาพทางสังคมเมื่อมี Externalities

    ข้อคิดสำคัญ: นโยบายเดียวกัน สามารถช่วยหรือทำลายประสิทธิภาพขึ้นอยู่กับว่าตลาดนั้นมีประสิทธิภาพอยู่แล้ว (แบบแข่งขัน) หรือล้มเหลวอยู่แล้ว (คู่ моноปولی, Externalities)

    ภาษีต่อหน่วย vs ภาษีรวมก้อน ภาษีต่อหน่วยเพิ่มต้นทุนส่วนเพิ่ม ทำให้เส้นอุปทานเลื่อนขึ้น ราคาสูงขึ้น ปริมาณลดลง และเกิดการสูญเสียประสิทธิภาพ (deadweight loss) ภาษีรวมก้อน (เช่น ค่าใบอนุญาต) ไม่ เปลี่ยนต้นทุนส่วนเพิ่มหรือประโยชน์ส่วนเพิ่ม ดังนั้นใน ระยะสั้น ราคาและปริมาณที่สูงสุดกำไรจะ คงเดิม – เฉพาะกำไรของกิจการลดลง; ในระยะยาวจะมีผลต่อการเข้าและออกจากการตลาด สำหรับ ธรรมชาติมโนโพลี การควบคุมราคาลงสู่ $P=MC$ (มีประสิทธิภาพเชิงจัดสรร) ทำให้ขาดทุน จึงจำเป็นต้องใช้ เงินอุดหนุนแบบรวมก้อน เพื่อให้ผลิต在那个ปริมาณที่มีประสิทธิภาพนั้นต่อไป

    6.5

    Inequality · ⁨ความเหลื่อมล้ำ⁩

    Syllabus · ⁨หลักสูตร⁩
    English

    Enduring Understanding (POL-5): Market outcomes can result in income inequality.

    Learning Objective POL-5.A: Define measures of economic inequality in income and wealth.

    • POL-5.A.1 Income levels and poverty rates vary greatly both across and within groups (e.g., age, gender, race) and countries.
    • POL-5.A.2 The Lorenz curve and Gini coefficient are used to represent the degree of inequality in distributions and to compare distributions across different countries, policies, or time periods.
      • Exclusion statement: Drawing the Lorenz curve and calculating Gini coefficients are beyond the scope of the course and the AP Exam.

    Learning Objective POL-5.B: Explain sources of income and wealth inequality.

    • POL-5.B.1 Each factor of production receives the value of its marginal product, which can contribute to income inequality.
    • POL-5.B.2 Sources of income and wealth inequality include differences in tax structures (progressive and regressive tax structures), human capital, social capital, inheritance, effects of discrimination, access to financial markets, mobility, and bargaining power within economic and social units (firms, labor unions, and families).
    ไทย

    ความเข้าใจที่ยั่งยืน (POL-5): ผลลัพธ์ของตลาดอาจนำไปสู่ความไม่เท่าเทียมทางรายได้

    จุดประสงค์การเรียนรู้ POL-5.A: นิยามมาตรการวัดความไม่เท่าเทียมทางเศรษฐกิจในด้านรายได้และทรัพย์สิน

    • POL-5.A.1 ระดับรายได้และอัตราความยากจนมีความแตกต่างกันอย่างมากทั้งระหว่างกลุ่มและภายในกลุ่ม (เช่น อายุ เพศ เชื้อชาติ) และประเทศต่างๆ
    • POL-5.A.2 โค้ฟโลเรนซ์และสัมประสิทธิ์จินี่ใช้เพื่อแสดงความระดับความไม่เท่าเทียมในการกระจายตัวและเปรียบเทียบการกระจายตัวระหว่างประเทศ นโยบาย หรือช่วงเวลาต่างๆ
      • ข้อจำกัด: การวาดกราฟโลเรนซ์และการคำนวณสัมประสิทธิ์จินีอยู่นอกขอบเขตของหลักสูตรและข้อสอบ AP

    วัตถุประสงค์การเรียนรู้ POL-5.B: อธิบายแหล่งที่มาของความไม่เท่าเทียมกันด้านรายได้และทรัพย์สิน

    • POL-5.B.1 ปัจจัยการผลิตแต่ละอย่างได้รับมูลค่าตามผลผลิตส่วนเพิ่ม (marginal product) ของมันเอง ซึ่งสามารถนำไปสู่ความไม่เท่าเทียมกันด้านรายได้ได้
    • POL-5.B.2 แหล่งที่มาของความไม่เท่าเทียมกันด้านรายได้และทรัพย์สิน ได้แก่ ความแตกต่างของโครงสร้างภาษี (โครงสร้างภาษีแบบก้าวหน้าและแบบถอยหลัง), ทุนมนุษย์, ทุนทางสังคม, มรดก, ผลกระทบของการเลือกปฏิบัติ, การเข้าถึงตลาดการเงิน, ความคล่องตัว, และอำนาจในการต่อรองภายในหน่วยเศรษฐกิจและสังคม (บริษัท, สหภาพแรงงาน, และครอบครัว)

    Source: College Board AP Course and Exam Description · ⁨แหล่งที่มา: คำอธิบายหลักสูตรและข้อสอบ College Board AP⁩

    English

    Markets reward productivity, but the resulting income distribution 收入分配 can be very unequal. Economists measure it with the Lorenz curve 洛伦兹曲线 (share of income against share of population; the further it bows from the 45° line, the more unequal) and the Gini coefficient 基尼系数 (0 = perfect equality, 1 = perfect inequality).

    Worked example. Suppose the poorest $20\%$ of households earn just $5\%$ of income, while the richest $20\%$ earn $50\%$. Under perfect equality each $20\%$ would earn exactly $20\%$, so the Lorenz curve would be the $45°$ line. Because the bottom fifth is well below $20\%$ and the top fifth well above, the curve bows far beneath the diagonal – a large gap that means a high Gini coefficient and substantial inequality.

    Sources of inequality include differences in human capital 人力资本 (skills, education), inheritance, and discrimination. Governments redistribute through progressive taxes 累进税 (higher rates on higher incomes) and transfer payments 转移支付 (welfare, subsidies). There is a debated efficiency–equity trade-off 效率与公平权衡: redistribution can reduce work incentives, so societies balance fairness against the size of the total pie.

    ไทย

    ตลาดให้รางวัลตามผลผลิต แต่ การกระจายรายได้ ที่เกิดขึ้นอาจมีความเหลื่อมล้ำอย่างมาก นักเศรษฐศาสตร์วัดค่านี้ด้วย กราฟลอเรนซ์ (สัดส่วนรายได้เทียบกับสัดส่วนประชากร; ยิ่งโค้งห่างจากเส้น 45° มากเท่าไร ก็ยิ่งไม่เท่าเทียมมากเท่านั้น) และ สัมประสิทธิ์จินี่ (0 = เท่าเทียมสมบูรณ์, 1 = ไม่เท่าเทียมสมบูรณ์)

    กราฟลอเรนซ์และสัมประสิทธิ์จินี่วัดความเหลื่อมล้ำ
    กราฟลอเรนซ์และสัมประสิทธิ์จินี่วัดความเหลื่อมล้ำ

    ตัวอย่างวิธีทำ. สมมติว่า households ที่ยากจนที่สุด $20\%$ มีรายได้เพียง $5\%$ ในขณะที่ households ที่รวยที่สุด $20\%$ มีรายได้ $50\%$. ภายใต้ความเท่าเทียมกันอย่างสมบูรณ์แต่ละ $20\%$ จะมีรายได้เท่ากับ $20\%$ พอดี ดังนั้น Lorenz curve จะเป็นเส้น $45°$. เนื่องจากกลุ่มล่างสุดอยู่ต่ำกว่า $20\%$ มาก และกลุ่มบนสุดสูงกว่า ทำให้curve โอบอ้อมใต้เส้นทแยงมุมอย่างมาก – ช่องว่างที่ใหญ่บ่งชี้ถึง Gini coefficient สูง และความไม่เสมอภาคอย่างมีนัยสำคัญ

    แหล่งที่มาของความเหลื่อมล้ำรวมถึงความแตกต่างของ ทุนมนุษย์ (ทักษะ, การศึกษา), มรดก และการเลือกปฏิบัติ รัฐบาลดำเนินการจัดสรรใหม่ผ่าน ภาษีขั้นบันได (อัตราภาษีสูงขึ้นเมื่อรายได้สูงขึ้น) และ การชำระเงินโอน (สวัสดิการ, เงินอุดหนุน)仍存在有关于 Trade-off ระหว่างประสิทธิภาพและความเสมอภาค ที่ถกเถียงกัน: การจัดสรรใหม่อาจลดแรงจูงใจในการทำงาน ดังนั้นสังคมจึงต้องสมดุลระหว่างความยุติธรรมกับขนาดของ torta รวม

    มรดกและความยากจนอยู่คู่กัน: ตลาดเพียงอย่างเดียวอาจไม่แก้ปัญหาความเหลื่อมล้ำด้านรายได้ขนาดใหญ่
    มรดกและความยากจนอยู่คู่กัน: ตลาดเพียงอย่างเดียวอาจไม่แก้ปัญหาความเหลื่อมล้ำด้านรายได้ขนาดใหญ่
    Explore · ⁨สำรวจ⁩

    Measure inequality with a Lorenz curve · ⁨วัดความเหลื่อมล้ำด้วยเส้นโลเรนซ์⁩

    A Lorenz curve plots cumulative income against cumulative population; the further it bows from the diagonal, the more unequal — summarised by the Gini coefficient. · ⁨เส้นโลเรนซ์ แสดงรายได้สะสมเทียบกับประชากรสะสม; ยิ่งโค้งห่างจากเส้นทแยงมุมมากยิ่งมีความเหลื่อมล้ำสูง — สรุปโดย สัมประสิทธิ์จินี่⁩

    Vocabulary · ⁨คำศัพท์⁩ Train · ⁨ฝึกฝน⁩
    English ไทย
    Lorenz curve/ˈlɒrənts kɜːv/ เส้นโค้งโลเรนซ์
    Gini coefficient/ˈdʒiːni ˌkəʊɪˈfɪʃənt/ สัมประสิทธิ์ Gini
    human capital/ˈhjuːmən ˈkæpɪtl/ ทุนมนุษย์
    progressive taxes/prəˈɡresɪv ˈtæksɪz/ ภาษีแบบ прогрессिव
    transfer payments/ˈtrænsfɜː ˈpeɪmənts/ การโอนเงิน
    efficiency–equity trade-off/ɪˈfɪʃənsi ˈekwɪti treɪd ɒf/ การแลกเปลี่ยนระหว่างประสิทธิภาพและความเสมอภาค
    6.5

    Exam tips · ⁨ข้อแนะนำสำหรับการสอบ⁩

    English
    • A negative externality makes the market over-produce; correct with a Pigovian tax equal to the external cost. A positive externality under-produces; correct with a subsidy.
    • A public good is non-rival and non-excludable, so free-riding leads markets to under-provide it.
    • Classify goods by rivalry and excludability; common resources (rival, non-excludable) suffer the tragedy of the commons.
    • The same policy can help or hurt efficiency depending on whether the market was already efficient or failing.
    • Measure inequality with the Lorenz curve and Gini coefficient (0 = equality, 1 = inequality).
    ไทย
    • ** externality แบบลบ** ทำให้การผลิตในตลาดมากเกินไป แก้ไขได้โดย ภาษีพิโกเวียน เท่ากับต้นทุนภายนอก ผลบวก会产生 overproduction; แก้ไขได้ bằng subsidy.
    • สินค้าสาธารณะ เป็นสินค้าที่ไม่มีการแข่งขันและไม่กีดกัน การใช้บริการฟรี (free-riding) ทำให้ตลาดจัดหาน้อยเกินไป
    • จัดประเภทสินค้าตามลักษณะการแข่งขันและการกีดกัน: ทรัพยากรร่วม (rival, non-excludable) suffers the tragedy of the commons.
    • นโยบายเดียวกันสามารถช่วยหรือทำลายประสิทธิภาพขึ้นอยู่กับว่าตลาดมีประสิทธิภาพอยู่แล้วหรือไม่หรือล้มเหลว
    • วัดความเหลื่อมล้ำด้วย กราฟลอเรนซ์ และ สัมประสิทธิ์จินี่ (0 = เท่าเทียม, 1 = ไม่เท่าเทียม)
    Vocabulary · ⁨คำศัพท์⁩ Train · ⁨ฝึกฝน⁩
    English ไทย
    tragedy of the commons/ˈtrædʒədi ɒvðə ˈkɒmənz/ โศกนาฏกรรมของสาธารณะ (tragedy of the commons)
    Antitrust laws/ˌæntɪˈtrʌst lɔːz/ กฎหมายต่อต้านการผูกขาด
    per-unit tax/pɜː ˈjuːnɪt tæks/ ภาษีต่อหน่วย
    lump-sum tax/lʌmp sʌm tæks/ ภาษี lump-sum
    lump-sum subsidy/lʌmp sʌm ˈsʌbsɪdi/ เงินอุดหนุน lump-sum
    income distribution/ˈɪŋkʌm ˌdɪstrɪˈbjuːʃn/ การกระจายรายได้

Log in or create account · ⁨เข้าสู่ระบบหรือสร้างบัญชี⁩

IGCSE, A-Level & AP