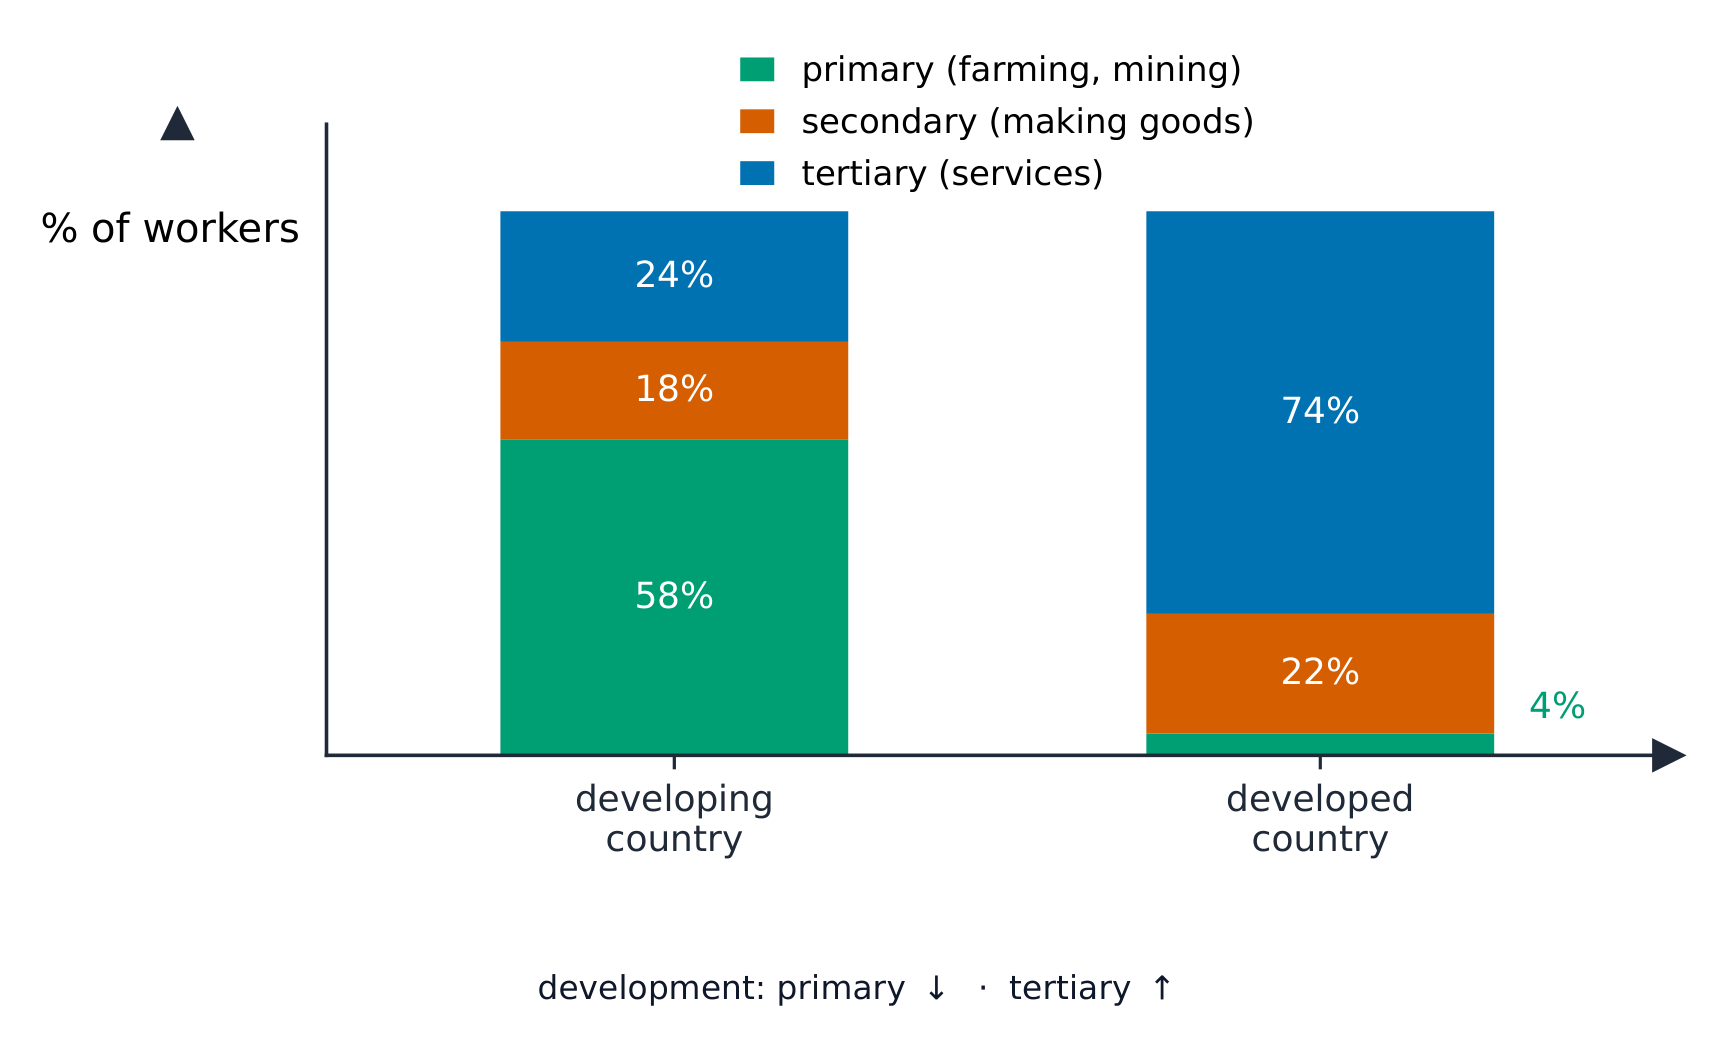
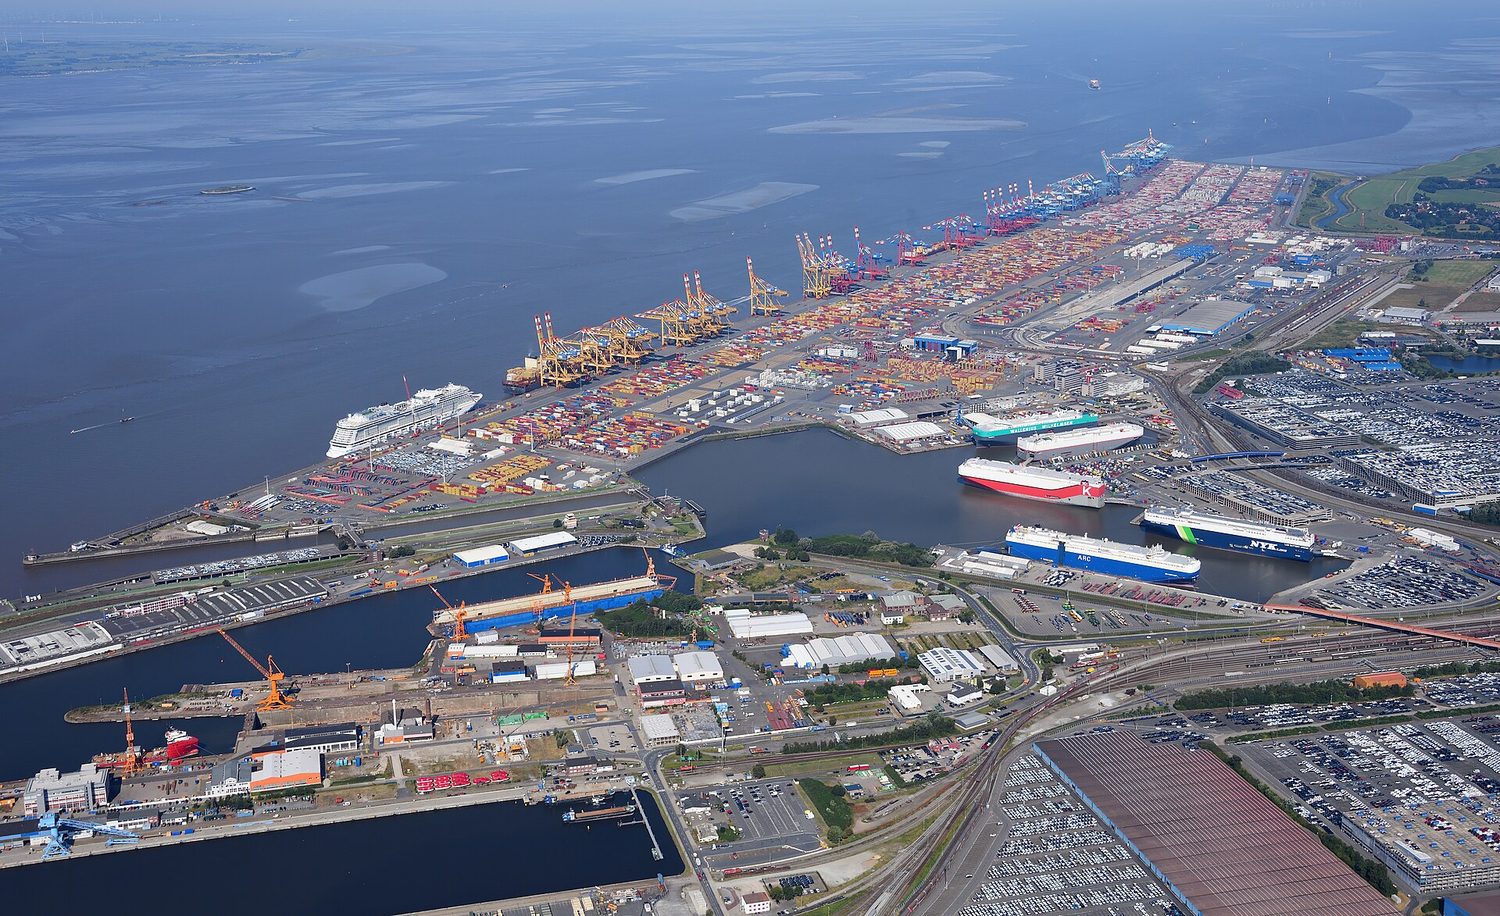
A-Level Economics (9708) splits in two. Microeconomics: scarcity, the price system, elasticity, market failure, government intervention. Macroeconomics: national income, the multiplier, inflation, unemployment, growth, policy and trade. A2 goes deeper into the same ground rather than adding new ground.
The skill being tested is not recall. It is draw the diagram, then evaluate. An answer that describes a policy scores badly. An answer that says what the policy does, draws the diagram, then says when it would not work scores well.
"It depends on" is not hedging here — the conditions are exactly where the evaluation marks live.
The fundamental economic problem · Фундаментальная экономическая проблема
Syllabus · Программа
English
explain the fundamental economic problem of scarcity arising from finite resources and unlimited wants
explain choice and opportunity cost for consumers, producers and governments
distinguish positive and normative statements in the context of choice
Русский
объяснить фундаментальную экономическую проблему дефицита, возникающую из-за конечных ресурсов и неограниченных желаний
объяснить выбор и альтернативные издержки для потребителей, производителей и правительств
различать положительные и нормативные утверждения в контексте выбора
Source: Cambridge International syllabus · Источник: Программа Cambridge International
English
Economics starts with one big idea: scarcity 稀缺性. We never have enough to give everyone everything they want.
resources 资源 are the things we use to make goods and services. They are finite 有限的 — there is only a limited amount, so they are scarce 稀缺.
goods 物品 (things you can touch, like food) and services 服务 (work done for you, like a haircut) are what we make from resources.
human wants 欲望 are unlimited. People always want more.
Because wants are bigger than resources, this is called the economic problem 经济问题. Every society must answer three questions:
What to produce?
How to produce it?
For whom to produce it?
Choice and opportunity cost
Because resources are scarce, you must choose. Every choice means you give up something else.
opportunity cost 机会成本 — the next best alternative 替代选择 you give up when you make a decision.
Opportunity cost is faced by everyone:
consumers 消费者 (people who buy and use goods): buy a phone, and you give up the holiday that money could have paid for.
producers 生产者 and firms 企业 (the businesses that make goods): use a factory to make cars, and you give up the trucks it could have made.
governments 政府: spend tax money on hospitals, and you give up the schools that money could have built.
Русский
Экономика начинается с одной большой идеи: дефицита. У нас никогда не хватает всего, чтобы удовлетворить желания каждого человека полностью.
ресурсы — это то, что мы используем для производства товаров и услуг. Они конечны — существует ограниченный объем, поэтому они дефицитны.
товары (вещи, которые можно потрогать, например еду) и услуги (работа, выполненная для вас, например стрижка) — это то, что мы производим из ресурсов.
человеческие потребности безграничны. Люди всегда хотят большего.
Поскольку потребности превышают ресурсы, это называется экономической проблемой. Каждое общество должно ответить на три вопроса:
Что производить?
Как это производить?
Для кого производить?
Выбор и альтернативные издержки
Поскольку ресурсы дефицитны, вам приходится выбирать. Каждый выбор означает отказ от чего-то другого.
альтернативные издержки — лучшее альтернативное решение, от которого вы отказываетесь при принятии решения.
Альтернативные издержки faced by everyone:
потребители (люди, покупающие и использующие товары): купив телефон, вы отказываетесь от отпуска, на который эти деньги могли бы пойти.
производители и фирмы (бизнес, производящий товары): используя завод для производства автомобилей, вы отказываетесь от грузовиков, которые он мог бы произвести.
правительства: тратя налоговые деньги на больницы, вы отказываетесь от школ, которые эти деньги могли бы построить.
1.2
Thinking like an economist · Мышление экономиста
Syllabus · Программа
English
explain economics as a social science and the use of the ceteris paribus assumption
distinguish positive and normative statements and the role of value judgements
distinguish microeconomics and macroeconomics
Русский
объяснить экономику как общественную науку и использование предположения ceteris paribus
различать позитивные и нормативные утверждения и роль ценностных суждений
различать микроэкономику и макроэкономику
Source: Cambridge International syllabus · Источник: Программа Cambridge International
English
Economics as a social science
Economics is a social science 社会科学. It studies how people behave when they make choices. Like other sciences, it builds models 模型 (simple pictures of the real world) and tests them with data.
The real world is complex, so economists change one thing at a time and keep everything else fixed. This is the idea of ceteris paribus 其他条件不变 — a Latin phrase meaning "all other things stay the same". For example: "if the price of coffee rises, people buy less coffee, ceteris paribus".
Positive and normative statements
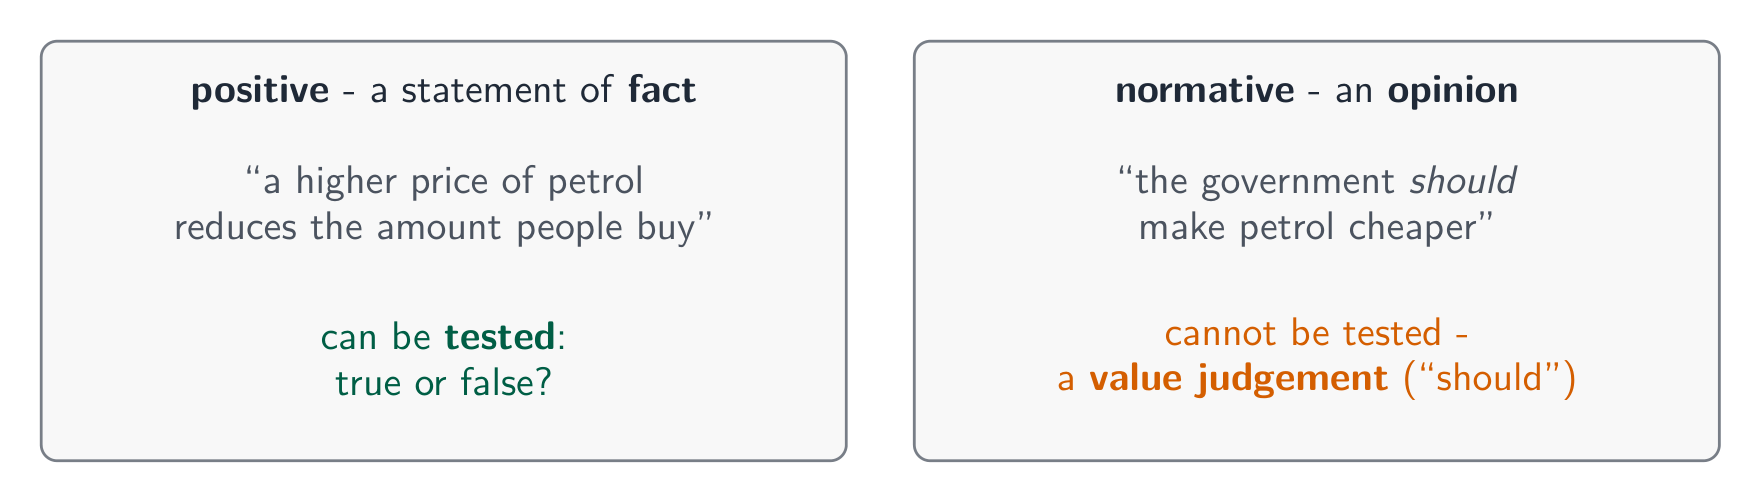
a positive statement 实证表述 is about fact. It can be tested as true or false. Example: "a higher price of petrol reduces the amount people buy."
a normative statement 规范表述 is about opinion. It says what should happen, and it cannot be tested as true or false. Example: "the government should make petrol cheaper."
Normative statements rest on a value judgement 价值判断 — a personal view about what is good or fair. Two people can agree on the facts and still disagree about what should be done.
Microeconomics and macroeconomics
microeconomics 微观经济学 studies single parts of the economy: one market, one firm, one consumer.
macroeconomics 宏观经济学 studies the whole economy together: total output 产出, jobs, and rising prices.
Русский
Экономика как социальная наука
Экономика — это социальная наука. Она изучает поведение людей при принятии решений. Как и другие науки, она строит модели (упрощенные изображения реального мира) и проверяет их с помощью данных.
Реальный мир сложен, поэтому экономисты меняют одну переменную за раз, сохраняя всё остальное неизменным. Это идея ceteris paribus — латинская фраза, означающая «все остальные вещи остаются прежними». Например: «если цена на кофе возрастает, люди покупают меньше кофе, ceteris paribus».
Позитивные и нормативные высказывания
позитивное высказывание касается факта. Его можно проверить на истинность или ложность. Пример: «повышение цен на бензин снижает объем покупок бензина людьми».
нормативное высказывание касается мнения. Оно говорит о том, что должно происходить, и его нельзя проверить на истинность или ложность. Пример: «правительство должно сделать бензин дешевле».
Нормативные высказывания основаны на оценочном суждении — личном мнении о том, что хорошо или справедливо. Два человека могут согласиться с фактами, но по-прежнему не соглашаться с тем, что следует делать.
Позитивное высказывание можно проверить; нормативное высказывание — это оценочное суждение
Микроэкономика и макроэкономика
микроэкономика изучает отдельные части экономики: один рынок, одну фирму, одного потребителя.
макроэкономика изучает экономику в целом: общий объем производства, занятость и рост цен.
Explore · Исследовать
Economic method lab · Лаборатория экономических методов
Classify statements by the role they play in economic reasoning. · Классифицируйте утверждения по их роли в экономическом рассуждении.
define land, labour, capital and enterprise and their rewards (rent, wages, interest, profit)
explain division of labour and specialisation and their advantages and disadvantages
explain the mobility of factors of production
Русский
определить землю, труд, капитал и предпринимательство и их вознаграждения (ренту, зарплату, процент, прибыль)
объяснить разделение труда и специализацию и их преимущества и недостатки
объяснить мобильность факторов производства
Source: Cambridge International syllabus · Источник: Программа Cambridge International
English
The factors of production 生产要素 are the four kinds of resource used to make goods and services. Each one earns a reward 报酬.
Factor
What it is
Its reward
land 土地
natural resources (fields, water, oil, minerals)
rent 地租
labour 劳动
human work, both physical and mental
wages 工资
capital 资本
man-made things used to produce, like machines, tools and factories
interest 利息
enterprise 企业家才能
the skill of bringing the other three together and taking the risk
profit 利润
Land includes some non-renewable resources 不可再生资源 (like oil and coal) that can run out. Enterprise is supplied by the entrepreneur 企业家, the person who has the business idea and risks their own money.
Specialisation and division of labour
specialisation 专业化 is when a worker, firm or country makes only the things it is best at, then trades for the rest.
Inside a workplace, specialisation leads to the division of labour 劳动分工: a big job is split into small tasks, and each worker 工人 does one task again and again.
Advantages
Disadvantages
workers get faster and better at one task
doing one task is boring, so workers may quit
less time wasted moving between jobs
if one worker is absent, the whole line can stop
output per worker rises, so costs fall
workers learn only one narrow skill
Mobility of factors
mobility 流动性 means how easily a factor can move to a new use.
occupational mobility 职业流动性 — how easily a factor moves from one job or use to another. A teacher who retrains as a nurse is occupationally mobile.
geographical mobility 地理流动性 — how easily a factor moves from one place to another. Land cannot move at all, so it has no geographical mobility.
Labour is often not very mobile. Family ties, the cost of housing, and missing skills all make it hard for workers to move.
Русский
Факторы производства — это четыре вида ресурсов, используемых для создания товаров и услуг. Каждый из них приносит доход.
Четыре фактора производства и вознаграждение, которое получает каждый
человеческий труд, как физический, так и умственный
зарплата
капитал
созданные человеком предметы, используемые в производстве, такие как машины, инструменты и заводы
процент
предпринимательство
умение объединить три остальных фактора и принять на себя риск
прибыль
Земля включает некоторые невозобновляемые ресурсы (такие как нефть и уголь), которые могут иссякнуть. Предпринимательство обеспечивается предпринимателем — человеком, у которого есть идея бизнеса и который рискует собственными деньгами.
Открытая медная шахта: земля включает природные ресурсы (минералы, нефть, воду), которые извлекают предприятия.
Специализация и разделение труда
Специализация — это когда работник, фирма или страна производят только то, что умеют делать лучше всего, а остальное обменивают.
На рабочем месте специализация приводит к разделению труда: большая работа разбивается на мелкие задачи, и каждый работник многократно выполняет одну задачу.
Преимущества
Недостатки
работники становятся быстрее и качественнее в выполнении одной задачи
выполнение одной задачи скучно, поэтому работники могут уволиться
меньше времени тратится на перемещение между задачами
если один работник отсутствует, вся линия может остановиться
объем продукции на работника растет, поэтому затраты снижаются
работники осваивают лишь одну узкую специальность
Конвейер по сборке автомобилей: капитал (машины и роботы) плюс разделение труда, где каждый работник повторяет одну задачу.
Подвижность факторов
Подвижность означает, насколько легко фактор может перейти к новому использованию.
профессиональная подвижность — насколько легко фактор переходит от одной работы или использования к другому. Учитель, прошедший переобучение и ставший медсестрой, обладает профессиональной подвижностью.
географическая подвижность — насколько легко фактор перемещается из одного места в другое. Земля не может двигаться вовсе, поэтому она не обладает географической подвижностью.
Труд часто бывает малоподвижным. Семейные узы, стоимость жилья и отсутствие необходимых навыков затрудняют переезд работников.
Explore · Исследовать
Factors of production lab · Лабораторная работа по факторам производства
Sort real resources by the factor of production they represent. · Распределите реальные ресурсы по фактору производства, который они представляют.
explain how resources are allocated in market, planned and mixed economic systems
explain the role of the price mechanism (signalling, incentive, rationing) in allocating resources
evaluate the advantages and disadvantages of each system
Русский
объяснить, как распределяются ресурсы в рыночных, плановых и смешанных экономических системах
объяснить роль ценового механизма (сигнальная функция, стимулирующая функция, функция распределения) в распределении ресурсов
оценить преимущества и недостатки каждой системы
Source: Cambridge International syllabus · Источник: Программа Cambridge International
English
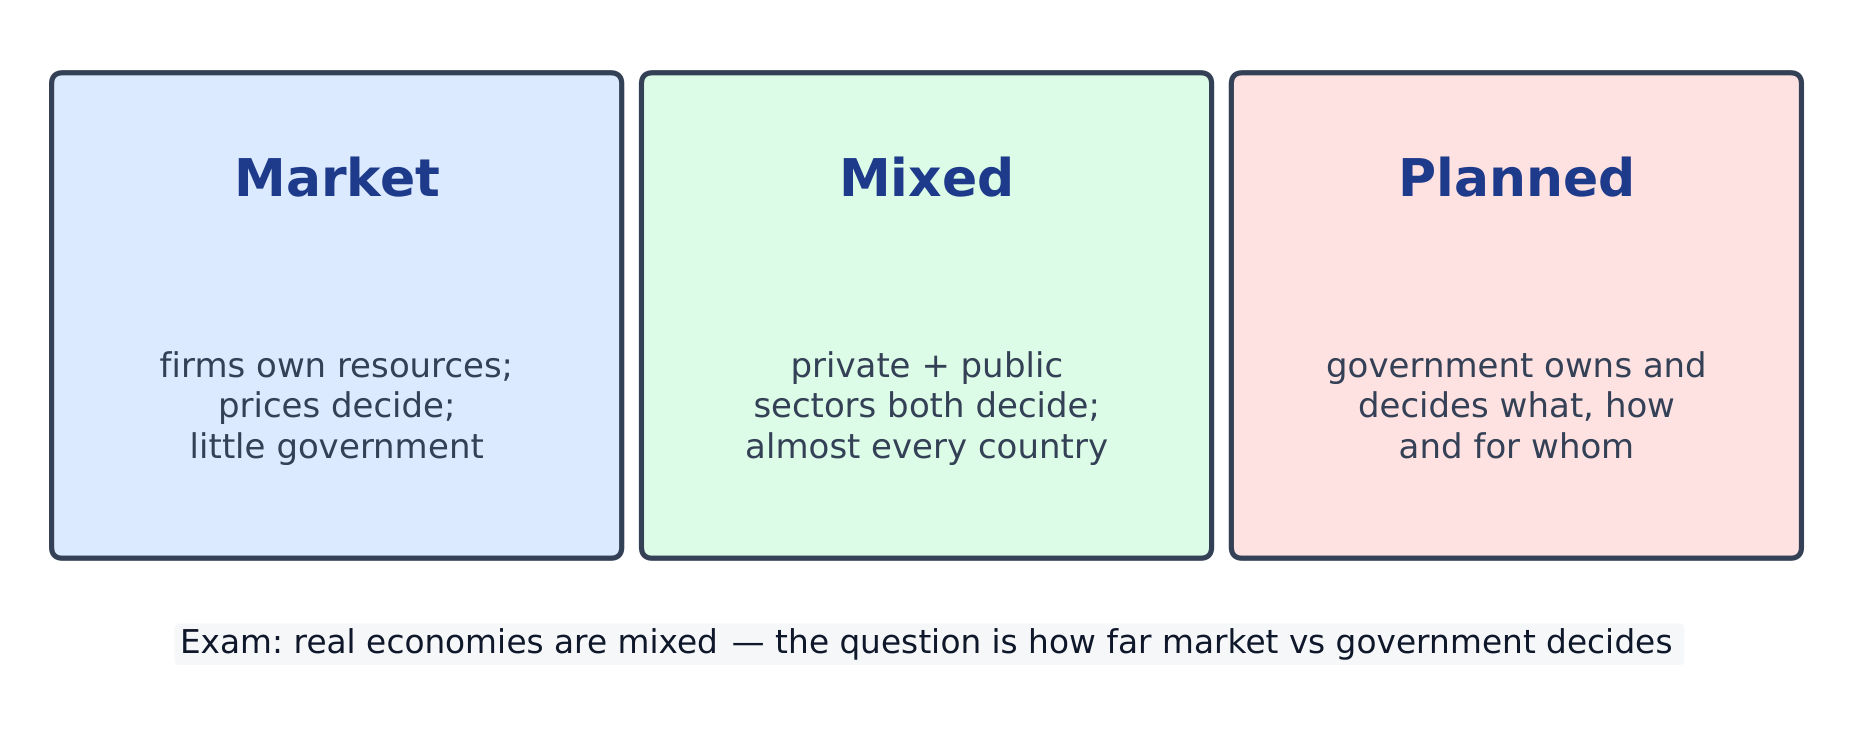
An economic system is the way a country decides how to allocate 配置 (share out) its scarce resources. There are three types.
a market economy 市场经济 — firms and people own resources, and prices decide what is made. The government does little.
a planned economy 计划经济 (also called a command economy 指令经济) — the government owns resources and decides what is made, how, and for whom.
a mixed economy 混合经济 — a blend of the two. The private sector 私营部门 (firms and households) and the public sector 公共部门 (the government) both make decisions. Almost every real country is mixed.
The price mechanism
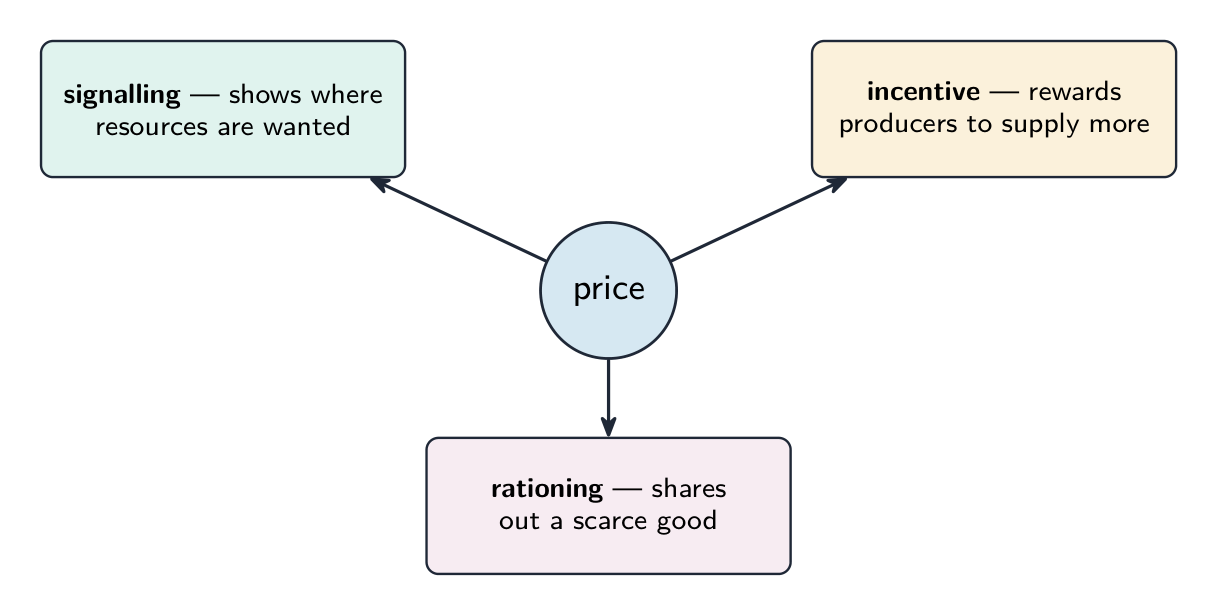
In a market economy, resources are guided by the price mechanism 价格机制. Prices do three jobs:
signalling 信号传递 — a price tells buyers and sellers where resources are wanted. A rising price says "this is wanted — make more".
incentive 激励 — a higher price rewards producers, so they want to supply more of that good.
rationing 配给 — when a good is scarce, a higher price shares it out to those who are willing and able to pay.
Comparing the systems
System
Strengths
Weaknesses
market
choice, low prices, strong incentive to work and invent
large gap between rich and poor; some goods not supplied
planned
smaller gap between rich and poor; key goods provided for all
weak incentive; shortages and surpluses; slow to change
mixed
tries to keep the good points of both
the right balance is hard to find
In practice no country sits at a pure extreme. China's economy, for instance, is officially a socialist market economy, where markets set most prices while the government guides key sectors and owns major enterprises. Every real system mixes the two and sits somewhere on the spectrum below.
Русский
Экономическая система — это способ, которым страна решает распределять (распределять по назначению) свои ограниченные ресурсы. Существует три типа.
рыночная экономика — ресурсы принадлежат фирмам и людям, а цены определяют, что производить. Роль правительства минимальна.
плановая экономика (также называемая командной экономикой) — ресурсы принадлежат правительству, которое определяет, что производить, как и для кого.
смешанная экономика — сочетание двух предыдущих. Частный сектор (фирмы и домохозяйства) и государственный сектор (правительство) принимают решения вместе. Почти каждая реальная страна является смешанной.
Ценовой механизм
В рыночной экономике ресурсами управляет ценовой механизм. Цены выполняют три функции:
сигнализация — цена указывает покупателям и продавцам, где нужны ресурсы. Рост цен говорит: «это востребовано — производите больше».
стимул — более высокая цена вознаграждает производителей, побуждая их предлагать больше данного товара.
нормирование — когда товар дефицитен, более высокая цена распределяет его среди тех, кто готов и способен заплатить.
На рынке цена одновременно выполняет три функции — сигнализирует, создает стимул и нормирует дефицитный товар
Сравнение систем
Система
Сильные стороны
Слабые стороны
рыночная
выбор, низкие цены, сильный стимул к труду и изобретениям
большой разрыв между богатыми и бедными; некоторые товары не производятся
плановая
меньший разрыв между богатыми и бедными; ключевые товары доступны всем
слабый стимул; дефицит и профицит; медленная адаптация к изменениям
смешанная
пытается сохранить лучшие черты обеих систем
трудно найти правильный баланс
На практике ни одна страна не находится на чистом экстремуме. Например, экономика Китая официально является социалистической рыночной экономикой, где рынки устанавливают большинство цен, а государство направляет ключевые сектора и владеет крупными предприятиями. Любая реальная система сочетает оба подхода и занимает какое-то место на приведенном ниже спектре.
Экономические системы образуют спектр: чистый рынок на одном конце, полное государственное планирование на другом, смешанные экономики посередине.
Production possibility curves · Кривая производственных возможностей
Syllabus · Программа
English
draw and interpret PPCs to show opportunity cost, scarcity, choice and efficiency
explain movements along and shifts of the PPC and constant versus increasing opportunity cost
relate the PPC to economic growth and the allocation between capital and consumer goods
Русский
построить и интерпретировать КПВ для иллюстрации альтернативных издержек, ограниченности ресурсов, выбора и эффективности
объяснить движения вдоль КПВ и сдвиги КПВ, а также постоянные и возрастающие альтернативные издержки
связать КПВ с экономическим ростом и распределением между капитальными и потребительскими товарами
Source: Cambridge International syllabus · Источник: Программа Cambridge International
English
The PPF and opportunity cost
A production possibility curve 生产可能性曲线 (PPC) is a line showing the largest combinations of two goods an economy can make when all its resources are fully and well used.
Imagine an economy that makes only food and machines. The PPC is drawn with food on one axis and machines on the other.
a point on the curve: all resources are used with full efficiency 效率.
a point inside the curve: resources are wasted (for example, unemployment 失业 of workers). The economy could do better.
a point outside the curve: impossible today, because there are not enough resources. This shows scarcity.
Moving along the curve shows opportunity cost: to make more food, you must move resources away from machines, so you make fewer machines. This is the trade-off 取舍 between the two goods.
The shape of the curve shows how opportunity cost behaves:
a straight-line PPC means constant opportunity cost — each extra unit of food costs the same number of machines.
a curve that bows outwards means increasing opportunity cost — each extra unit of food costs more and more machines, because resources are not equally good at making both goods.
Shifts and growth
When the PPC moves outward (to the right), the economy can make more of both goods. This is economic growth 经济增长. It happens when there are more resources, or better ones (new technology 技术, a bigger or more skilled workforce). War or disaster can move the PPC inward — this is economic decline 经济衰退.
A country must also choose between two kinds of good now:
capital goods 资本品 — goods used to make other goods (machines, factories).
consumer goods 消费品 — goods people use directly (food, clothes).
Making more capital goods today means fewer consumer goods today. But more capital goods help the economy grow faster, so the PPC shifts out by more in the future.
Worked example. Why is a production possibility curve usually drawn concave (bowed outwards) rather than as a straight line? A straight line would mean the opportunity cost of each extra unit stays constant. The curve bows out because factors of production are not perfectly substitutable - they are specialised. Starting from all-food production, the first factors moved into making cars are the ones least suited to farming, so very little food is given up for a lot of cars. Keep going and you must move factors that are increasingly good at farming and increasingly bad at making cars, so each extra car costs more and more food. That rising cost is increasing opportunity cost, and the bowed shape is simply its picture. A straight-line PPC is not wrong - it just assumes factors are perfectly substitutable, and naming that assumption is what earns the mark.
Русский
KPV и альтернативные издержки
Кривая производственных возможностей (КПВ) — это линия, показывающая максимально возможные комбинации двух благ, которые экономика может произвести при полном и эффективном использовании всех ресурсов.
Представьте экономику, которая производит только продукты питания и станки. КПВ строится, где продукты питания находятся на одной оси, а станки — на другой.
точка на кривой: все ресурсы используются с полной эффективностью.
точка внутри кривой: ресурсы используются неэффективно (например, безработица рабочих). Экономика могла бы сделать больше.
точка за пределами кривой: сегодня это невозможно, потому что не хватает ресурсов. Это демонстрирует дефицит (ограниченность).
Точка на кривой означает использование всех ресурсов (эффективность); положение внутри кривой свидетельствует о бездействии или потерях, например безработице; положение за пределами кривой пока недостижимо.
Движение вдоль кривой показывает альтернативные издержки: чтобы произвести больше продовольствия, нужно переместить ресурсы из производства машин, поэтому машин станет меньше. Это компромисс между двумя благами.
Форма кривой отражает характер изменения альтернативных издержек:
прямая линия КПВ означает постоянные альтернативные издержки — каждая дополнительная единица продовольствия обходится одинаковым количеством машин.
выпуклая кривая означает возрастающие альтернативные издержки — каждая дополнительная единица продовольствия требует всё большего количества машин, поскольку ресурсы не одинаково эффективны в производстве обоих благ.
Прямая КПВ означает, что каждая дополнительная единица продовольствия стоит одинаково; выпуклая КПВ означает, что каждая дополнительная единица обходится всё дороже в пересчёте на машины.
Сдвиги и рост
Когда КПВ смещается наружу (вправо), экономика может производить больше обоих благ. Это экономический рост. Он происходит при наличии больше ресурсов или более качественных (новые технологии, увеличенная или более квалифицированная рабочая сила). Война или катастрофа могут сдвинуть КПВ внутрь — это экономический спад.
Большее количество или лучшее качество ресурсов сдвигает всю КПВ наружу (рост); война или катастрофа сдвигают её внутрь (спад).
Страна должна также выбирать между двумя видами благ прямо сейчас:
капитальные блага — товары, используемые для производства других товаров (машины, заводы).
потребительские блага — товары, которые люди потребляют непосредственно (продовольствие, одежда).
Производство большего количества капитальных благ сегодня означает меньшее количество потребительских благ сегодня. Однако наличие большего числа капитальных благ способствует более быстрому росту экономики, поэтому КПВ в будущем сдвинется дальше наружу.
Выбор в пользу большего количества капитальных благ сегодня означает меньше потребительских благ сейчас, но будущая КПВ сдвинется дальше наружу.
Разобранный пример. Почему кривая производственных возможностей обычно рисуется выпуклой (выгнутой наружу), а не прямой? Прямая линия означала бы, что альтернативные издержки каждой дополнительной единицы остаются постоянными. Кривая выгибается наружу, потому что факторы производства не являются идеальными взаимозаменяемыми — они специализированы. Начиная с полного производства продовольствия, первыми факторами, переводимыми на производство автомобилей, являются те, которые менее всего пригодны для земледелия, поэтому ради большого количества машин приходится жертвовать лишь малым количеством продовольствия. Продолжая, вам придётся перемещать факторы, которые становятся всё лучше в сельском хозяйстве и всё хуже в производстве автомобилей, так что каждый дополнительный автомобиль обходится всё большим количеством продовольствия. Этот растущий расход представляет собой возрастающие альтернативные издержки, а выпуклая форма — просто графическое отображение этого явления. Прямая КПВ не является ошибочной — она лишь предполагает идеальную взаимозаменяемость факторов, и указание на это предположение earns the mark (дает балл).
Explore · Исследовать
The production possibility frontier · Кривая производственных возможностей
Producing more of one good means giving up some of the other — that trade-off is the opportunity cost, shown by the slope of the frontier. · Производство большего количества одного блага означает отказ от части другого — этот компромисс является альтернативными издержками, отраженными наклоном кривой.
An economy can't have more of everything: making more of one good means giving up some of another — the frontier's slope is that opportunity cost. · Экономика не может иметь больше всего: производство большего количества одного блага требует отказа от части другого — наклон кривой отражает эту альтернативную стоимость.
Explore · Исследовать
The production possibility curve · Кривая производственных возможностей
Move along the curve. Producing more of one good means producing less of the other — the curve shows opportunity cost and scarcity. · Двигайтесь вдоль кривой. Увеличение производства одного блага означает производство меньшего количества другого — кривая иллюстрирует альтернативные издержки и дефицит.
distinguish free goods and economic (private) goods
explain the characteristics of public goods (non-rivalry, non-excludability) and the free-rider problem
explain merit and demerit goods and the role of information and value judgements
Русский
различать бесплатные блага и экономические (частные) блага
объяснить характеристики общественных благ (неконкурентность, неисключаемость) и проблему безбилетников
объяснить блага морального значения и блага низкого качества и роль информации и ценностных суждений
Source: Cambridge International syllabus · Источник: Программа Cambridge International
English
Free goods and economic goods
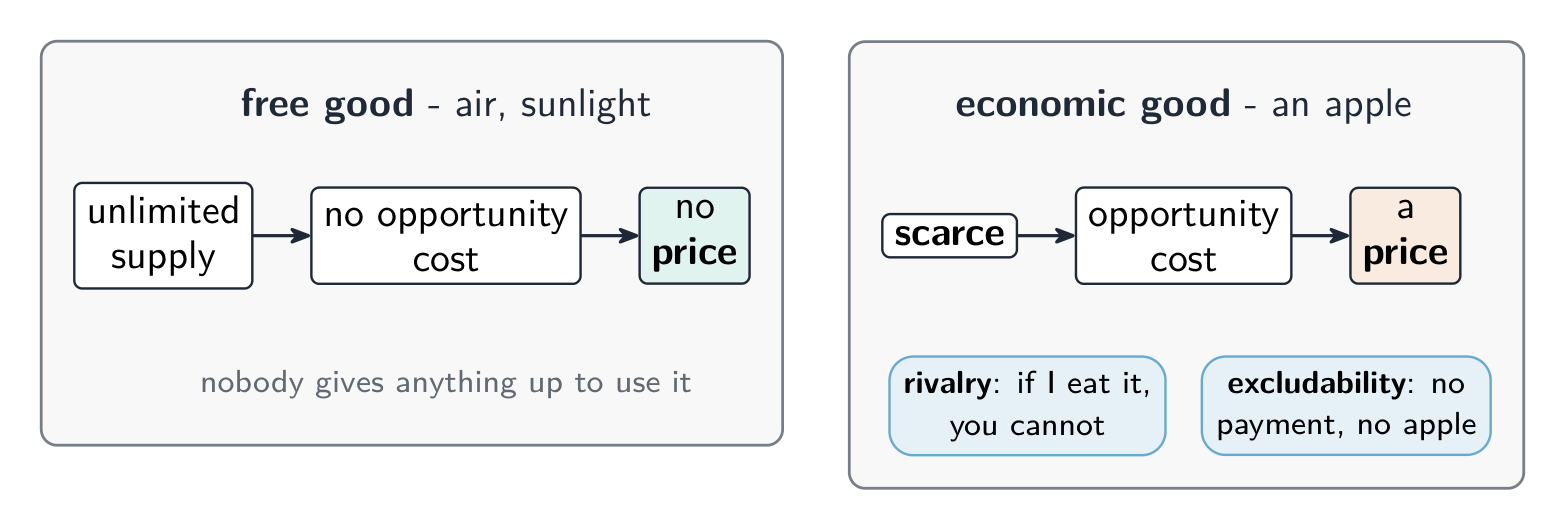
a free good 免费物品 has no opportunity cost. Its supply is unlimited, so it has no price (for example, air or sunlight).
an economic good 经济物品 (also called a private good 私人物品) is scarce. Making it has an opportunity cost, so it has a price.
A private good has two features. It has rivalry 竞争性 (if I eat the apple, you cannot) and excludability 排他性 (the seller can stop you using it unless you pay).
Public goods
A public good 公共物品 is the opposite of a private good. It has two features:
non-rivalry 非竞争性 — one person using it does not reduce the amount left for others.
non-excludability 非排他性 — you cannot stop people who do not pay from using it.
Because of non-excludability, public goods suffer from the free-rider problem 搭便车问题: people enjoy the good without paying for it. So private firms cannot make a profit and will not supply it. The government must provide public goods instead — for example, street lighting and national defence 国防.
Merit and demerit goods
a merit good 优值品 is better for you (and for society) than you realise, so people buy too little of it. Examples: education and health care.
a demerit good 劣值品 is worse for you than you realise, so people buy too much of it. Examples: cigarettes and alcohol.
People misjudge these goods because of information failure 信息失灵 — they do not have, or do not use, the full facts about the benefit or harm.
Deciding what counts as a merit or demerit good is partly a value judgement, so people may disagree about which goods belong on each list.
Русский
Бесплатные и экономические блага
бесплатное благо не имеет альтернативных издержек. Его предложение бесконечно, поэтому оно не имеет цены (например, воздух или солнечный свет).
экономическое благо (также называемое частным благом) является ограниченным. Его производство имеет альтернативные издержки, поэтому у него есть цена.
Частное благо обладает двумя свойствами. Оно имеет конкурентность (если я съем яблоко, ты не сможешь) и исключаемость (продавец может запретить тебе пользоваться им, если ты не заплатишь).
Бесплатное благо не имеет альтернативных издержек и цены; экономическое благо ограничено, конкурентно и исключительно.
Общественные блага
Общественное благо является противоположностью частного. Оно обладает двумя свойствами:
неконкурентность — использование одним человеком не уменьшает объема, доступного для других.
неисключаемость — невозможно запретить тем, кто не платит, пользоваться этим благом.
Из-за неисключаемости общественные блага страдают от проблемы «бесплатного пассажира»: люди пользуются благом, не оплачивая его. Поэтому частные фирмы не могут получить прибыль и не будут его поставлять. Правительство должно предоставлять общественные блага вместо них — например, уличное освещение и национальную оборону.
Конкурентность и исключаемость определяют четыре вида благ: частные, клубные, общие ресурсы и общественные.
Мерит- и демарит-блага
мерит-благо полезнее для вас (и для общества), чем вы осознаете, поэтому люди покупают слишком мало таких благ. Примеры: образование и здравоохранение.
демарит-благо вреднее для вас, чем вы осознаете, поэтому люди покупают слишком много таких благ. Примеры: сигареты и алкоголь.
Образование — классическое мерит-благо. Его полная ценность — лучшие рабочие места и более квалифицированное общество — легко недооценивается, поэтому, предоставленные сами себе, люди покупают его меньше, чем следовало бы для себя или страны. Именно поэтому правительства предоставляют его и субсидируют.
Люди ошибочно оценивают эти блага из-за информационного провала — у них нет полной информации о пользе или вреде, либо они не используют имеющуюся информацию.
Решение о том, что считать мерит- или демарит-благам, частично основано на ценностных суждениях, поэтому люди могут не согласоваться относительно того, какие блага относятся к каждому списку.
Explore · Исследовать
Goods and services lab · Лабораторная работа по классификации благ и услуг
Classify examples by rivalry, excludability or whether they are services. · Классифицируйте примеры по признакам конкурентности, исключительности или тому, являются ли они услугами.
Frame answers around scarcity and choice: every choice has an opportunity cost — the next best alternative given up.
Read a PPC: a point inside means unused resources, on the curve is efficient, outside is unattainable; the slope shows opportunity cost.
Distinguish positive (a testable fact) from normative ("should", a value judgement) statements.
Classify goods: free versus economic, and public / merit / demerit goods (non-excludable, non-rival, and so on).
Русский
Формулируйте ответы вокруг ограниченности и выбора: каждый выбор имеет альтернативные издержки — лучшую упущенную альтернативу.
Читайте КПВ: точка внутри означает неиспользуемые ресурсы, на кривой — эффективность, вне кривой — недостижимо; наклон показывает альтернативные издержки.
Различайте позитивные (проверяемый факт) и нормативные («следует», ценностное суждение) утверждения.
Классифицируйте блага: бесплатные против экономических, а также общественные / меритные / демаритные блага (неисключаемые, нериваловые и т.д.).
explain the determinants of demand and supply and distinguish movements along from shifts of the curves
derive individual and market demand and supply
explain the relationship between marginal utility and the demand curve
Русский
объяснить детерминанты спроса и предложения и различать движения вдоль кривых и их сдвиги
вывести индивидуальный и рыночный спрос и предложение
объяснить связь между предельной полезностью и кривой спроса
Source: Cambridge International syllabus · Источник: Программа Cambridge International
English
Demand shifts right: P and Q rise
demand 需求 is the quantity of a good that buyers are willing and able to buy at each price 价格 in a period of time. It is not just a wish — buyers must also be able to pay.
The law of demand says: when the price rises, the quantity demanded 需求量 falls; when the price falls, the quantity demanded rises. Price and quantity move in opposite directions.
So the demand curve 需求曲线 slopes downward, from top-left to bottom-right.
What shifts the demand curve
A change in the good's own price is shown as a movement along the demand curve. A change in any other cause shifts the whole curve to a new position — this is a shift 移动 of demand. The main causes (the determinants 决定因素) are:
income 收入 — for most goods, higher income raises demand.
the price of a substitute 替代品 — a good you can use instead (tea for coffee). If the substitute's price rises, demand for this good rises.
the price of a complement 互补品 — a good used together with this one (cars and petrol). If the complement's price rises, demand for this good falls.
tastes and fashion, the size of the population, and advertising.
Individual and market demand
One consumer 消费者 has an individual demand. The market demand 市场需求 is found by adding up the quantity that all consumers want at each price (adding the curves sideways).
Marginal utility and demand
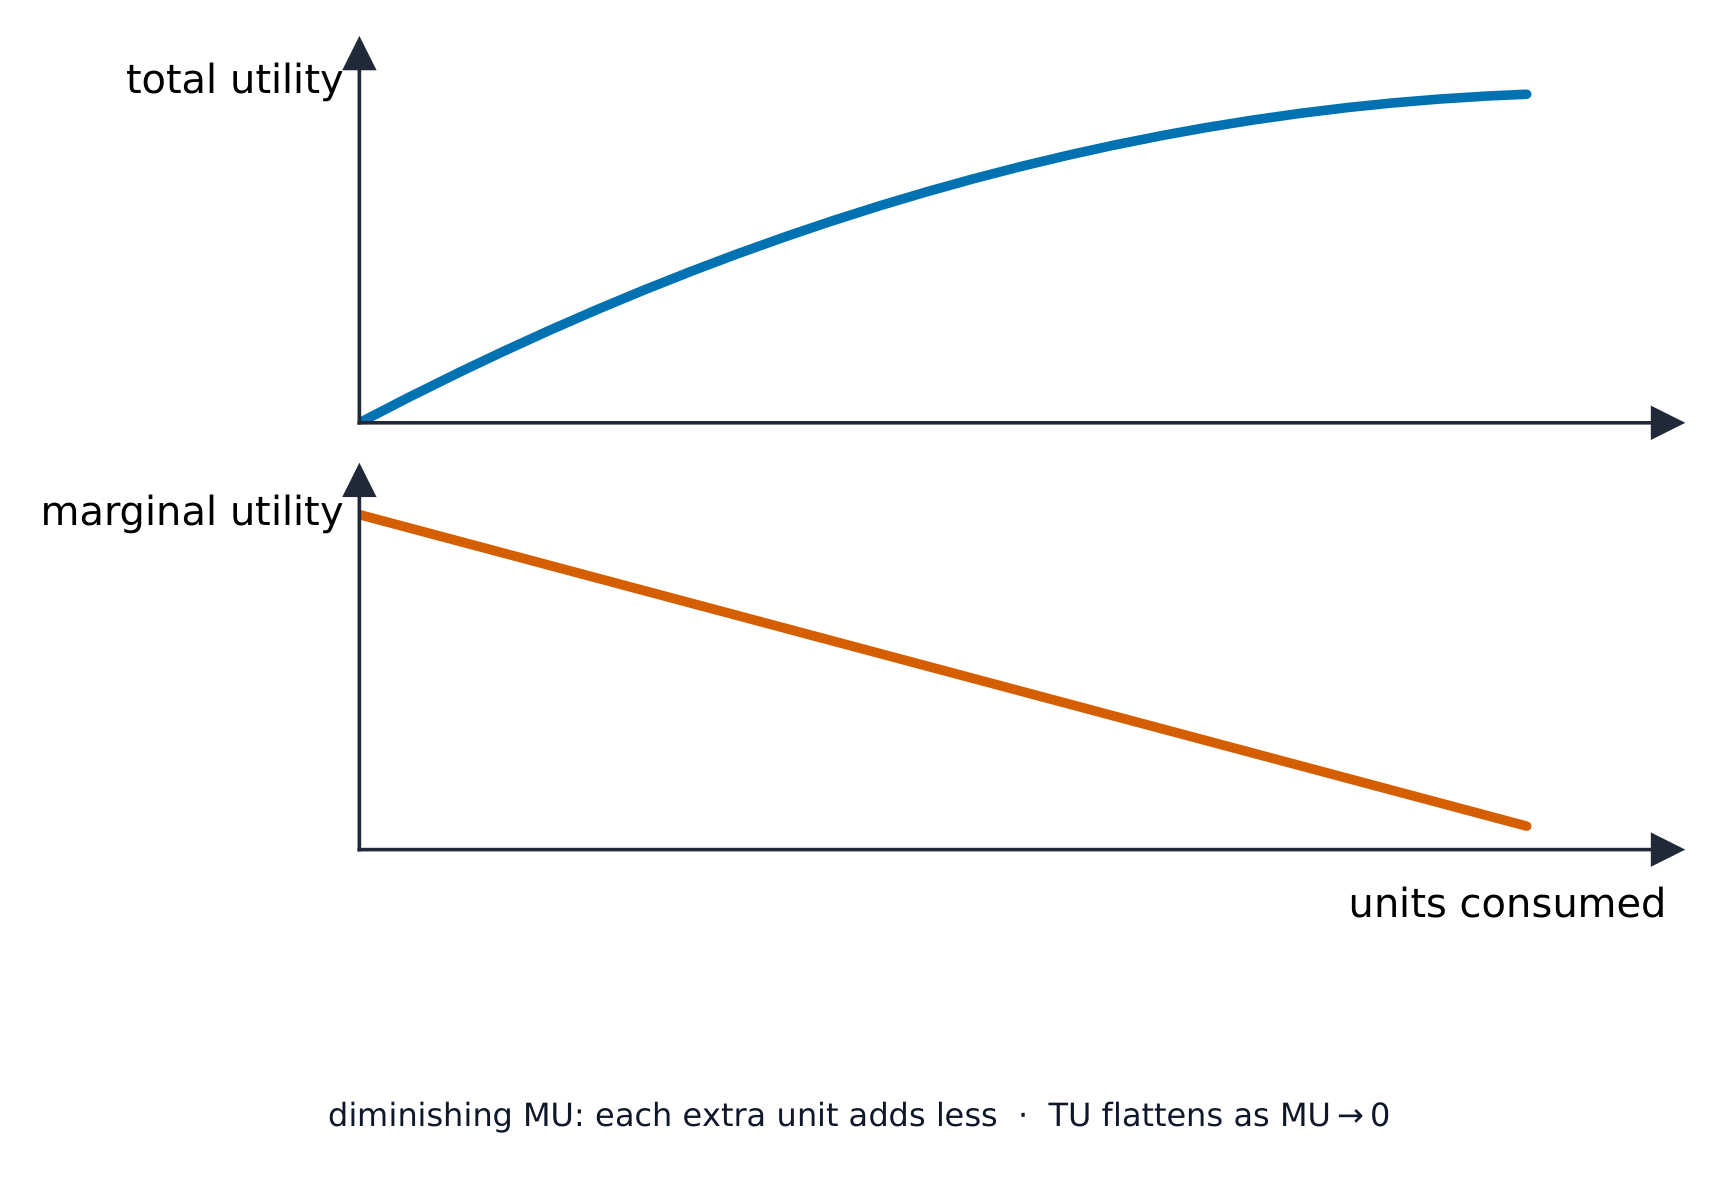
utility 效用 is the satisfaction you get from consuming a good. marginal utility 边际效用 is the extra utility from one more unit.
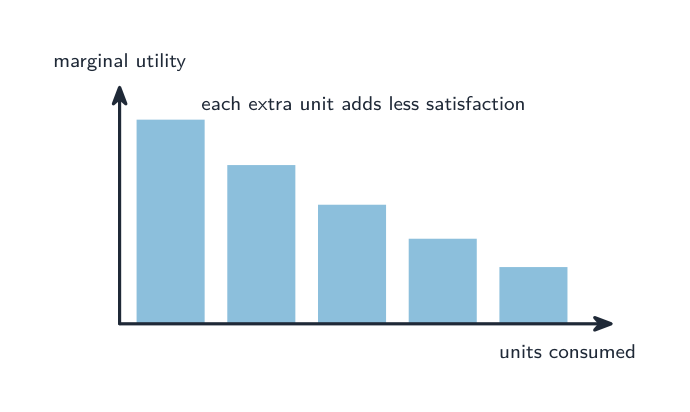
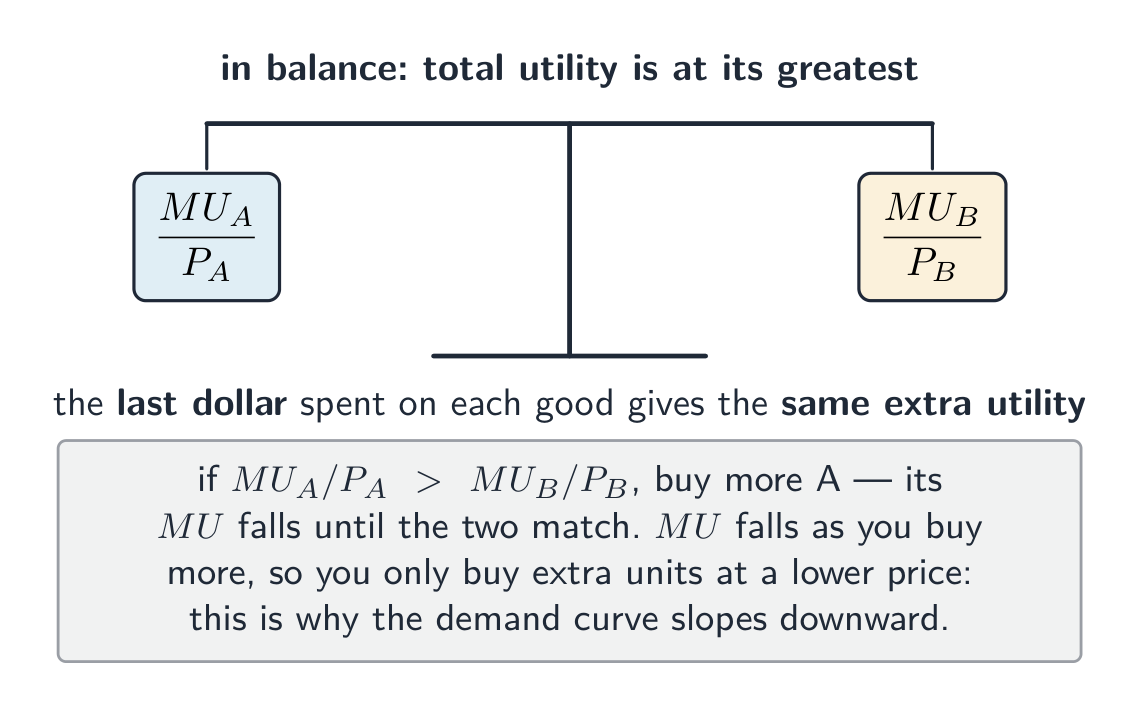
The law of diminishing marginal utility 边际效用递减 says each extra unit gives less extra satisfaction than the one before. Because later units are worth less to you, you will only buy them at a lower price. This is why the demand curve slopes downward.
Русский
Спрос смещается вправо: цена (P) и объем (Q) растут
спрос — это количество блага, которое покупатели готовы и в состоянии купить при каждой цене за определенный период времени. Это не просто желание — покупатели также должны иметь возможность заплатить.
закон спроса гласит: когда цена растет, объем спроса падает; когда цена снижается, объем спроса растет. Цена и объем движутся в противоположных направлениях.
Поэтому кривая спроса идет вниз, от верхнего левого угла к нижнему правому.
Что сдвигает кривую спроса
Изменение собственной цены блага отображается как движение вдоль кривой спроса. Изменение любого другого фактора сдвигает всю кривую в новое положение — это сдвиг спроса. Основные факторы (детерминанты) таковы:
доход — для большинства благ более высокий доход повышает спрос.
цена товара-заменителя — товара, который можно использовать вместо него (чай вместо кофе). Если цена заменителя растет, спрос на данное благо возрастает.
цена товара-комплемента — товара, используемого вместе с данным (автомобили и бензин). Если цена комплемента растет, спрос на данное благо падает.
вкусы и мода, численность населения и реклама.
Изменение дохода, вкусов или смежных цен сдвигает всю кривую ($D_1$ вправо, $D_2$ влево); изменение собственной цены блага — это движение вдоль нее.
Индивидуальный и рыночный спрос
Один потребитель имеет индивидуальный спрос. Рыночный спрос получается путем суммирования количества, которое хотят все потребители при каждой цене (сложения кривых по горизонтали).
Предельная полезность и спрос
полезность — это удовлетворение, которое вы получаете от потребления блага. Предельная полезность — это дополнительная полезность от еще одной единицы.
Закон убывающей предельной полезности гласит, что каждая последующая единица дает меньше дополнительной удовлетворения, чем предыдущая. Поскольку последующие единицы менее ценны для вас, вы купите их только по более низкой цене. Вот почему кривая спроса идет вниз.
Каждая следующая единица добавляет меньше удовлетворения, чем предыдущая — поэтому покупатели готовы платить меньше за последующие единицы, что и объясняет нисходящий спрос
Explore · Исследовать
Demand & supply · Спрос и предложение
Demand slopes down — a lower price, more is wanted. · Спрос имеет нисходящий наклон — при более низкой цене требуется большее количество.
supply 供给 is the quantity of a good that producers 生产者 are willing and able to sell at each price in a period of time.
The law of supply says: when the price rises, the quantity supplied 供给量 rises. Higher prices mean more profit 利润, so firms make more. So the supply curve 供给曲线 slopes upward.
What shifts the supply curve
A change in the good's own price is a movement along the supply curve. Other causes shift the whole curve:
costs of production 生产成本 — if wages, raw materials or rent get dearer, supply falls.
technology — better machines raise supply.
a subsidy 补贴 (government payment to producers) raises supply; an indirect tax lowers it.
the number of firms 企业 in the market, and weather (for farm goods).
Individual and market supply
The market supply 市场供给 is found by adding up the quantity all firms will sell at each price.
Русский
предложение — это количество блага, которое производители готовы и в состоянии продать при каждой цене за определенный период времени.
закон предложения гласит: когда цена растет, объем предложения растет. Более высокие цены означают больше прибыли, поэтому компании производят больше. Поэтому кривая предложения идет вверх.
Что сдвигает кривую предложения
Изменение собственной цены блага — это движение вдоль кривой предложения. Другие факторы сдвигают всю кривую:
затраты на производство — если зарплаты, сырье или аренда дорожают, предложение сокращается.
технологии — улучшение оборудования увеличивает предложение.
субсидия (государственная выплата производителям) увеличивает предложение; косвенный налог снижает его.
количество фирм на рынке и погода (для сельскохозяйственной продукции).
Снижение затрат, улучшение технологий или субсидия сдвигают предложение вправо ($S_1$); рост затрат или налоги сдвигают его влево ($S_2$).
Индивидуальное и рыночное предложение
Рыночное предложение получается путем суммирования количества, которое продадут все фирмы при каждой цене.
Explore · Исследовать
Demand & supply · Спрос и предложение
Supply slopes up — a higher price, more is produced. · Предложение имеет восходящий наклон — при более высокой цене производится большее количество.
2.2
Price elasticity of demand · Ценовая эластичность спроса
Syllabus · Программа
English
define, calculate and interpret price elasticity of demand (PED), income elasticity (YED) and cross elasticity (XED)
explain the determinants of each and the relationship between PED and total revenue/expenditure
explain the usefulness of elasticities to firms and government
Русский
определить, рассчитать и интерпретировать ценовую эластичность спроса (PED), эластичность по доходу (YED) и перекрестную эластичность (XED)
объяснить детерминанты каждого показателя и связь между PED и общей выручкой/расходами
объяснить полезность эластичностей для фирм и правительства
Source: Cambridge International syllabus · Источник: Программа Cambridge International
English
Supply shifts right: P falls, Q rises
price elasticity of demand 需求价格弹性 (PED) measures how much the quantity demanded responds when the price changes.
$$\text{PED} = \frac{\%\ \text{change in quantity demanded}}{\%\ \text{change in price}}$$
PED is normally negative (because of the law of demand), but we usually look at the size and drop the minus sign.
Worked example. The price of a good rises by 10% and the quantity demanded falls by 25%. Find the PED and classify the demand.
$$\text{PED} = \frac{-25}{10} = -2.5$$
Ignoring the minus sign, $2.5 > 1$, so demand is elastic — quantity responded much more than the price did.
Value
Name
Meaning
more than 1
elastic 富有弹性
quantity responds a lot
less than 1
inelastic 缺乏弹性
quantity responds a little
equal to 1
unit elastic 单位弹性
quantity changes by the same % as price
0
perfectly inelastic 完全无弹性
quantity does not change at all
infinity
perfectly elastic 完全有弹性
any price rise sends demand to zero
What makes demand elastic or inelastic
the number and closeness of substitutes (more substitutes → more elastic).
whether the good is a necessity 必需品 (inelastic) or a luxury 奢侈品 (elastic).
the share of income spent on the good (a large share → more elastic).
time — demand is more elastic in the long run, when buyers can find other options.
habit or addiction makes demand inelastic.
PED and total revenue
total revenue 总收益 is the money a firm earns: $\text{TR} = \text{price} \times \text{quantity}$. PED tells a firm what happens to revenue when it changes the price:
If demand is…
price rises
price falls
inelastic
total revenue rises
total revenue falls
elastic
total revenue falls
total revenue rises
unit elastic
total revenue stays the same
total revenue stays the same
This is useful to firms (how to price for more revenue) and to governments 政府 (a tax on an inelastic good, like petrol, raises a lot of revenue without cutting sales much).
Русский
Предложение сдвигается вправо: P падает, Q растет
ценовая эластичность спроса (PED) измеряет, насколько сильно объем спроса реагирует на изменение цены.
$$\text{PED} = \frac{\%\ \text{change in quantity demanded}}{\%\ \text{change in price}}$$
PED обычно отрицательна (из-за закона спроса), но мы обычно смотрим на величину и опускаем знак минус.
Разобранный пример. Цена блага выросла на 10%, а объем спроса снизился на 25%. Найдите PED и классифицируйте спрос.
$$\text{PED} = \frac{-25}{10} = -2.5$$
Не учитывая знак минус, $2.5 > 1$, значит спрос эластичен — изменение количества значительно превысило изменение цены.
Спрос на бензин неэластичен по цене: водители обязаны его покупать, поэтому повышение цены лишь немного сокращает объем покупок.
Значение
Название
Значение
более 1
эластичный
объем сильно реагирует
менее 1
неэластичный
объем слабо реагирует
равное 1
единично эластичный
объем изменяется на тот же %, что и цена
0
абсолютно неэластичный
объем вообще не меняется
бесконечность
абсолютно эластичный
любое повышение цены обнуляет спрос
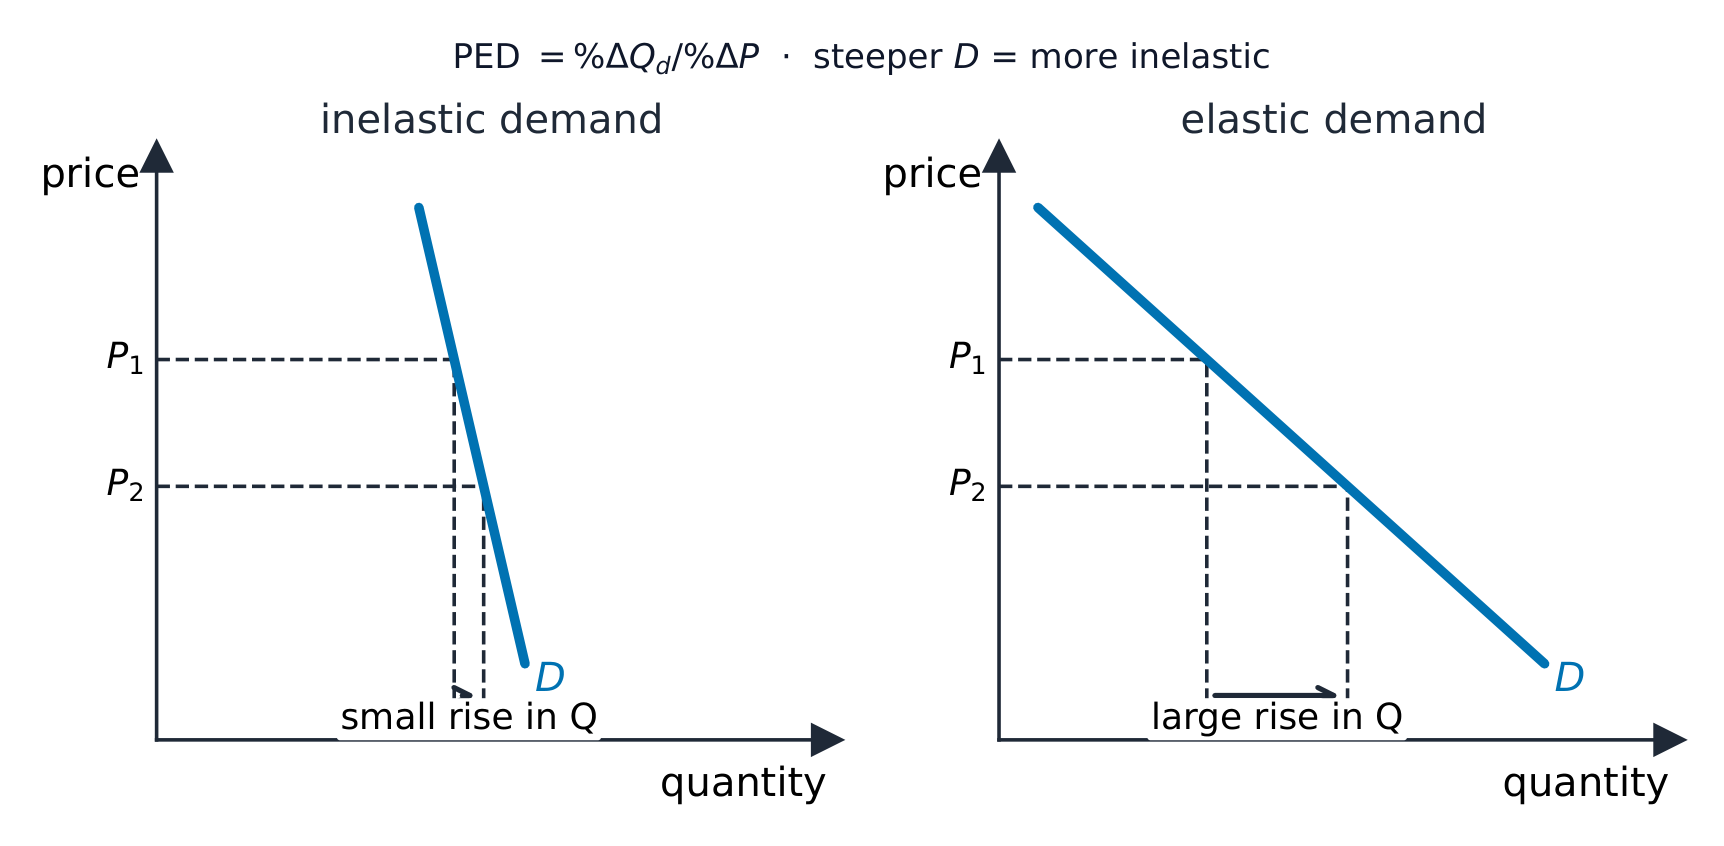
Когда спрос неэластичен (крутой), изменение цены почти не влияет на объем; когда он эластичен (пологий), то же изменение цены вызывает сильную реакцию объема.
Что делает спрос эластичным или неэластичным
количество и близость товаров-заменителей (больше заменителей → более эластичный спрос).
является ли благо необходимостью (неэластичный) или роскошью (эластичный).
доля дохода, потраченная на благо (большая доля → более эластичный спрос).
время — спрос более эластичен в долгосрочной перспективе, когда покупатели могут найти альтернативы.
привычка или зависимость делают спрос неэластичным.
Эластичность спроса по цене и совокупная выручка
совокупная выручка — это деньги, которые зарабатывает фирма: $\text{TR} = \text{price} \times \text{quantity}$. Эластичность спроса по цене (PED) показывает фирме, что происходит с выручкой при изменении цены:
Если спрос…
цена растет
цена падает
неэластичный
совокупная выручка растет
совокупная выручка падает
эластичный
совокупная выручка падает
совокупная выручка растет
единично эластичный
совокупная выручка остается прежней
совокупная выручка остается прежней
Это полезно для фирм (как устанавливать цены для увеличения выручки) и для правительств (налог на неэластичное благо, например бензин, приносит большую выручку без значительного снижения объемов продаж).
Income elasticity of demand · Доходная эластичность спроса
English
income elasticity of demand 需求收入弹性 (YED) measures how much demand responds when income changes.
$$\text{YED} = \frac{\%\ \text{change in quantity demanded}}{\%\ \text{change in income}}$$
a normal good 正常品 has positive YED: demand rises as income rises. Necessities have YED between 0 and 1; luxuries have YED above 1.
an inferior good 低档品 has negative YED: demand falls as income rises (people switch to better goods). An example is cheap instant noodles.
Worked example. A person's income rises by 20% and their demand for restaurant meals rises by 30%. Find the YED and classify the good.
$$\text{YED} = \frac{+30}{+20} = +1.5$$
YED is positive and greater than 1, so restaurant meals are a normal good — and a luxury.
This helps firms plan: as incomes grow, demand for luxuries grows fastest.
Русский
доходная эластичность спроса (YED) показывает, насколько сильно спрос реагирует на изменение доходов.
При росте дохода спрос на нормальный товар растет, а на товар низшей категории падает
$$\text{YED} = \frac{\%\ \text{change in quantity demanded}}{\%\ \text{change in income}}$$
у нормального блага YED положительна: спрос растет вместе с доходами. Товары первой необходимости имеют YED от 0 до 1; предметы роскоши — выше 1.
у низшего блага YED отрицательна: спрос падает при росте доходов (люди переходят на товары лучшего качества). Пример — дешевые лапша быстрого приготовления.
Разобранный пример. Доходы человека выросли на 20%, а спрос на обеды в ресторанах — на 30%. Найдите YED и определите тип блага.
$$\text{YED} = \frac{+30}{+20} = +1.5$$
YED положительна и больше 1, значит, обеды в ресторане — нормальное благо, а именно предмет роскоши.
Это помогает фирмам планировать: по мере роста доходов спрос на предметы роскоши увеличивается быстрее всего.
Cross elasticity of demand · Перекрестная эластичность спроса
English
cross elasticity of demand 需求交叉弹性 (XED) measures how much demand for one good responds when the price of another good changes.
$$\text{XED} = \frac{\%\ \text{change in quantity demanded of A}}{\%\ \text{change in price of B}}$$
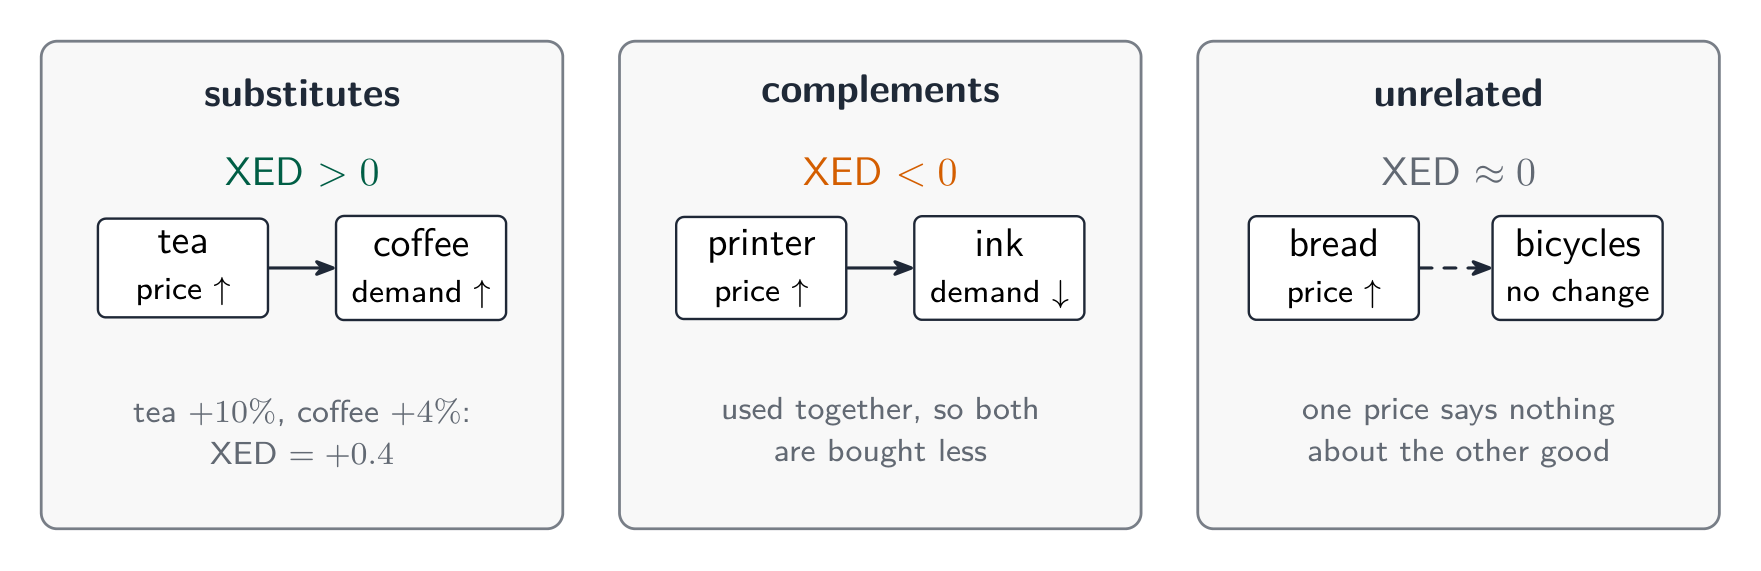
for substitutes, XED is positive (the price of B rises, so people buy more A).
for complements, XED is negative (the price of B rises, so people buy less A and less B).
for goods that are not related, XED is about zero.
Worked example. When the price of tea rises by 10%, the quantity of coffee demanded rises by 4%. Find the XED and say how the two goods are related.
$$\text{XED} = \frac{+4}{+10} = +0.4$$
XED is positive, so tea and coffee are substitutes.
This helps a firm watch its rivals: if XED with a rival's good is high and positive, a price cut by the rival will hurt its sales.
Русский
перекрестная эластичность спроса (XED) показывает, насколько сильно спрос на одно благо реагирует на изменение цены другого блага.
$$\text{XED} = \frac{\%\ \text{change in quantity demanded of A}}{\%\ \text{change in price of B}}$$
для взаимозаменяемых благ XED положительна (цена B растет, поэтому люди покупают больше A).
для взаимодополняемых благ XED отрицательна (цена B растет, поэтому люди покупают меньше A и меньше B).
для несопоставимых благ XED близка к нулю.
Разобранный пример. Когда цена чая выросла на 10%, объем спроса на кофе увеличился на 4%. Найдите XED и определите связь между товарами.
$$\text{XED} = \frac{+4}{+10} = +0.4$$
Знак XED: положительный для взаимозаменяемых, отрицательный для взаимодополняемых, близкий к нулю для несопоставимых
XED положительна, значит, чай и кофе являются взаимозаменяемыми благами.
Это помогает фирме следить за конкурентами: если XED с товаром конкурента высокая и положительная, снижение цен конкурентом навредит его продажам.
2.3
Price elasticity of supply · Эластичность предложения по цене
Syllabus · Программа
English
define, calculate and interpret price elasticity of supply (PES)
explain the determinants of PES, including time period (momentary, short run, long run)
Русский
определить, рассчитать и интерпретировать ценовую эластичность предложения (PES)
объяснить детерминанты PES, включая временной период (моментальный, краткосрочный, долгосрочный)
Source: Cambridge International syllabus · Источник: Программа Cambridge International
English
Elastic vs inelastic demand
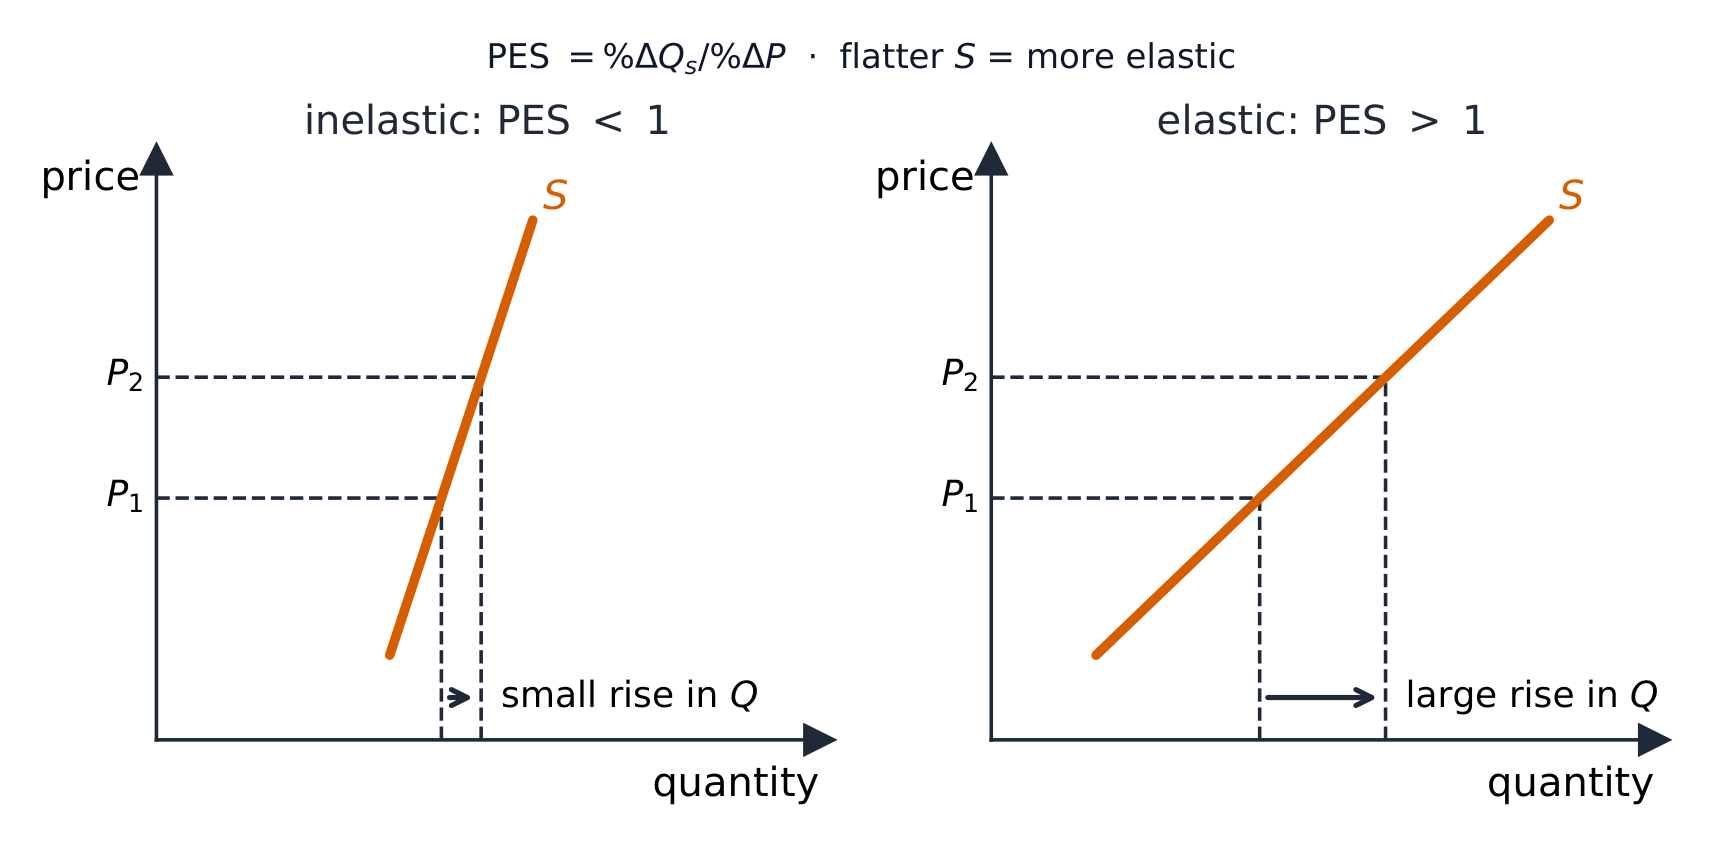
price elasticity of supply 供给价格弹性 (PES) measures how much the quantity supplied responds when the price changes.
$$\text{PES} = \frac{\%\ \text{change in quantity supplied}}{\%\ \text{change in price}}$$
PES is positive. Supply is elastic if it responds a lot, inelastic if it responds little.
Worked example. The price of a good rises by 8% and the quantity supplied rises by 4%. Find the PES.
$$\text{PES} = \frac{4}{8} = 0.5$$
PES is less than 1, so supply is inelastic.
What makes supply more elastic:
spare capacity 闲置产能 — unused machines and workers, so firms can quickly make more.
stocks 库存 — goods stored in a warehouse that can be sold fast.
how easily factors of production can move into the industry.
time. Economists split time into three periods:
the momentary 瞬时 period — supply is fixed; PES is zero.
the short run 短期 — at least one factor is fixed, so supply can rise only a little.
the long run 长期 — all factors can change, so supply is most elastic.
Русский
Эластичность против неэластичности спроса
эластичность предложения по цене (PES) показывает, насколько сильно объем предложения реагирует на изменение цены.
$$\text{PES} = \frac{\%\ \text{change in quantity supplied}}{\%\ \text{change in price}}$$
PES положительна. Предложение является эластичным, если оно сильно реагирует, и неэластичным, если реакция слабая.
Разобранный пример. Цена блага выросла на 8%, а объем предложения — на 4%. Найдите PES.
$$\text{PES} = \frac{4}{8} = 0.5$$
PES меньше 1, значит, предложение неэластично.
Один и тот же рост цены: малая реакция предложения при PES ниже 1, большая — при PES выше 1
Что делает предложение более эластичным:
свободные мощности — неиспользуемое оборудование и рабочие силы, позволяющие фирме быстро увеличить выпуск.
запасы — товары, хранящиеся на складе, которые можно быстро продать.
насколько легко факторы производства могут перемещаться в отрасль.
время. Экономисты выделяют три периода:
моментальный период — предложение фиксировано; PES равно нулю.
краткосрочный период — как минимум один фактор фиксирован, поэтому предложение может вырасти лишь немного.
долгосрочный период — все факторы могут измениться, поэтому предложение наиболее эластично.
Explore · Исследовать
Demand & supply · Спрос и предложение
Supply elasticity is how much quantity responds to price. · Эластичность предложения показывает, насколько объем responds to price (реагирует на цену).
The interaction of demand and supply · Взаимодействие спроса и предложения
Syllabus · Программа
English
explain equilibrium price and quantity and how shifts in demand and supply change equilibrium
explain disequilibrium (excess demand and excess supply) and the functions of the price mechanism
apply demand and supply analysis to product, factor and foreign exchange markets
Русский
объяснить равновесную цену и равновесное количество и то, как сдвиги спроса и предложения меняют равновесие
объяснить дисбаланс (избыточный спрос и избыточное предложение) и функции ценового механизма
применить анализ спроса и предложения к рынкам товаров, факторов и иностранной валюты
Source: Cambridge International syllabus · Источник: Программа Cambridge International
English
Equilibrium
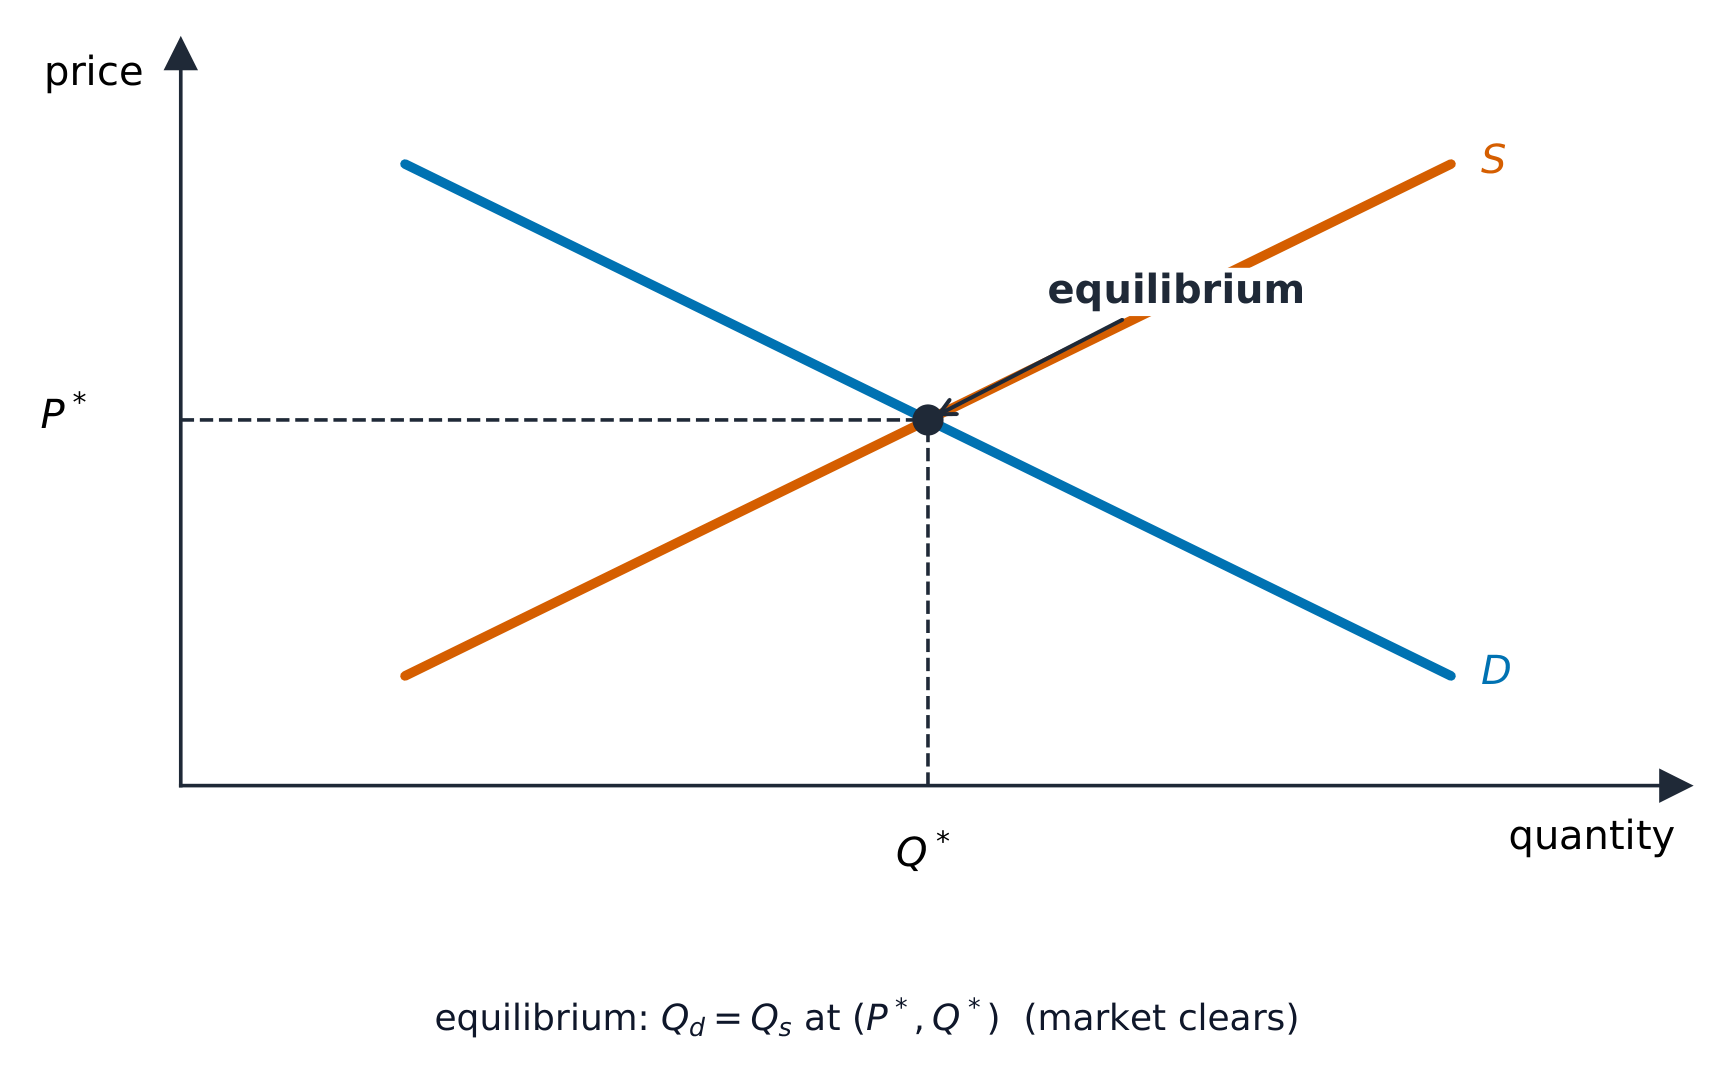
The market is in equilibrium 均衡 where the demand curve crosses the supply curve. Here demand equals supply. This gives the equilibrium price 均衡价格 and the equilibrium quantity 均衡数量. There is no pressure for the price to change.
Disequilibrium
When the price is not at equilibrium, the market is in disequilibrium 非均衡:
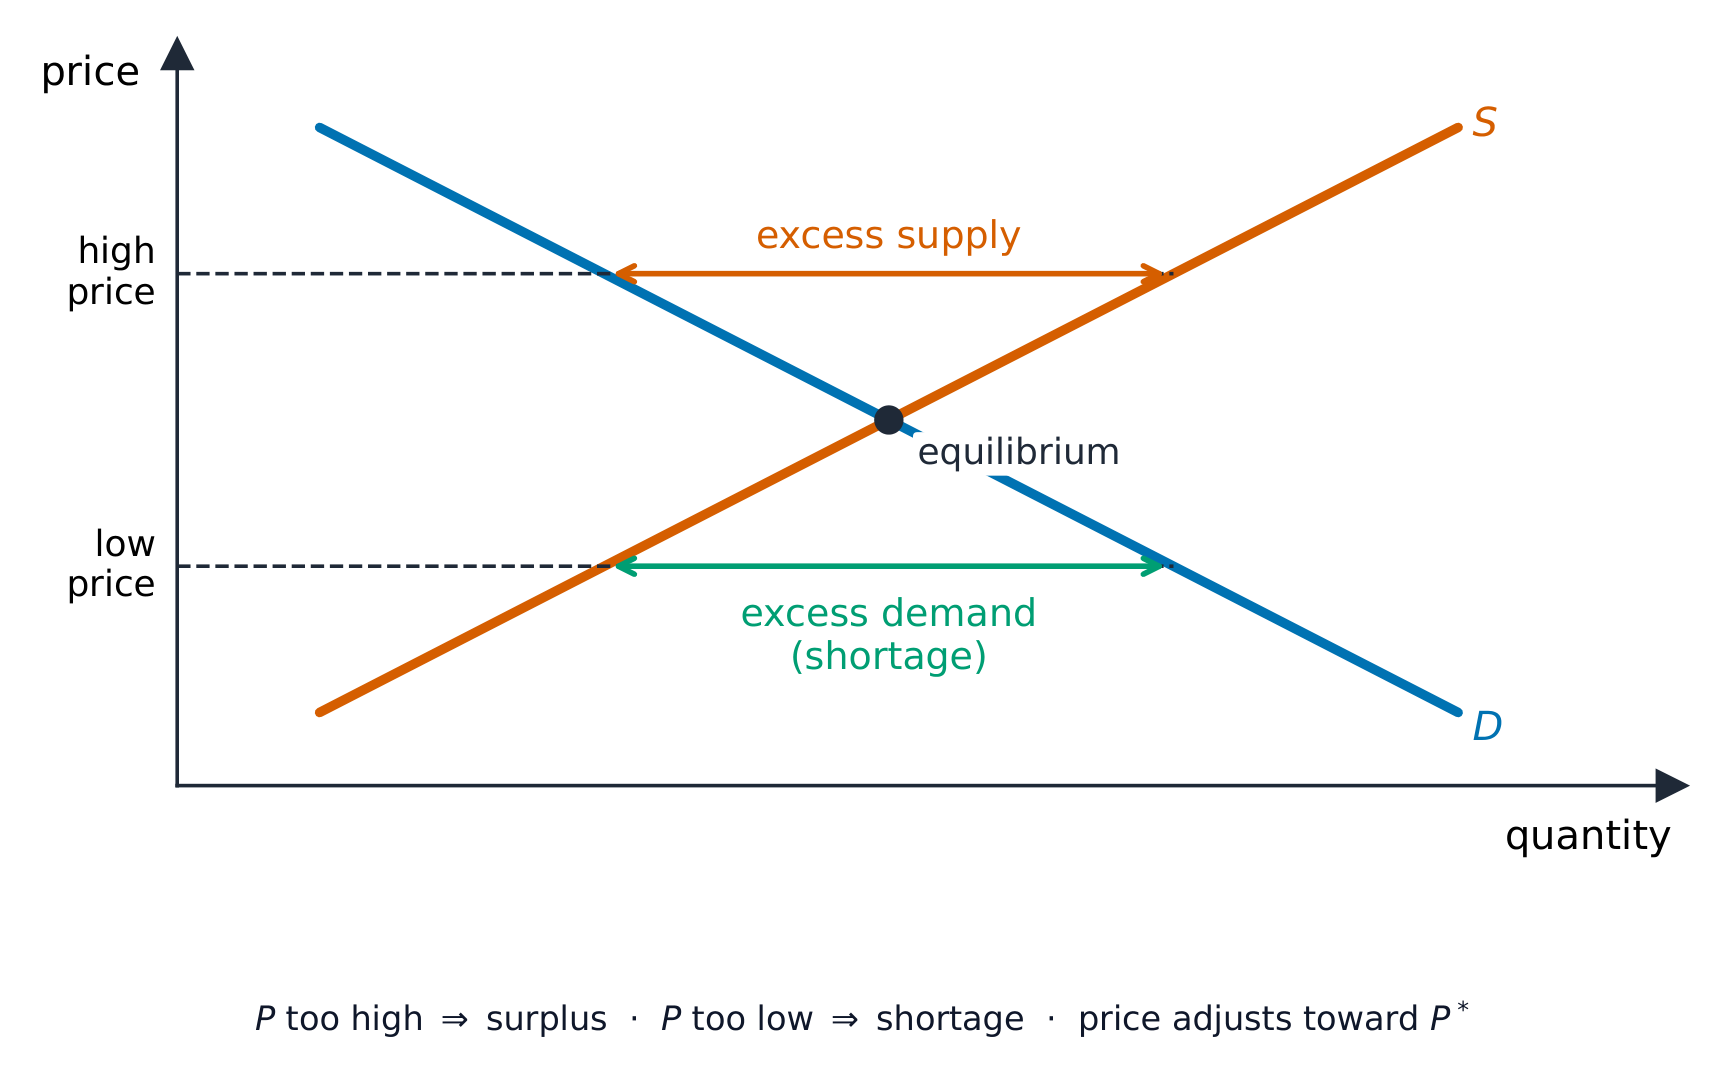
if the price is too low, there is excess demand 超额需求 (a shortage 短缺). Buyers compete, so the price is pushed up.
if the price is too high, there is excess supply 超额供给. Sellers cannot sell everything, so the price is pushed down.
In both cases the price moves back to equilibrium. This shows the price mechanism doing its jobs of signalling, rationing and giving an incentive.
How shifts change the equilibrium
Change
Effect on price
Effect on quantity
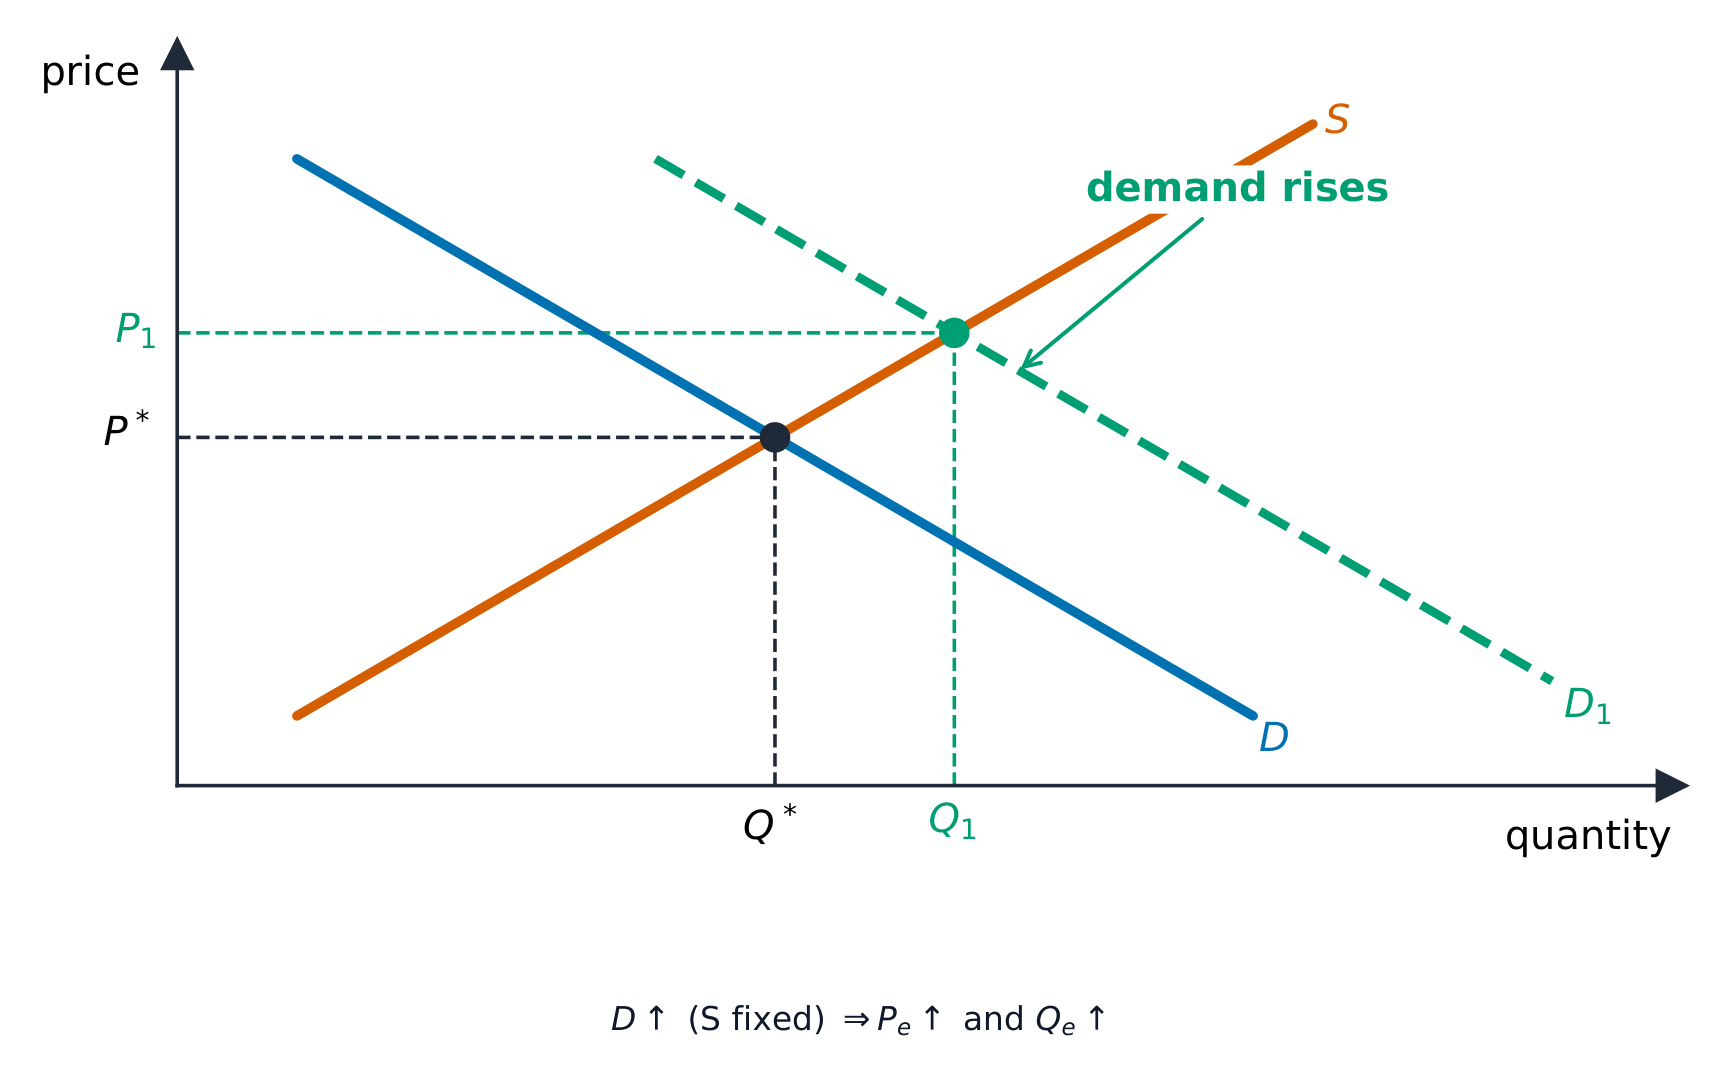
demand rises (shifts right)
rises
rises
demand falls (shifts left)
falls
falls
supply rises (shifts right)
falls
rises
supply falls (shifts left)
rises
falls
Demand and supply in different markets
The same analysis works in many markets:
in product markets 产品市场, demand and supply set the price of goods and services.
in factor markets 要素市场, they set the price of factors — for example, the demand for and supply of labour set the wage 工资.
in the foreign exchange market 外汇市场, the demand for and supply of a currency set the exchange rate 汇率 (the price of one currency in terms of another).
Русский
На рынке покупатели и продавцы встречаются, и цена устанавливается там, где спрос равен предложению
Равновесие
Рынок находится в равновесии, где кривая спроса пересекает кривую предложения. Здесь спрос равен предложению. Это определяет равновесную цену и равновесное количество. Давления на изменение цены нет.
На равновесной цене $P^*$ и равновесном количестве $Q^*$ кривые пересекаются, поэтому объем спроса равен объему предложения.
Нереавновесие
Когда цена не соответствует уровню равновесия, рынок находится в состоянии нереавновесия:
если цена слишком низкая, возникает избыточный спрос (дефицит). Покупатели конкурируют, толкая цену вверх.
если цена слишком высокая, возникает избыточное предложение. Продавцы не могут реализовать всё, поэтому цена снижается.
В обоих случаях цена возвращается к равновесию. Это демонстрирует работу ценового механизма в качестве сигнального, распределительного инструмента и стимула.
Выше равновесной цены наблюдается избыточное предложение; ниже него — избыточный спрос (дефицит). В любом случае цена возвращается к равновесию.
Как сдвиги влияют на равновесие
Изменение
Влияние на цену
Влияние на количество
спрос растет (сдвиг вправо)
растет
растет
спрос падает (сдвиг влево)
падает
падает
предложение растет (сдвиг вправо)
падает
растет
предложение падает (сдвиг влево)
растет
падает
При неизменном предложении рост спроса ($D \to D_1$) повышает как равновесную цену, так и равновесный объем.
Спрос и предложение на различных рынках
Тот же анализ применим во многих рынках:
на рынках товаров спрос и предложение определяют цены на товары и услуги.
на рынках факторов производства они определяют цены на факторы — например, спрос и предложение труда устанавливают зарплату.
на рынке валютных курсов спрос и предложение на валюту определяют валютный курс (цену одной валюты в пересчете на другую).
Explore · Исследовать
Demand & supply · Спрос и предложение
Where demand meets supply sets the equilibrium price and quantity. · Там, где спрос встречается с предложением, устанавливается равновесная цена и количество.
Explore · Исследовать
Finding the equilibrium price · Нахождение равновесной цены
Shift demand or supply and watch the equilibrium price and quantity move to where the two lines cross. · Сдвиньте спрос или предложение и наблюдайте, как равновесная цена и количество перемещаются к точке пересечения двух линий.
Consumer and producer surplus · Излишки потребителя и производителя
Syllabus · Программа
English
define and identify consumer surplus and producer surplus on a diagram
explain how changes in demand, supply and price affect consumer and producer surplus
Русский
определить и обозначить излишек потребителя и излишек производителя на диаграмме
объяснить, как изменения спроса, предложения и цены влияют на излишек потребителя и излишек производителя
Source: Cambridge International syllabus · Источник: Программа Cambridge International
English
consumer surplus 消费者剩余 is the gain to buyers. It is the difference between the most a consumer was willing to pay and the price actually paid. On a diagram it is the area below the demand curve and above the price line.
producer surplus 生产者剩余 is the gain to sellers. It is the difference between the price a producer receives and the lowest price the producer would have accepted. On a diagram it is the area above the supply curve and below the price line.
How they change:
if demand rises, the price and quantity rise, so producer surplus rises and consumer surplus usually rises too.
if supply rises, the price falls and quantity rises, so consumer surplus rises.
a higher price (with the curves fixed) raises producer surplus but lowers consumer surplus.
Together, consumer surplus plus producer surplus is the total welfare 福利 (gain to society) from the market. It is largest at the free-market equilibrium.
Русский
Потребительский излишек — это выгода для покупателей. Это разница между максимальной ценой, которую потребитель был готов заплатить, и фактически уплаченной ценой. На диаграмме это область ниже кривой спроса и выше линии цены.
Производительный излишек — это выгода для продавцов. Это разница между ценой, которую получает производитель, и минимальной ценой, которую он был бы готов принять. На диаграмме это область выше кривой предложения и ниже линии цены.
Потребительский излишек — это область ниже спроса и выше цены; производительный излишек — это область выше предложения и ниже цены.
Как они изменяются:
если спрос растет, цена и объем растут, поэтому производительный излишек увеличивается, а потребительский излишек обычно тоже растет.
если предложение растет, цена падает, а объем увеличивается, поэтому потребительский излишек растет.
более высокая цена (при неизменных кривых) увеличивает производительный излишек, но снижает потребительский излишек.
Вместе потребительский излишек плюс производительный излишек составляют общую благосостояние (выгоду для общества) от рынка. Оно максимально при равновесии свободного рынка.
Explore · Исследовать
Demand & supply · Спрос и предложение
Surplus sits between the curves and the going price. · Излишек находится между кривыми и текущей ценой.
Source: Cambridge International syllabus · Источник: Программа Cambridge International
A free market often gives a good result, but not always. market failure 市场失灵 is when the market does not allocate 配置 (share out) resources efficiently — too much or too little of a good is made. Then the government may step in.
There are several reasons for market failure.
A coal power station: producing electricity can impose a negative externality such as pollution on people who are not part of the deal.
Externalities
An externality 外部性 is a cost or a benefit that falls on a third party 第三方 — someone who is not the buyer or the seller.
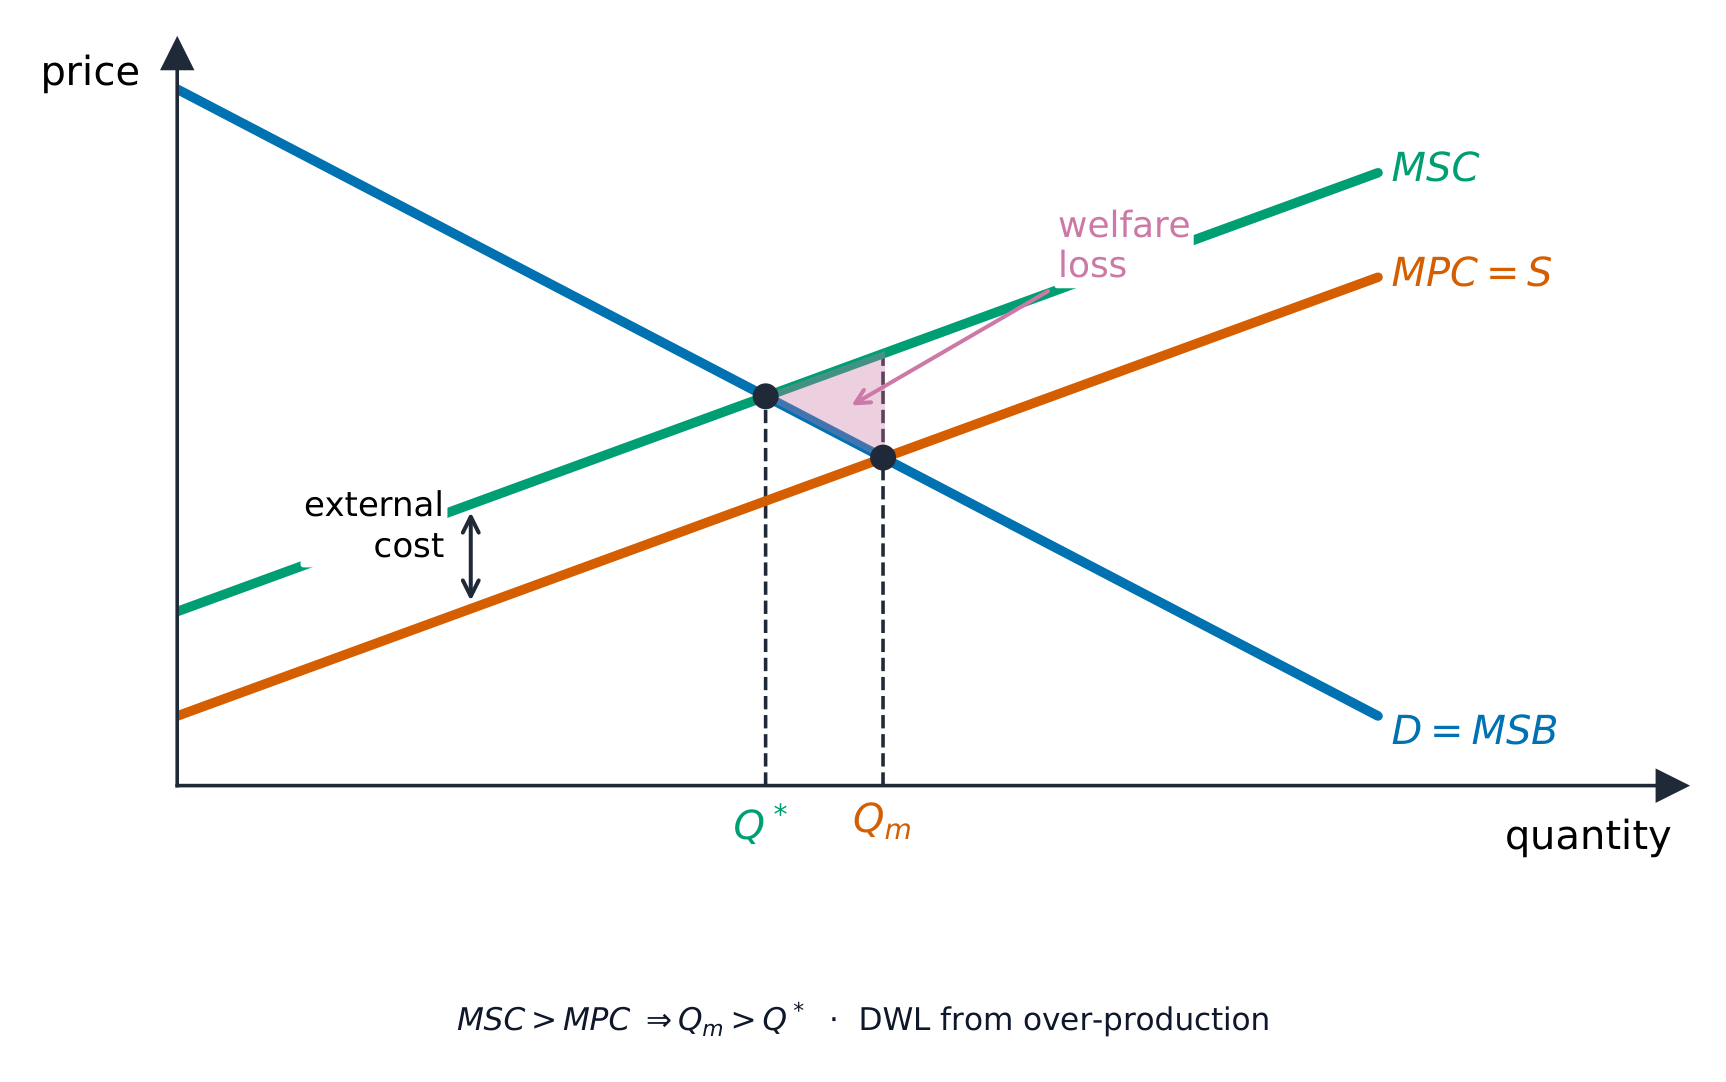
a negative externality 负外部性 is an external cost 外部成本 paid by others, like the pollution from a factory. The social cost 社会成本 (the cost to all of society) is bigger than the private cost 私人成本 (the cost to the producer). When people ignore the external cost, the market makes too much of the good.
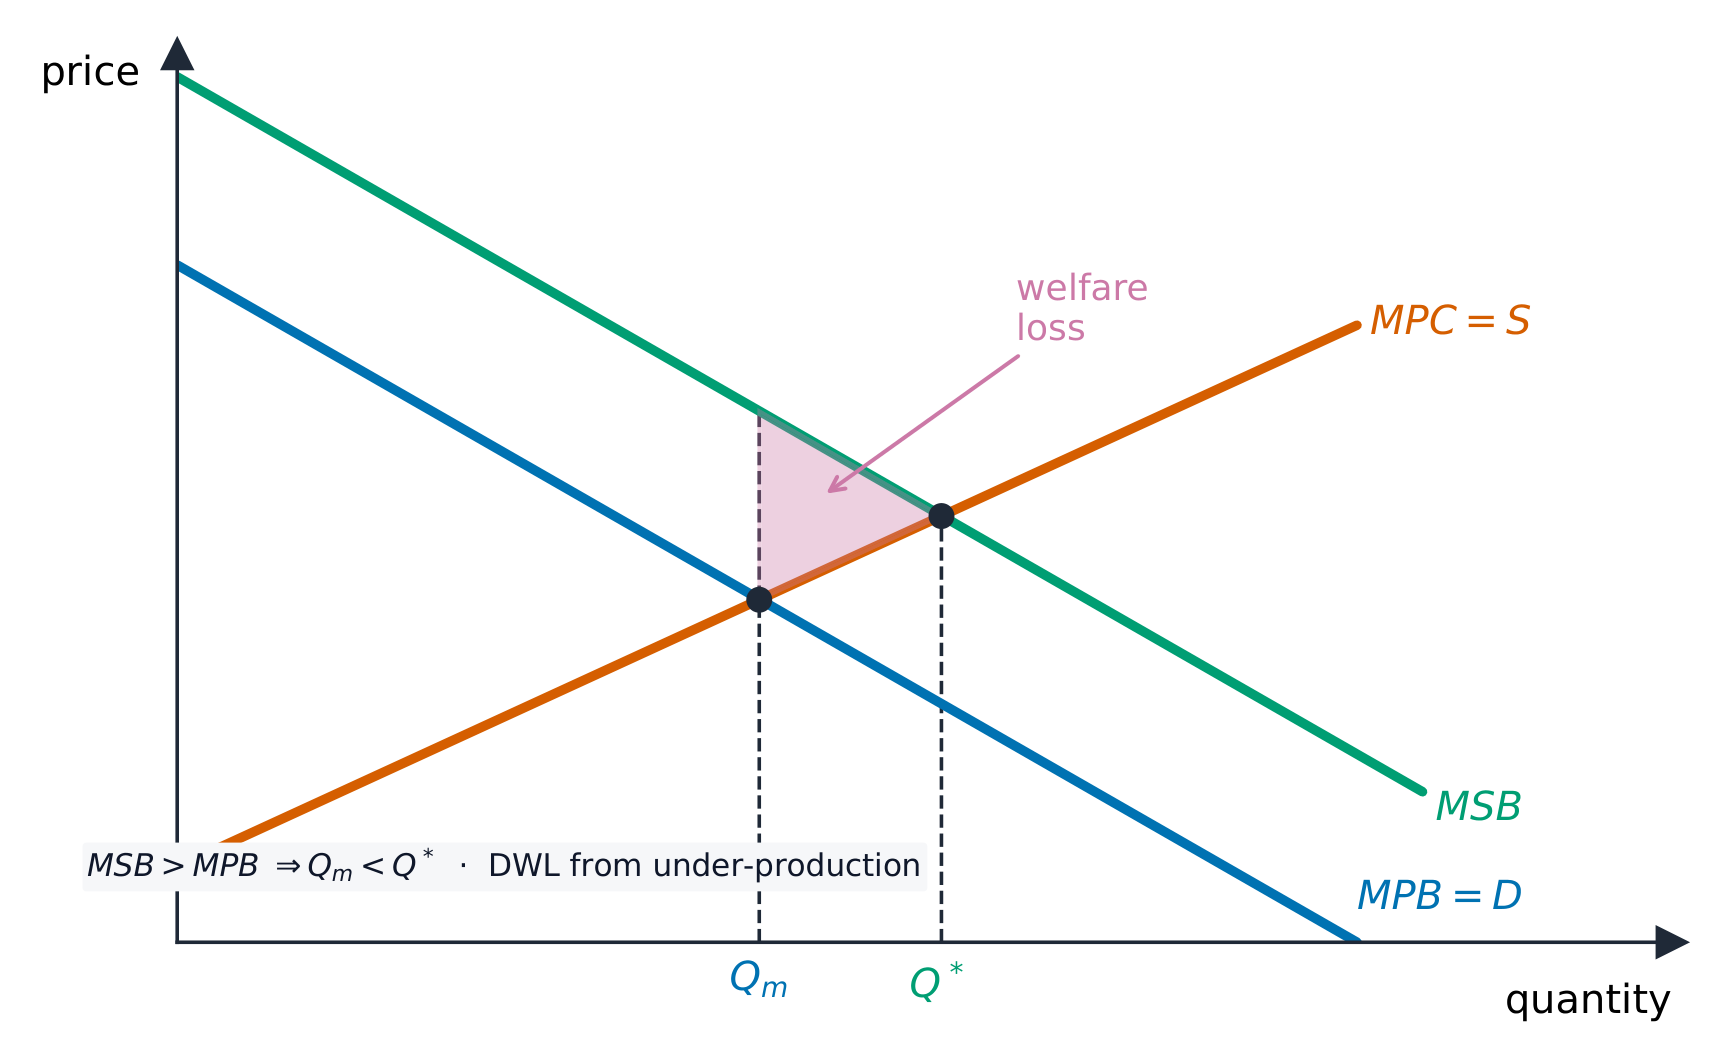
a positive externality 正外部性 is an external benefit 外部收益 enjoyed by others, like the protection that vaccination gives to everyone. Here the market makes too little, because buyers ignore the benefit to others.
With a negative externality, social cost (MSC) is above private cost (MPC), so the market over-produces at $Q_m$ instead of the social optimum $Q^*$; the shaded triangle is the welfare loss.With a positive externality, social benefit (MSB) is above private benefit (MPB), so the market under-produces at $Q_m$ instead of the social optimum $Q^*$.
Public goods
A public good 公共物品 (like street lighting or national defence) has non-rivalry 非竞争性 and non-excludability 非排他性. Because non-payers cannot be shut out, there is a free-rider problem 搭便车问题, so private firms make no profit and supply none. The market fails completely.
Merit and demerit goods
A merit good 优值品 (like education) is under-consumed; a demerit good 劣值品 (like cigarettes) is over-consumed. People misjudge them because of information failure 信息失灵 — they do not know, or do not use, the true benefit or harm.
Monopoly power
monopoly 垄断 means one firm dominates a market. A firm with monopoly power 垄断势力 can cut output and raise the price above the competitive level. This wastes resources and harms consumers.
Inequality and asymmetric information
the market rewards people who own resources, so it can produce great inequality 不平等 — some people are left with too little to live on.
asymmetric information 信息不对称 is when one side of a deal knows more than the other (a used-car seller knows the faults; the buyer does not). This leads to poor decisions and unfair deals.
Explore · Исследовать
The market and where it fails · Рынок и места его неудач
Supply and demand set the market price and quantity at their intersection. Market failure is when this free-market outcome is not the best one for society. · Предложение и спрос устанавливают рыночную цену и количество в точке их пересечения. Неэффективность рынка возникает, когда этот результат свободного рынка не является наилучшим для общества.
explain methods of intervention: indirect taxes, subsidies, maximum and minimum prices, buffer stocks, regulation, provision, tradable permits
analyse the effects of intervention, including the incidence of indirect taxes and the concept of government failure
Русский
объяснить методы вмешательства: косвенные налоги, субсидии, максимальные и минимальные цены, буферные запасы, регулирование, предоставление, торгуемые квоты (лицензии)
проанализировать последствия вмешательства, включая распределение бремени косвенных налогов и концепцию провала государства
Source: Cambridge International syllabus · Источник: Программа Cambridge International
A maximum price creates a shortage
Indirect taxes
An indirect tax 间接税 is a tax on spending. It raises a firm's costs, shifts the supply curve to the left, and so raises the price and cuts the quantity. Governments tax demerit goods (like tobacco) and goods with negative externalities to make people use less.
Cigarettes are a demerit good — overconsumed because people misjudge the harm — so governments tax them heavily.
The incidence of a tax 税收归宿 is who really pays it. This depends on elasticity:
if demand is inelastic 缺乏弹性, consumers pay most of the tax (the price rises by nearly the full tax).
if demand is elastic 富有弹性, producers pay most of the tax (they cannot pass it on).
An indirect tax shifts supply up to $S+\text{tax}$, raising the price and cutting the quantity; the burden is shared between consumers and producers.
Subsidies
A subsidy 补贴 is a government payment to producers. It lowers their costs, shifts the supply curve to the right, and so lowers the price and raises the quantity. Subsidies are used for merit goods and goods with positive externalities.
A subsidy shifts supply down to $S+\text{subsidy}$, lowering the price and raising the quantity traded.
Maximum and minimum prices
a maximum price 最高限价 is a legal top price, set below equilibrium (for example, rent control). Because the price is held down, quantity demanded is greater than quantity supplied, so there is a shortage 短缺.
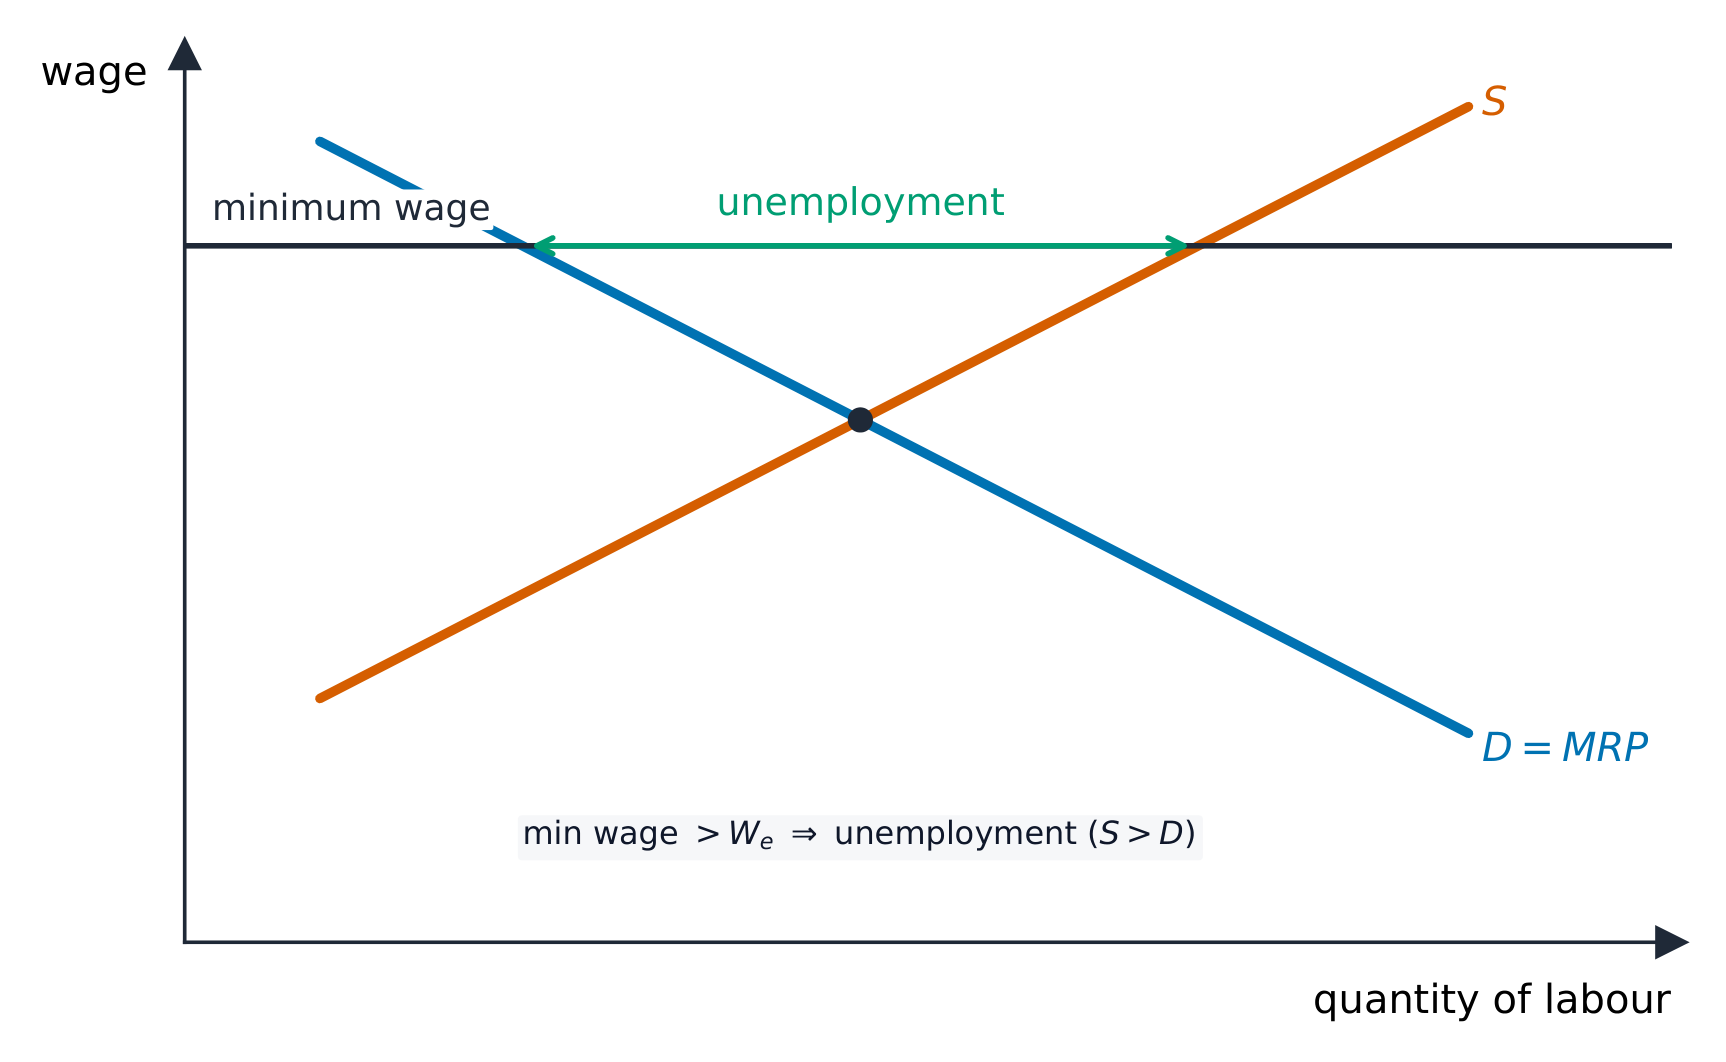
a minimum price 最低限价 is a legal bottom price, set above equilibrium (for example, a minimum wage, or a floor for farm prices). Because the price is held up, quantity supplied is greater than quantity demanded, so there is excess supply 超额供给.
A maximum price set below equilibrium leaves a shortage; a minimum price set above equilibrium leaves a surplus.
Buffer stocks
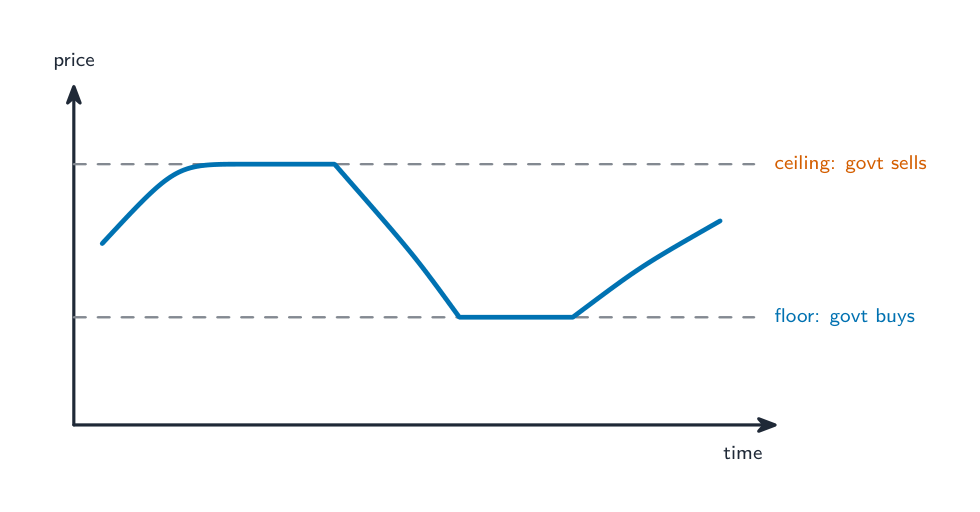
A buffer stock 缓冲库存 is used to steady the price of farm goods. The government buys and stores the good when the price is low, and sells from the store when the price is high. This keeps the price inside a target band.
A buffer stock holds the price in a band: the government buys when it hits the floor and sells when it hits the ceiling
Regulation, provision and permits
regulation 管制 means rules and laws — bans, age limits, safety standards, or pollution limits.
state provision 政府提供 means the government 政府 supplies a good directly, often free at the point of use (public goods and merit goods like schools and hospitals).
tradable permits 可交易许可证 set a total cap on pollution and give firms permits to pollute. Firms that pollute less can sell spare permits to firms that pollute more. This caps total pollution at the lowest cost.
Government failure
Intervention does not always help. government failure 政府失灵 is when the government's action makes the use of resources worse, not better. Common causes:
poor information, so the government sets the wrong tax or subsidy.
high cost of running the policy.
unintended results — for example, a maximum price can create an illegal black market 黑市.
decisions made for political reasons rather than for efficiency.
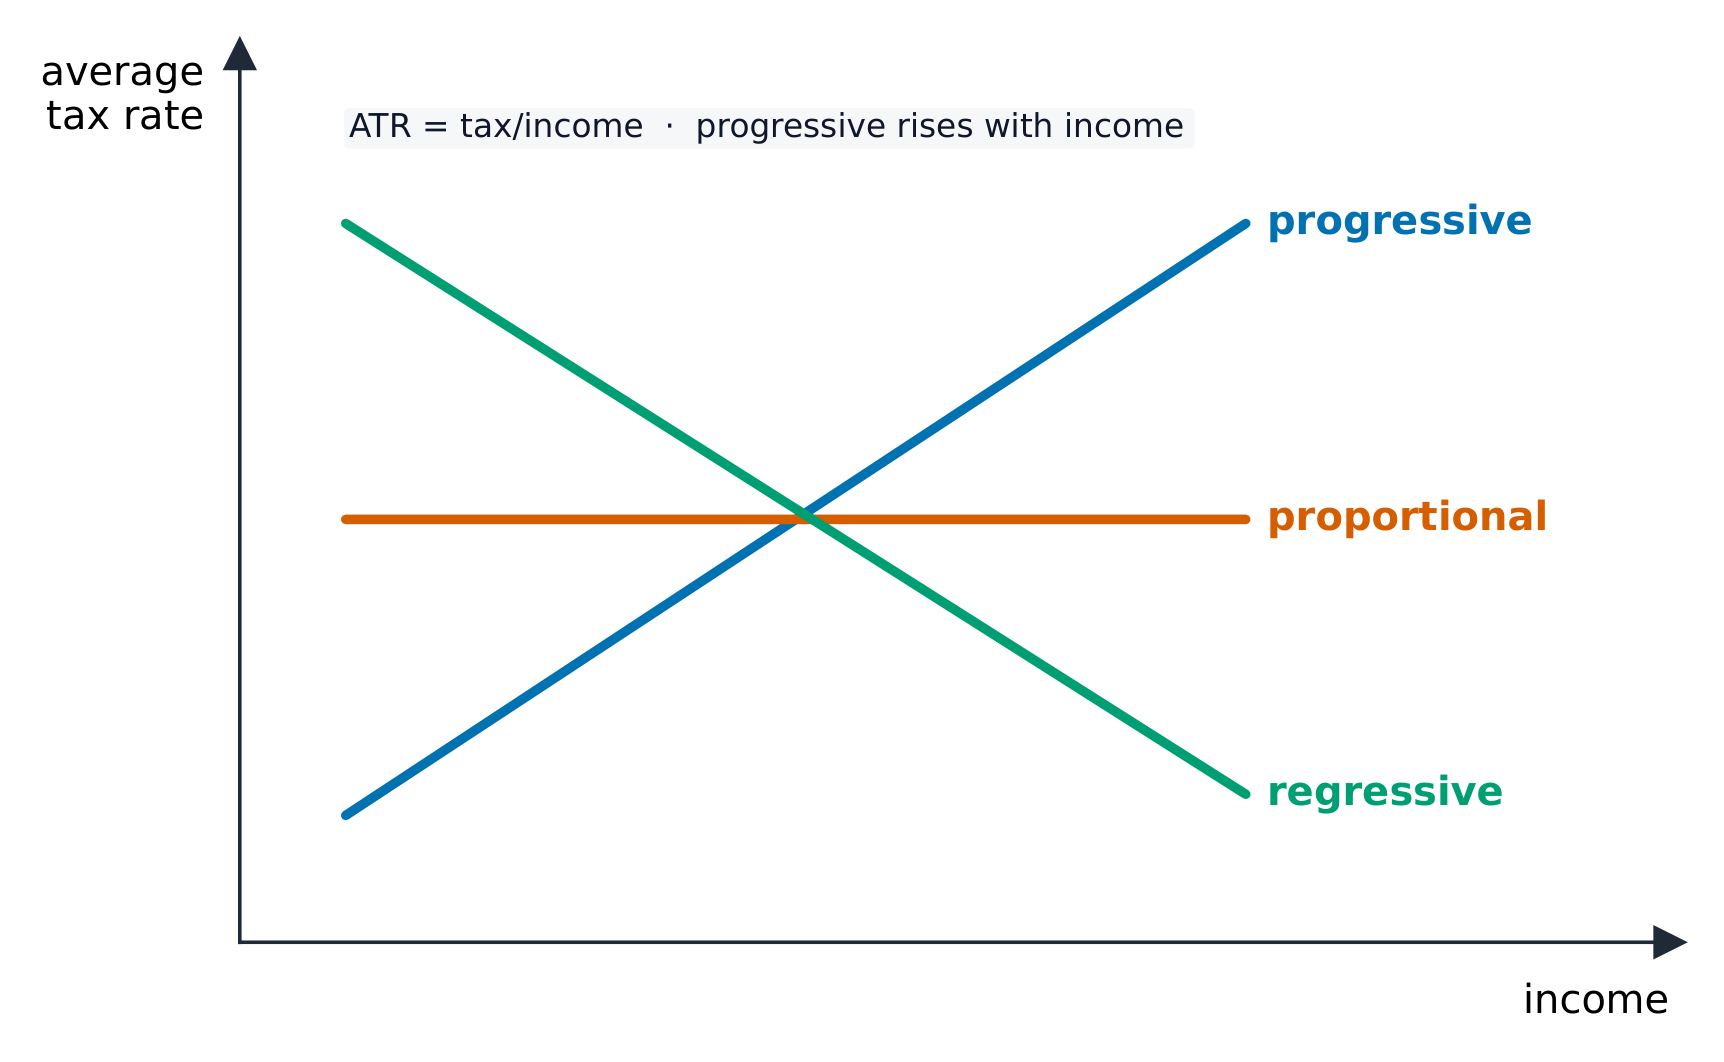
Worked example. A government puts a £2 per-packet tax on cigarettes, whose demand is very price-inelastic. Who really pays it, and what does that mean for the policy's two aims? The incidence falls mainly on whichever side is less able to respond - the more inelastic one. Because smokers keep buying almost the same quantity as the price rises, producers can pass most of the tax on, so consumers bear most of the incidence: the price might rise by about £1.80, with producers absorbing only about £0.20. That creates the tension the question is really testing. As a revenue raiser the tax succeeds: quantity barely falls, so revenue is large and steady. As a way of cutting consumption it largely fails - for exactly the same reason. And because poorer smokers spend a larger share of their income on it, the tax is regressive. Argue from elasticity to incidence, then judge each aim separately.
Explore · Исследовать
Reasons for intervention · Причины вмешательства
Governments step into markets when the free-market equilibrium isn't the best outcome for society. · Правительства вмешиваются в рынки, когда равновесие свободного рынка не является наилучшим исходом для общества.
distinguish income and wealth and explain the causes of inequality
explain policies to redistribute income and wealth (progressive taxation, benefits, provision of services) and their effects
Русский
различать доход и богатство и объяснять причины неравенства
объяснить политику перераспределения доходов и богатства (прогрессивное налогообложение, социальные пособия, предоставление услуг) и её последствия
Source: Cambridge International syllabus · Источник: Программа Cambridge International
It helps to separate two ideas:
income 收入 is a flow 流量 — money received over a period, such as wages, rent and interest.
wealth 财富 is a stock 存量 — the value of assets owned at a point in time, such as houses, shares and savings.
Wealth produces income (savings earn interest), and income can be saved to build wealth, so the two are linked. Inequality has many causes: differences in skills and wages, the ownership of wealth, inheritance, and unemployment.
Policies to reduce inequality
a progressive tax 累进税 takes a larger percentage 百分比 from higher incomes than from lower incomes. This narrows the gap after tax.
benefits 福利金 (also called transfer payments 转移支付) are money paid by the government to the poor, the old, and the unemployed.
state provision of free services, like education and health care, raises the real living standards of poorer people.
Together these policies bring about redistribution 再分配 — moving income and wealth from richer to poorer people. But there is a trade-off 取舍: very high taxes and large benefits may weaken the incentive 激励 to work and to invest.
Wealth and poverty side by side: markets alone may leave large income inequality unaddressed
Explore · Исследовать
Inequality policy route · Путь политики по борьбе с неравенством
Follow how policy can change disposable income and opportunity. · Проследите, как политика может изменить располагаемый доход и возможности.
Macroeconomics 宏观经济学 looks at the whole economy at once: its total output, its jobs, and its prices. This handout covers how we measure the economy and the main problems it can face.
4.1
National income statistics
Syllabus · Программа
English
define GDP, GNI and national income and distinguish nominal and real, and total and per capita values
explain the uses and limitations of national income statistics for measuring living standards and making comparisons
Русский
определить ВВП, ВНД и национальный доход, а также различать номинальные и реальные, а также общие и расчетные на душу населения показатели
объяснить применение и ограничения статистики национального дохода для измерения уровня жизни и проведения сравнений
Source: Cambridge International syllabus · Источник: Программа Cambridge International
To judge how an economy is doing, we measure its national income 国民收入 — the total value of everything it produces in a year.
National income (GDP) is the value of all the goods and services a country produces in a year.
gross domestic product 国内生产总值 (GDP) is the value of all goods and services made inside a country in a year.
gross national income 国民总收入 (GNI) is GDP plus the income a country's people and firms earn abroad, minus income foreigners earn inside it.
Two important differences:
nominal 名义 values are measured at current prices. real 实际 values are adjusted to remove the effect of rising prices, so they show the true change in output. Always compare real values over time.
total values cover the whole country. per capita 人均 values are divided by the population, so they show the average per person.
Uses and limitations
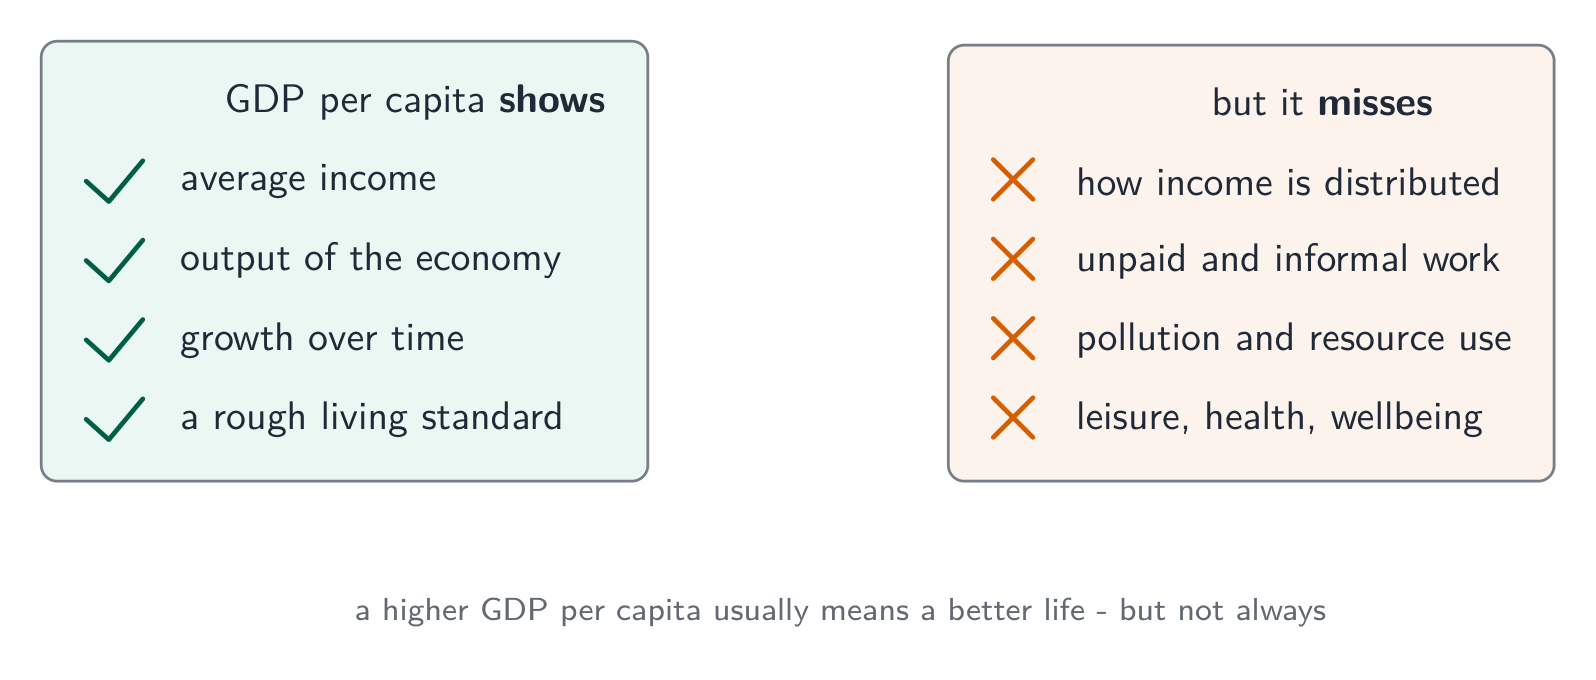
National income is used to measure the standard of living 生活水平 and to compare countries. But it has limits:
it ignores the distribution 分配 of income — a high average can hide great inequality.
it leaves out unpaid work (housework) and the informal economy 非正规经济 (hidden, untaxed activity).
it says nothing about pollution, leisure time, or health.
So a higher GDP per capita usually means a better life, but not always.
GDP per capita shows average income and output, but misses distribution, unpaid work and pollution
Explore · Исследовать
National income flow · Поток национального дохода
Watch spending become income, output and expenditure in the circular flow. · Следите, как расходы становятся доходом, продукцией и расходами в кругообороте.
explain the circular flow of income with injections (investment, government spending, exports) and leakages (saving, taxation, imports)
explain equilibrium in the circular flow and the distinction between a closed and open economy
Русский
объяснить кругооборот доходов и расходов с инъекциями (инвестиции, государственные расходы, экспорт) и утечками (сбережения, налогообложение, импорт)
объяснить равновесие в кругообороте и различие между закрытой и открытой экономикой
Source: Cambridge International syllabus · Источник: Программа Cambridge International
The circular flow of income
The circular flow of income 收入循环流 shows money moving around the economy. Households 家庭 supply factors of production to firms 企业 and receive income (wages, rent, interest, profit). They spend that income on goods and services, and the money flows back to firms.
Money also leaves and enters this flow:
leakages 漏出 take money out of the flow: saving 储蓄, taxation 税收, and spending on imports 进口.
injections 注入 put money into the flow: investment 投资, government spending 政府支出, and exports 出口.
The flow is in equilibrium 均衡 when total injections equal total leakages. If injections are greater, the economy grows; if leakages are greater, it shrinks.
Money loops between households and firms; leakages (saving, taxation, imports) drain it, while injections (investment, government spending, exports) add to it.
A closed economy 封闭经济 has no trade with other countries. An open economy 开放经济 trades, so it has exports and imports.
Explore · Исследовать
Injections & leakages · Вливания и утечки
Money loops between households and firms. Injections grow national income, leakages shrink it; they are equal at equilibrium. · Деньги циркулируют между домохозяйствами и фирмами. Вливания увеличивают национальный доход, утечки уменьшают его; они равны в состоянии равновесия.
Explore · Исследовать
The circular flow of income · Кругооборот дохода
Money flows in a loop: households earn income from firms, then spend it back on the firms' goods. Step round the cycle. · Деньги текут по кругу: домохозяйства получают доход от фирм, затем тратят его обратно на товары фирм. Пройдите по циклу.
define the components of aggregate demand (C + I + G + (X−M)) and explain the shape of the AD curve
explain short-run and long-run aggregate supply and the determinants of AD and AS
use AD/AS analysis to determine macroeconomic equilibrium and the price level and real output
Русский
определить компоненты совокупного спроса (C + I + G + (X−M)) и объяснить форму кривой AD
объяснить краткосрочный и долгосрочный совокупный предложение и факторы, определяющие AD и AS
использовать AD/AS-анализ для определения макроэкономического равновесия, ценового уровня и реального объема выпуска
Source: Cambridge International syllabus · Источник: Программа Cambridge International
Aggregate demand and supply
Aggregate demand
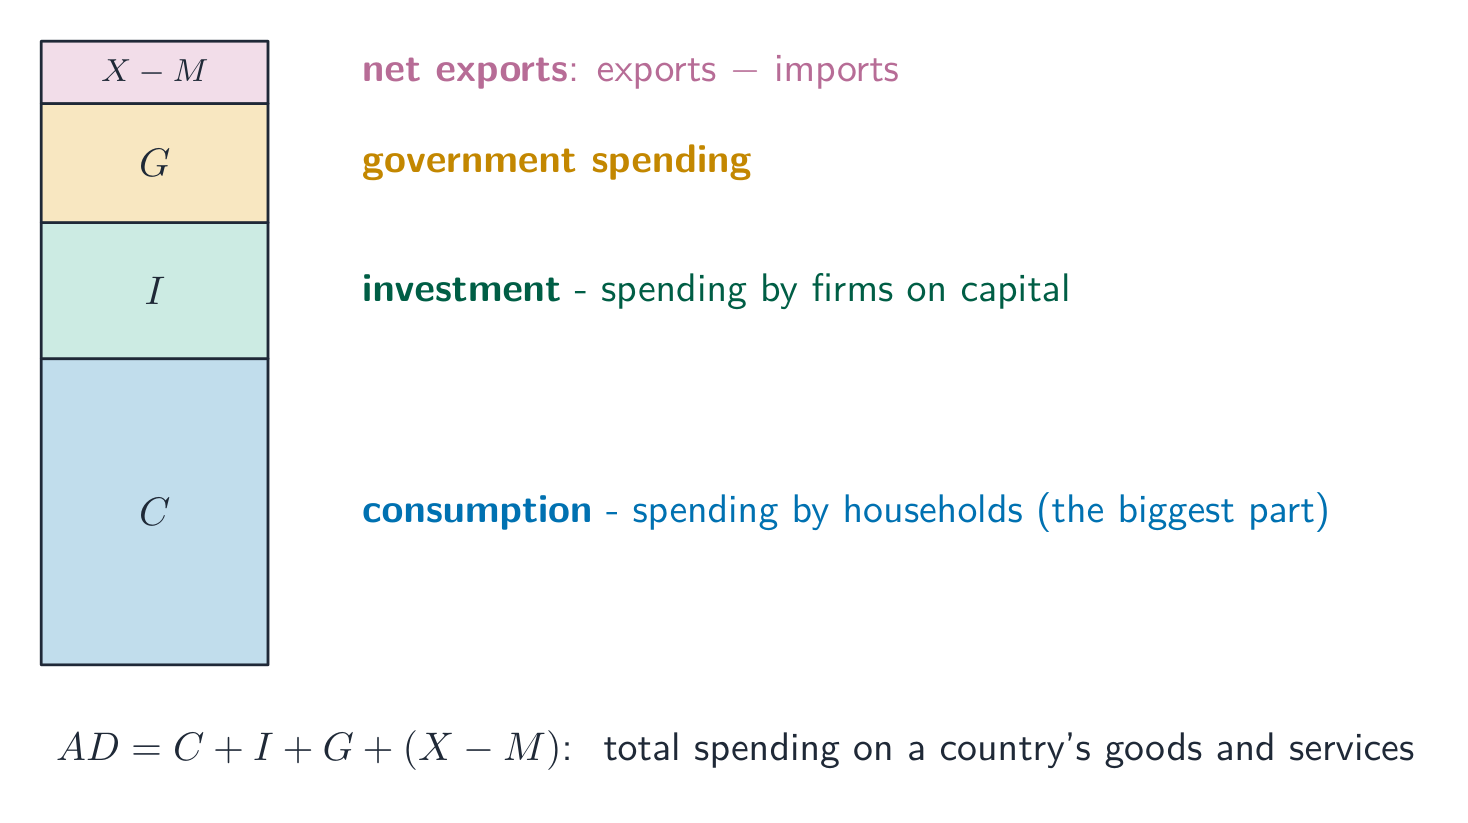
aggregate demand 总需求 (AD) is the total spending on a country's goods and services at each price level. It has four parts:
$$AD = C + I + G + (X - M)$$
C is consumption 消费 — spending by households.
I is investment — spending by firms on capital.
G is government spending.
(X − M) is net exports 净出口 — exports minus imports.
Aggregate demand is total spending: consumption, investment, government spending and net exports
The AD curve slopes downward: a lower price level means higher real spending, so a greater real output is demanded. AD shifts when any of its four parts changes (for example, a tax cut raises C).
Aggregate supply
aggregate supply 总供给 (AS) is the total output firms are willing to make at each price level.
short-run aggregate supply 短期总供给 (SRAS) slopes upward. In the short run, higher prices make production more profitable, so firms supply more. SRAS shifts when costs change (wages, raw materials, taxes).
long-run aggregate supply 长期总供给 (LRAS) shows the economy's full productive capacity 生产能力. It shifts only when the quantity or quality of factors changes.
Macroeconomic equilibrium
macroeconomic equilibrium 宏观经济均衡 is where AD crosses AS. It sets the price level 价格水平 and the real output 实际产出 of the economy. A shift in AD or AS changes both.
Equilibrium sets the price level $P$ and real output $Y$ where AD meets short-run AS; vertical LRAS marks full capacity.
Explore · Исследовать
Aggregate demand & supply · Агрегированный спрос и предложение
AD and AS cross at the price level and national output. · AD и AS пересекаются по уровню цен и национальному объему выпуска.
distinguish actual and potential growth and explain the causes of economic growth
explain the costs and benefits of economic growth and the business (trade) cycle
Русский
различать фактический и потенциальный рост и объяснять причины экономического роста
объяснить издержки и выгоды экономического роста и деловой (торговый) цикл
Source: Cambridge International syllabus · Источник: Программа Cambridge International
economic growth 经济增长 is a rise in a country's real output (real GDP) over time.
actual growth 实际增长 is the rise in output that really happens (a movement to a point further out, or from inside the LRAS towards it).
potential growth 潜在增长 is the rise in the economy's capacity (the LRAS shifting outward).
Growth is caused by more or better factors of production: a bigger or more skilled workforce, more investment in capital, new technology, and higher productivity 生产率 (output per worker).
The business cycle
Real output does not grow smoothly. The business cycle 经济周期 (also called the trade cycle) is the up-and-down pattern of output over the years. It has four phases: boom 繁荣 (fast growth), recession 衰退 (falling output), slump 萧条 (the low point), and recovery 复苏.
Real GDP swings through boom, recession, slump and recovery around its rising long-run trend.
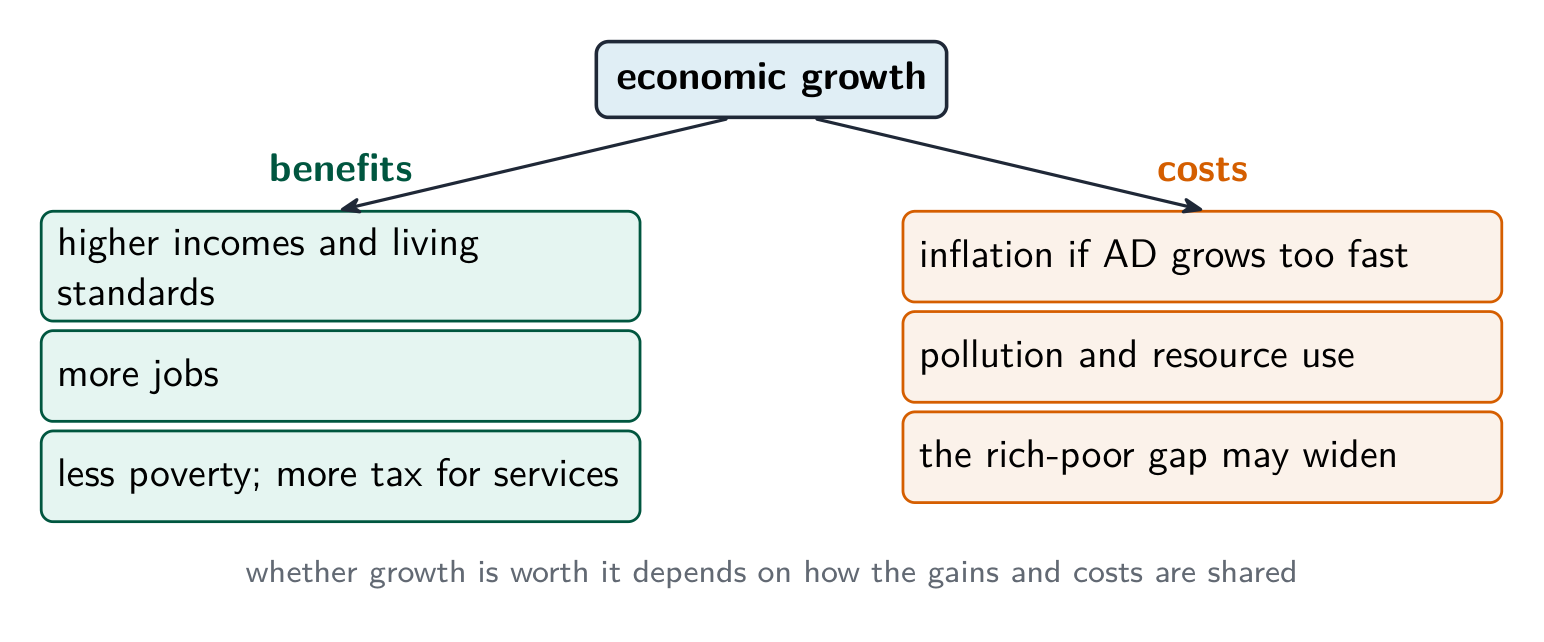
Costs and benefits of growth
Benefits
Costs
higher incomes and living standards
can cause inflation if AD grows too fast
more jobs
pollution and use of resources
less poverty; more tax for public services
the gap between rich and poor may widen
Economic growth brings higher incomes and jobs, but can bring inflation, pollution and inequality
Explore · Исследовать
Economic growth shifts the frontier out · Экономический рост смещает границу наружу
Growth means the economy can produce more of BOTH goods — the whole frontier moves outward as resources or technology improve. · Рост означает, что экономика может производить больше ОБОИХ благ — вся граница смещается наружу при улучшении ресурсов или технологий.
define and measure unemployment (claimant count and labour force survey)
explain the types and causes of unemployment (frictional, structural, cyclical, seasonal) and its consequences
Русский
определить и измерить безработицу (учет получателей пособий и опрос рабочей силы)
объяснить виды и причины безработицы (фрикционная, структурная, циклическая, сезонная) и её последствия
Source: Cambridge International syllabus · Источник: Программа Cambridge International
unemployment 失业 means people who are able and willing to work, and are looking for a job, but cannot find one.
Measuring unemployment
the claimant count 申领救济人数 counts only people claiming unemployment benefits. It is cheap but misses those who do not claim.
the labour force survey 劳动力调查 asks a large sample whether they are working or seeking work. It follows an international standard, so it is better for comparing countries. The labour force 劳动力 is everyone working or looking for work.
Two ways to count the unemployed - and what each one misses
Types and causes
frictional unemployment 摩擦性失业 — short-term, while people move between jobs.
structural unemployment 结构性失业 — when an industry declines and workers' skills no longer match the jobs available.
cyclical unemployment 周期性失业 — caused by low AD in a recession. This is usually the largest type.
seasonal unemployment 季节性失业 — when work is only available at certain times of the year (such as farming or tourism).
Three types of unemployment: frictional, structural and cyclical
Consequences
Unemployment wastes output (the economy produces inside its PPC), lowers incomes, and costs the government (more benefits, less tax). It also harms families and can raise crime and ill health.
Explore · Исследовать
Unemployment in the labour market · Безработица на рынке труда
If the wage is stuck ABOVE the equilibrium, more workers want jobs than firms will hire — that gap is unemployment. · Если зарплата застряла ВЫШЕ равновесной, больше работников хотят работать, чем готовы нанять фирмы — эта разница есть безработица.
define inflation, deflation and disinflation and explain how the price level is measured
explain the causes (demand-pull and cost-push) and consequences of inflation and deflation
Русский
определить инфляцию, дефляцию и дезинфляцию и объяснить, как измеряется ценовой уровень
объяснить причины (спроса и издержек) и последствия инфляции и дефляции
Source: Cambridge International syllabus · Источник: Программа Cambridge International
Inflation, deflation and disinflation
inflation 通货膨胀 is a sustained rise in the general price level. Money then buys less, so its purchasing power 购买力 falls.
deflation 通货紧缩 is a sustained fall in the general price level.
disinflation 反通货膨胀 is when inflation is still positive but is slowing down (prices rise, but more slowly).
Inflation is measured from the price of a basket of everyday goods like these.
The price level is measured with the consumer price index 消费者价格指数 (CPI). A typical household's spending is used to build a "basket" of goods. Each good is given a weight 权重 for how much is spent on it, and the change in the basket's cost from year to year is the inflation rate:
$$\text{inflation rate} = \frac{\text{change in index}}{\text{starting index}} \times 100\%.$$
Worked example. A country's CPI rises from $100$ to $104$ over one year, then to $107$ the year after. Find the inflation rate in each year.
Year 1: $\dfrac{104 - 100}{100} \times 100\% = 4\%$. Year 2: $\dfrac{107 - 104}{104} \times 100\% = 2.9\%$.
Notice that prices are still rising in year 2, just more slowly — this fall in the inflation rate (from $4\%$ to $2.9\%$) is disinflation, not deflation.
Worked example. A worker's wage rises from $\text{\pounds} 500$ to $\text{\pounds} 520$ a week (a $4\%$ rise) while the CPI rises by $4\%$. What happens to the real wage?
Money (nominal) pay is up $4\%$, but prices are also up $4\%$, so the real wage — what the pay can actually buy — is unchanged. A pay rise only raises living standards if it beats inflation.
Causes of inflation
demand-pull inflation 需求拉动型通货膨胀 — AD rises faster than AS, so "too much money chases too few goods".
cost-push inflation 成本推动型通货膨胀 — firms' costs rise (wages or raw materials), so they raise prices, shifting SRAS to the left.
Demand-pull inflation comes from AD shifting right; cost-push inflation comes from SRAS shifting left. Both raise the price level.
Consequences
Inflation lowers purchasing power, especially for people on fixed incomes. It creates uncertainty, can make a country's exports dearer, and helps borrowers but harms savers. Deflation sounds good but can be harmful: people delay buying (waiting for lower prices), so AD falls, firms cut output, and unemployment rises.
Explore · Исследовать
Aggregate demand and supply · Агрегированный спрос и предложение
The overall price level sits where aggregate demand meets aggregate supply — a shock to either moves prices and output. · Общий уровень цен находится там, где aggregate demand встречается с aggregate supply — шок любого из них сдвигает цены и выпуск.
state the macroeconomic policy objectives: stable low inflation, full employment, economic growth, balance of payments stability, redistribution of income
explain potential conflicts between objectives
Русский
назвать цели макроэкономической политики: стабильная низкая инфляция, полная занятость, экономический рост, стабильность платежного баланса, перераспределение доходов
объяснить возможные конфликты между целями
Source: Cambridge International syllabus · Источник: Программа Cambridge International
English
A government usually has five main aims:
price stability 物价稳定 — low and steady inflation 通货膨胀 (often a target of about 2% a year).
full employment 充分就业 — jobs for almost everyone who wants to work.
economic growth 经济增长 — a rising real output over time.
balance of payments 国际收支 stability — not importing far more than the country exports for years on end.
redistribution of income 收入再分配 — narrowing the gap between rich and poor.
Conflicts between objectives
The aims can conflict 冲突 — reaching one can hurt another:
growth versus inflation: fast growth raises aggregate demand 总需求, which can pull prices up.
growth versus the balance of payments: as incomes rise, people buy more imports, worsening the trade balance.
unemployment versus inflation: cutting unemployment by raising demand can cause more inflation.
growth versus the environment: more output often means more pollution.
The government has three sets of tools. Fiscal and monetary policy are demand-side policies 需求侧政策 (they work on AD). Supply-side policy works on aggregate supply 总供给.
Русский
Обычно у правительства есть пять основных целей:
стабильность цен — низкая и устойчивая инфляция (часто целевой показатель составляет около 2% в год).
полная занятость — работа для почти каждого, кто хочет трудиться.
экономический рост — рост реального объема выпуска во времени.
стабильность платежного баланса — отсутствие многолетней зависимости от импорта, превышающего экспорт страны.
перераспределение доходов — сокращение разрыва между богатыми и бедными.
Конфликты между целями
Цели могут конфликтовать — достижение одной может навредить другой:
рост против инфляции: быстрый рост повышает совокупный спрос, что может толкать цены вверх.
рост против платежного баланса: по мере роста доходов люди покупают больше импортных товаров, ухудшая торговый баланс.
безработица против инфляции: снижение безработицы за счет повышения спроса может вызвать более высокую инфляцию.
рост против экологии: увеличение объема производства часто означает больше загрязнений.
Стремление к быстрому росту может конфликтовать со стабильностью цен, платежным балансом и экологией
У правительства есть три набора инструментов. Фискальная и монетарная политика являются политикой совокупного спроса (они воздействуют на AD). Политика侧 совокупного предложения воздействует на совокупное предложение.
Фискальная и монетарная политика воздействуют на совокупный спрос; политика侧 совокупного предложения воздействует на совокупное предложение
explain fiscal policy (government spending and taxation) and the budget balance
distinguish direct and indirect taxes and progressive, proportional and regressive taxes
explain the use and effectiveness of fiscal policy
Русский
объяснить фискальную политику (государственные расходы и налогообложение) и бюджетный баланс
различать прямые и косвенные налоги, а также прогрессивные, пропорциональные и регрессивные налоги
объяснить использование и эффективность фискальной политики
Source: Cambridge International syllabus · Источник: Программа Cambridge International
English
fiscal policy 财政政策 is the use of government spending and taxation to influence the economy.
The budget 预算 compares the two:
a budget deficit 预算赤字 is when spending is greater than tax revenue. The government must borrow, adding to the national debt 国债.
a budget surplus 预算盈余 is when tax revenue is greater than spending.
Types of tax
a direct tax 直接税 is paid straight to the government on income or profit (income tax, corporation tax).
an indirect tax 间接税 is a tax on spending (added to the price of goods).
Taxes are also grouped by how the rate changes with income:
Type
How it works
progressive tax 累进税
the rate rises as income rises (the rich pay a larger share)
proportional tax 比例税
the rate stays the same at every income
regressive tax 累退税
the rate falls as income rises (the poor pay a larger share)
Using fiscal policy
expansionary 扩张性 fiscal policy raises government spending or cuts taxes. This raises AD, to fight a recession and unemployment.
contractionary 紧缩性 fiscal policy cuts spending or raises taxes. This lowers AD, to fight inflation.
Effectiveness. Fiscal policy can act fast on AD, but it has problems: time lags (a budget is set once a year), large deficits and debt, and crowding out 挤出效应 — when heavy government borrowing pushes up interest rates and reduces private investment.
Русский
фискальная политика — это использование государственных расходов и налогов для воздействия на экономику.
Правительства используют фискальную политику — государственные расходы и налогообложение, устанавливаемые через законодательный орган — для управления экономикой.
Бюджет сравнивает эти два показателя:
бюджетный дефицит возникает, когда расходы превышают налоговые поступления. Правительство должно занимать средства, увеличивая государственный долг.
бюджетный профицит возникает, когда налоговые поступления превышают расходы.
Виды налогов
прямой налог уплачивается непосредственно правительству с дохода или прибыли (налог на доходы физических лиц, корпоративный налог).
косвенный налог — это налог на потребление (добавляется к цене товаров).
Налоги также группируются по тому, как ставка меняется в зависимости от дохода:
Тип
Как работает
прогрессивный налог
ставка растет при росте дохода (богатые платят большую долю)
пропорциональный налог
ставка остается неизменной при любом доходе
регрессивный налог
ставка снижается при росте дохода (бедные платят большую долю)
При прогрессивном налоге средняя ставка растет вместе с доходом; при пропорциональном она остается неизменной; при регрессивном снижается.
Использование фискальной политики
экспансионистская фискальная политика увеличивает государственные расходы или снижает налоги. Это повышает AD, чтобы преодолеть рецессию и безработицу.
контракционистская фискальная политика сокращает расходы или повышает налоги. Это снижает AD, чтобы бороться с инфляцией.
Экспансионистская фискальная или монетарная политика смещает AD вправо, повышая выпуск и уровень цен; контракционистская политика делает обратное.
Эффективность. Фискальная политика может быстро воздействовать на AD, но имеет недостатки: временные лаги (бюджет утверждается раз в год), большие дефициты и долги, а также «вытеснение» — когда масштабные заимствования государства повышают процентные ставки и снижают частные инвестиции.
Explore · Исследовать
Fiscal policy shifts AD · Фискальная политика сдвигает совокупный спрос
Government spending and taxes move aggregate demand (AD). Drag AD to see real output and the price level change. · Государственные расходы и налоги изменяют совокупный спрос (AD). Перетащите AD, чтобы увидеть изменение реального выпуска и уровня цен.
explain monetary policy (interest rates, money supply, exchange rate) and the role of the central bank
explain the transmission mechanism and the effectiveness of monetary policy
Русский
объяснить денежно-кредитную политику (процентные ставки, денежная масса, обменный курс) и роль центрального банка
объяснить механизм передачи и эффективность денежно-кредитной политики
Source: Cambridge International syllabus · Источник: Программа Cambridge International
English
monetary policy 货币政策 is run by the central bank 中央银行. Its main tool is the interest rate 利率, but it can also change the money supply 货币供给 or influence the exchange rate 汇率.
The transmission mechanism
The transmission mechanism 传导机制 is how a change in the interest rate reaches the wider economy. If the central bank raises the interest rate:
borrowing becomes dearer, so households and firms spend and invest less.
saving is rewarded, so people spend less.
the currency tends to rise, so exports fall.
All of these lower AD, which slows inflation. A cut in the interest rate does the opposite, raising AD.
Effectiveness. Monetary policy is flexible (the rate can change at any time), but it works with a time lag of a year or more. In a deep slump, even very low rates may not make worried firms and households borrow.
Русский
монетарная политика осуществляется центральным банком. Ее главный инструмент — процентная ставка, но она также может менять денежную массу или влиять на валютный курс.
Центральный банк, такой как Банк Англии, устанавливает процентную ставку — главный инструмент монетарной политики.
Механизм передачи
Механизм передачи — это то, как изменение процентной ставки влияет на всю экономику. Если центральный банк повышает процентную ставку:
займы становятся дороже, поэтому домохозяйства и фирмы тратят и инвестируют меньше.
сбережения поощряются, поэтому люди тратят меньше.
валюта, как правило, укрепляется, поэтому экспорт снижается.
Все это снижает AD, что замедляет инфляцию. Снижение процентной ставки приводит к обратному эффекту, повышая AD.
Повышение процентной ставки воздействует через три канала, снижая потребление, инвестиции и экспорт, уменьшая AD и замедляя инфляцию.
Эффективность. Монетарная политика гибка (ставку можно изменить в любой момент), но она действует с временным лагом в год или более. В глубокой спаде даже очень низкие ставки могут не побудить обеспокоенные фирмы и домохозяйства брать кредиты.
Explore · Исследовать
Monetary policy shifts AD · Денежно-кредитная политика сдвигает совокупный спрос
Changing interest rates moves aggregate demand. Lower rates → more borrowing and spending → AD shifts right. · Изменение процентных ставок влияет на совокупный спрос. Снижение ставок → больше заимствований и расходов → AD сдвигается вправо.
explain supply-side policies (market-based and interventionist: education and training, incentives, privatisation, deregulation, infrastructure)
explain the use and effectiveness of supply-side policy
Русский
объяснить политики со стороны предложения (рыночные и интервенционистские: образование и обучение, стимулы, приватизация, дерегулирование, инфраструктура)
объяснить использование и эффективность политики со стороны предложения
Source: Cambridge International syllabus · Источник: Программа Cambridge International
English
supply-side policy 供给侧政策 tries to raise the economy's productive capacity 生产能力 — to shift long-run aggregate supply to the right. It aims to make markets work better and raise productivity 生产率.
There are two kinds.
Market-based policies let markets work more freely:
cutting income tax and benefits to strengthen the incentive 激励 to work.
privatisation 私有化 — selling state firms to private owners, who run them for profit.
deregulation 放松管制 — removing rules that block competition.
Interventionist policies use the government directly:
spending on education and training 培训 to raise workers' skills.
spending on infrastructure 基础设施 — roads, ports and broadband.
support for research and new technology.
Effectiveness. Supply-side policy is powerful because it can raise growth and lower inflation at the same time, with no trade-off. But it is slow (education takes years to pay off), costly, and some measures, like cutting benefits, can widen inequality.
Worked example. An economy is in a deep recession with a large output gap, and interest rates are already near zero. Which policy should the government use, and why is the other one weak here? Monetary policy is weak: with the base rate already near zero there is almost no room to cut further, and even cheap credit will not make firms invest when they expect no demand. Fiscal policy is stronger: government spending raises aggregate demand directly, without waiting for anyone to choose to borrow, and the multiplier means each pound spent raises national income by more than a pound as it is re-spent. Weigh the costs against it - a bigger budget deficit and rising debt, plus time lags on large projects. Match the policy to the constraint named in the question: here it is the zero lower bound, and that is precisely what makes fiscal policy the answer.
Русский
структурная (предложения侧) политика направлена на повышение производственного потенциала экономики — сдвиг долгосрочного совокупного предложения вправо. Она призвана сделать рынки более эффективными и повысить производительность труда.
Структурная (предложения侧) политика повышает потенциал, смещая LRAS вправо: реальный выпуск растет, а уровень цен снижается — рост при более низкой инфляции.
Существует два вида.
Рыночные политики обеспечивают более свободное функционирование рынков:
снижение подоходного налога и пособий для усиления стимула к труду.
приватизация — продажа государственных компаний частным владельцам, которые управляют ими в целях получения прибыли.
Интервенционистские политики используют прямое участие государства:
расходы на образование и подготовку для повышения квалификации работников.
расходы на инфраструктуру — дороги, порты и широкополосный интернет.
поддержка исследований и новых технологий.
Эффективность. Политики предложения эффективны тем, что могут одновременно повышать рост и снижать инфляцию без компромисса. Однако они требуют много времени (образование окупается годами), обходятся дорого, а некоторые меры, такие как сокращение пособий, могут увеличить неравенство.
Разобраный пример. Экономика находится в глубокой рецессии с большим разрывом выпуска, а процентные ставки уже близки к нулю. Какую политику следует использовать правительству и почему другая здесь слаба? Монетарная политика слаба: при ставке базовой ставке, близкой к нулю, практически нет пространства для дальнейшего снижения, и даже дешевые кредиты не заставят компании инвестировать, если они не ожидают спроса. Фискальная политика сильнее: государственные расходы увеличивают совокупный спрос напрямую, без ожидания решения кого-либо занимать средства, а мультипликатор означает, что каждый потраченный фунт увеличивает национальный доход более чем на один фунт по мере его повторного расходования. Оцените затраты — больший бюджетный дефицит и растущий долг, а также временные лаги при реализации крупных проектов. Соотнесите политику с ограничением, упомянутым в вопросе: здесь это нулевая нижняя граница, и именно она делает фискальную политику ответом.
Explore · Исследовать
Supply-side policy shifts AS · Предложение侧ная политика сдвигает совокупное предложение
Supply-side policies raise the economy's productive capacity — aggregate supply (AS) shifts right, lowering the price level at higher output. · Предложение侧ные политики повышают производительный потенциал экономики — совокупное предложение (AS) сдвигается вправо, снижая уровень цен при более высоком выпуске.
Match a policy to an objective: fiscal and monetary policy act on demand; supply-side policy raises long-run capacity.
Explain how a change in interest rates works through AD, and fiscal policy through $G$ and $T$.
Evaluate policy with time lags, side effects and conflicts between objectives.
Supply-side measures (education, tax incentives) are long-run and slow to work.
Русский
Подобрать политику к цели: фискальная и монетарная политика воздействуют на спрос; политика предложения повышает долгосрочную производственную мощность.
Объяснить, как изменение процентных ставок влияет через совокупный спрос (AD), а фискальная политика — через $G$ и $T$.
Оценить политику с учетом временных лагов, побочных эффектов и конфликтов между целями.
Меры предложения (образование, налоговые льготы) рассчитаны на долгосрочный эффект и действуют медленно.
explain absolute and comparative advantage and the gains from specialisation and trade
explain the terms of trade and the benefits and limitations of trade theory
Русский
объяснить абсолютное и сравнительное преимущество и выгоды от специализации и торговли
объяснить условия торговли и преимущества и ограничения теории торговли
Source: Cambridge International syllabus · Источник: Программа Cambridge International
English
international trade 国际贸易 lets countries buy and sell with each other. Trade lets each country specialise 专业化 in what it makes best, so the world makes more in total.
Absolute and comparative advantage
a country has an absolute advantage 绝对优势 in a good if it can make more of it with the same resources than another country.
a country has a comparative advantage 比较优势 in a good if it can make it at a lower opportunity cost 机会成本 than another country.
Comparative advantage is the key idea: a country should make the goods it gives up least to produce, and trade for the rest. Look at this example, where each country uses the same resources:
Country
Wine (units)
Cloth (units)
Country A
20
10
Country B
5
5
Country A is better at both (absolute advantage in both). But think about opportunity cost:
in A, making 1 cloth means giving up 2 wine.
in B, making 1 cloth means giving up 1 wine.
So B gives up less to make cloth — B has the comparative advantage in cloth. A has it in wine. If A makes only wine and B makes only cloth, and they trade, both can end up with more than before.
Terms of trade
The terms of trade 贸易条件 measure the price of a country's exports compared with the price of its imports. It is worked out as an index:
$$\text{terms of trade} = \frac{\text{index of export prices}}{\text{index of import prices}} \times 100.$$
If export prices rise faster than import prices, the terms of trade "improve" — the country can buy more imports for the same exports.
Worked example. Over a year, a country's export price index rises from $100$ to $110$, while its import price index rises from $100$ to $105$. Find the new terms of trade.
$$\text{terms of trade} = \frac{110}{105} \times 100 = 104.8.$$
The figure is above $100$, so the terms of trade have improved: each unit of exports now buys about $4.8\%$ more imports than before.
Limits of the theory
The gains are real, but the simple theory assumes no transport costs, no trade barriers, and that costs do not change with output. In the real world these do not fully hold, and specialising in one good is risky if its price falls.
Русский
Международная торговля позволяет странам покупать и продавать друг у друга. Торговля дает каждой стране возможность специализироваться на том, что производится лучше всего, так что общий мировой выпуск увеличивается.
Контейнерный порт: международная торговля перемещает товары между странами в огромных объемах
Абсолютное и сравнительное преимущество
Страна имеет абсолютное преимущество в товаре, если может произвести больше его при тех же ресурсах, чем другая страна.
Страна имеет сравнительное преимущество в товаре, если может производить его при более низких альтернативных издержках, чем другая страна.
Сравнительное преимущество — ключевая идея: страна должна производить товары, от производства которых ей приходится отказываться меньше всего, а остальное закупать. Посмотрите на этот пример, где каждая страна использует одинаковые ресурсы:
Страна
Вино (ед.)
Ткань (ед.)
Страна A
20
10
Страна B
5
5
Страна A лучше справляется с обоими товарами (абсолютное преимущество в обоих). Но подумайте об альтернативных издержках:
в A производство 1 единицы ткани требует отказа от 2 единиц вина.
в B производство 1 единицы ткани требует отказа от 1 единицы вина.
Таким образом, B отказывается от меньшего ради производства ткани — у B есть сравнительное преимущество в ткани. У A оно есть в вине. Если A производит только вино, а B — только ткань, и они торгуют, обе стороны могут оказаться в выигрыше по сравнению с предыдущим положением.
У Страны A можно произвести больше обоих товаров, но ее PPC круче: она жертвует 2 единицами вина за единицу ткани, тогда как B жертвует лишь 1, поэтому у B есть сравнительное преимущество в ткани.
Условия торговли
Условия торговли измеряют цену экспорта страны по сравнению с ценой ее импорта. Они рассчитываются в виде индекса:
$$\text{terms of trade} = \frac{\text{index of export prices}}{\text{index of import prices}} \times 100.$$
Если цены на экспорт растут быстрее, чем цены на импорт, условия торговли «улучшаются» — страна может купить больше импорта за тот же объем экспорта.
Разобраный пример. За год индекс цен на экспорт страны вырос с $100$ до $110$, а индекс цен на импорт — с $100$ до $105$. Найдите новые условия торговли.
$$\text{terms of trade} = \frac{110}{105} \times 100 = 104.8.$$
Полученное значение выше $100$, значит, условия торговли улучшились: теперь одна единица экспорта покупает примерно $4.8\%$ единиц импорта больше, чем прежде.
Ограничения теории
Выгоды реальны, но простая теория предполагает отсутствие транспортных расходов, торговых барьеров и неизменности издержек при изменении объема выпуска. В реальном мире эти предположения не всегда верны, а специализация на одном товаре несет риски при падении его цены.
Explore · Исследовать
Why countries trade
Each country specialises where its opportunity cost is lowest, then trades — both can consume beyond their own frontier.
объяснить аргументы «за» и «против» протекционизма и его влияние на заинтересованные стороны
Source: Cambridge International syllabus · Источник: Программа Cambridge International
English
protectionism 贸易保护主义 means a government protecting home producers from foreign competition. The main tools:
a tariff 关税 — a tax on imports, which raises their price.
a quota 配额 — a legal limit on the quantity of a good that may be imported.
a subsidy 补贴 to home producers, so they can sell more cheaply than foreign rivals.
an embargo 禁运 — a complete ban on trade with a country or in a good.
administrative barriers 行政壁垒 — extra paperwork and tough standards that make importing hard.
For and against
Arguments for protection include protecting an infant industry 幼稚产业 (a young industry that needs time to grow), saving jobs, and stopping dumping 倾销 (foreign firms selling below cost to destroy local rivals).
Arguments against are strong: protection raises prices for consumers, protects weak firms so they stay inefficient, and can lead to retaliation 报复 — other countries hitting back with their own barriers.
Effects on stakeholders
A tariff affects each stakeholder 利益相关者 differently: home producers gain, the government gains tariff revenue, but consumers lose (higher prices, less choice) and foreign producers lose sales.
Русский
Протекционизм означает защиту государстваColors домашних производителей от иностранной конкуренции. Основные инструменты:
Три инструмента протекционизма: тарифы, квоты и субсидии
тариф — налог на импорт, который повышает его цену.
квота — законодательное ограничение количества товара, которое может быть ввезено.
субсидия отечественным производителям, позволяющая им продавать дешевле иностранных конкурентов.
эмбарго — полный запрет на торговлю с определенной страной или в отношении определенного товара.
Тариф повышает цену с уровня мировой цены до «мировая цена + тариф»: внутренний объем предложения растет, спрос падает, а импорт сокращается; заштрихованный прямоугольник представляет собой доходы государства от тарифа.
За и против
Аргументы за защиту включают поддержку младшей отрасли (молодой отрасли, которой нужно время для роста), сохранение рабочих мест и предотвращение демпинга (когда иностранные компании продают товары ниже себестоимости, чтобы уничтожить местных конкурентов).
Аргументы против также сильны: защита повышает цены для потребителей, сохраняет слабые компании, из-за чего они остаются неэффективными, а также может привести к взаимным ответным мерам — другим странам вводят собственные торговые барьеры.
Влияние на заинтересованные стороны
Таможня по-разному влияет на каждого заинтересованного участника: отечественные производители выигрывают, государство получает таможенные доходы, но потребители теряют (выше цены, меньше выбора), а иностранные производители снижают объемы продаж.
Explore · Исследовать
Protectionism in the market
A tariff or quota shifts effective supply and raises the domestic price, protecting home producers but costing consumers. Shift the lines to see it.
describe the structure of the balance of payments and the components of the current account (trade in goods and services, primary and secondary income)
explain the causes and consequences of current account deficits and surpluses
Русский
описать структуру платежного баланса и компоненты текущего счета (торговля товарами и услугами, первичный и вторичный доход)
объяснить причины и последствия дефицита и профицита текущего счета
Source: Cambridge International syllabus · Источник: Программа Cambridge International
English
The balance of payments 国际收支 is a record of all money flows between one country and the rest of the world. Its most-studied part is the current account 经常账户, which has four parts:
trade in goods 货物贸易 — exports and imports of physical goods.
trade in services 服务贸易 — exports and imports of services (tourism, banking).
primary income 初次收入 — income from work and investment abroad (wages, profit, interest).
secondary income 二次收入 — transfers with nothing given back, like foreign aid.
A current account deficit 经常账户赤字 means a country buys more from abroad than it sells. A current account surplus 经常账户盈余 is the opposite. A long deficit can mean rising debt to other countries; a large surplus can mean the country saves a lot but consumes little.
Русский
Баланс платежей — это запись всех денежных потоков между одной страной и остальным миром. Наиболее изучаемая его часть — текущий счет, который состоит из четырех компонентов:
торговля товарами — экспорт и импорт физических товаров.
торговля услугами — экспорт и импорт услуг (туризм, банковское дело).
первичный доход — доход от работы и инвестиций за рубежом (зарплаты, прибыль, проценты).
вторичный доход — трансферты без встречных обязательств, такие как иностранная помощь.
Текущий счет суммирует четыре потока: торговлю товарами и услугами, плюс первичный доход (от работы и инвестиций) и вторичный доход (трансферты)
Дефицит текущего счета означает, что страна покупает больше у других, чем продает. Профицит текущего счета — обратная ситуация. Длительный дефицит может указывать на рост долгов перед другими странами; большой профицит может означать, что страна много сберегает, но мало потребляет.
Explore · Исследовать
Current account flow
Track exports, imports and income flows into the current account.
explain the determination of floating exchange rates by demand and supply of currency, and fixed and managed systems
explain the causes and effects of appreciation and depreciation on the economy
Русский
объяснить определение плавающих валютных курсов спросом и предложением валюты, а также фиксированных и управляемых систем
объяснить причины и эффекты укрепления и ослабления валюты для экономики
Source: Cambridge International syllabus · Источник: Программа Cambridge International
English
Exchange rates: appreciation
An exchange rate 汇率 is the price of one currency in terms of another. There are three main systems.
a floating exchange rate 浮动汇率 is set freely by the demand for and supply of the currency. If more people want a currency (to buy its exports), its value rises.
a fixed exchange rate 固定汇率 is held at a set value by the central bank, which buys and sells the currency to keep it there.
a managed exchange rate 管理浮动汇率 mostly floats, but the central bank steps in now and then to steady it.
Appreciation and depreciation
Under floating rates:
appreciation 升值 is a rise in the currency's value. Exports become dearer for foreigners, and imports become cheaper.
depreciation 贬值 is a fall in the currency's value. Exports become cheaper, and imports become dearer.
A depreciation can therefore raise export sales and cut imports, helping the current account — but it can also raise inflation, because imports cost more.
Worked example. Suppose the exchange rate is $\text{\pounds} 1 = \$1.40$.
A UK exporter's $\text{\pounds} 200$ machine costs an American buyer $\text{\pounds} 200 \times 1.40 = \$280$. If the pound then appreciates to $\text{\pounds} 1 = \$1.60$, the same machine costs $\text{\pounds} 200 \times 1.60 = \$320$ — dearer for the American, so fewer are sold. Going the other way, a $\$700$ invoice from a US supplier costs a UK firm $\$700 \div 1.40 = \text{\pounds} 500$.
Русский
Валютные курсы: укрепление валюты
Валютный курс — это цена одной валюты относительно другой. Существует три основные системы.
Бюро обмена валют: валютный курс — это цена одной валюты относительно другой.
плавающий валютный курс устанавливается свободно под воздействием спроса и предложения на валюту. Если больше людей хотят получить валюту (чтобы купить ее экспорт), ее стоимость растет.
фиксированный валютный курс поддерживается на заданном уровне центральным банком, который покупает и продает валюту, чтобы сохранить эту цену.
управляемый валютный курс в основном плавающий, но центральный банк время от времени вмешивается, чтобы стабилизировать его.
Плавающий валютный курс устанавливается там, где спрос на валюту встречается с предложением. Рост спроса на фунты ($D \to D_1$) повышает курс — это укрепление.
Укрепление и ослабление валюты
При плавающих курсах:
укрепление — это рост стоимости валюты. Экспорт становится дороже для иностранцев, а импорт — дешевле.
ослабление — это снижение стоимости валюты. Экпорт становится дешевле, а импорт — дороже.
Поэтому ослабление может увеличить экспорт и сократить импорт, помогая текущему счету, но оно также может повысить инфляцию, так как импорт становится дороже.
Разобранное решение. Предположим, обменный курс составляет $\text{\pounds} 1 = \$1.40$.
Машина британского экспортера стоимостью $\text{\pounds} 200$ стоит американскому покупателю $\text{\pounds} 200 \times 1.40 = \$280$. If the pound then appreciates to $\text{\pounds} 1 = \$1.60$; та же машина от американского поставщика стоит британской компании $\text{\pounds} 200 \times 1.60 = \$320$ — dearer for the American, so fewer are sold. Going the other way, a $\$700$ счет, что эквивалентно $\$700 \div 1.40 = \text{\pounds} 500$.
Explore · Исследовать
The foreign-exchange market
A currency has its own market. More demand for £ (or less supply) pushes the exchange rate up — it appreciates.
Correcting a current account deficit · Корректировка дефицита текущего счета
Syllabus · Программа
English
explain expenditure-switching and expenditure-reducing policies and supply-side measures to correct a deficit
evaluate the effectiveness of these policies
Русский
объяснить политику переключения расходов и политику сокращения расходов, а также меры со стороны предложения для устранения дефицита
оценить эффективность этих политик
Source: Cambridge International syllabus · Источник: Программа Cambridge International
English
A government can use three kinds of policy to cut a deficit:
expenditure-reducing 支出减少 policies lower total demand (higher taxes or interest rates), so people buy fewer imports. But they also slow growth and raise unemployment.
expenditure-switching 支出转换 policies move spending away from imports towards home goods (a tariff, or a lower exchange rate). But they can cause retaliation or inflation.
supply-side policies raise the competitiveness 竞争力 of home firms (better skills and technology), so exports rise. These work best in the long run but are slow.
Русский
Правительство может использовать три вида политики для сокращения дефицита:
политика снижения расходов снижает совокупный спрос (повышение налогов или процентных ставок), поэтому люди покупают меньше импорта. Но она также замедляет рост и повышает безработицу.
политика перераспределения расходов смещает траты с импорта на отечественные товары (таможенная пошлина или более низкий валютный курс). Но она может вызвать ответные меры или инфляцию.
политика со стороны предложения повышает конкурентоспособность отечественных компаний (лучшие навыки и технологии), поэтому экспорт растет. Эти меры наиболее эффективны в долгосрочной перспективе, но требуют времени.
Торговые потоки на контейнерном терминале: дефицит текущего счета означает, что импорт товаров и услуг превышает экспорт
Explore · Исследовать
Current account flow
Track exports, imports and income flows into the current account.
Explain comparative advantage through opportunity cost (specialise where you give up least) and state its assumptions and limits.
Evaluate protectionism (tariffs, quotas): it can protect jobs but raises prices and risks retaliation.
Read the balance of payments (the current account covers trade, income and transfers).
A depreciation makes exports cheaper and imports dearer, helping the current account only if demand is elastic enough (Marshall-Lerner).
Русский
Объяснить сравнительное преимущество через альтернативную стоимость (специализироваться там, где вы жертвуете наименьшим) и указать его предпосылки и ограничения.
Оценить протекционизм (таможенные пошлины, квоты): он может защитить рабочие места, но повышает цены и несет риск ответных мер.
Прочитать данные о балансе платежей (текущий счет охватывает торговлю, доходы и трансферты).
Ослабление делает экспорт дешевле, а импорт дороже, помогая текущему счету только если спрос достаточно эластичен (условие Маршалла-Лернера).
This topic looks more deeply at consumers, costs and firms.
Русский
Эта тема рассматривает потребителей, издержки и компании более подробно.
7.1
Utility and consumer choice · Полезность и выбор потребителя
Syllabus · Программа
English
explain total and marginal utility and the law of diminishing marginal utility
derive the equi-marginal principle and explain how it relates to the demand curve, including the limitations of the marginal utility approach
Русский
объяснить общую и предельную полезность и закон убывающей предельной полезности
вывести принцип эквидаральности и объяснить его связь с кривой спроса, включая ограничения подхода предельной полезности
Source: Cambridge International syllabus · Источник: Программа Cambridge International
English
utility 效用 is the satisfaction a consumer gets from a good.
total utility 总效用 is the satisfaction from all the units consumed.
marginal utility 边际效用 is the extra satisfaction from one more unit.
The law of diminishing marginal utility 边际效用递减 says each extra unit gives less extra satisfaction. Total utility still rises, but more and more slowly.
The equi-marginal principle
A consumer with a fixed budget gets the most total utility when the last dollar spent on each good gives the same extra utility. This is the equi-marginal principle 等边际原则:
$$\frac{MU_A}{P_A} = \frac{MU_B}{P_B}$$
Because marginal utility falls as you buy more, you only buy extra units when the price falls. This is why the demand curve 需求曲线 slopes downward.
Limitations
The approach is hard to use in practice: utility cannot really be measured in numbers, and people do not calculate like this. It also ignores habit and advertising.
Русский
Полезность — это удовлетворение, которое потребитель получает от блага.
Потребители тратят ограниченный доход, чтобы получить максимально возможную полезность (удовлетворение).
общая полезность — это удовлетворение от всех потребленных единиц.
предельная полезность — это дополнительное удовлетворение от еще одной единицы.
Закон убывающей предельной полезности гласит, что каждая следующая единица дает все меньше дополнительного удовлетворения. Общая полезность все еще растет, но все медленнее.
По мере роста потребления общая полезность увеличивается, но темп её роста замедляется, поскольку предельная полезность снижается — каждая дополнительная единица приносит всё меньше удовлетворения.
Принцип эквимаргинальности
Потребитель с ограниченным бюджетом достигает максимальной общей полезности, когда последняя единица валюты, потраченная на каждый товар, дает одинаковое количество дополнительной пользы. Это принцип эквимаргинальности:
$$\frac{MU_A}{P_A} = \frac{MU_B}{P_B}$$
Поскольку предельная полезность падает при покупке большего количества товара, потребитель готов покупать дополнительные единицы только при снижении цены. Именно поэтому кривая спроса имеет нисходящий наклон.
Польза максимизируется, когда последняя единица валюты, потраченная на каждый товар, дает одинаковую дополнительную пользу
Ограничения
Этот подход трудно применять на практике: полезность невозможно измерить в абсолютных числах, и люди не принимают решения подобным образом. Кроме того, он игнорирует привычки и рекламу.
Explore · Исследовать
Diminishing marginal utility lab · Лабораторная работа по закону убывающей предельной полезности
total utility rises more slowly as quantity increases · Общая полезность растёт медленнее с увеличением количества
Add units consumed and see why extra satisfaction usually falls. · Сложите количество потреблённых единиц и объясните, почему дополнительная удовлетворённость обычно снижается.
Indifference curves and budget lines · Кривые безразличия и бюджетные линии
Syllabus · Программа
English
explain indifference curves and budget lines and consumer equilibrium
explain income and substitution effects for normal, inferior and Giffen goods
Русский
объяснить кривые безразличия и бюджетные линии и равновесие потребителя
объяснить эффект дохода и эффект замещения для нормальных, низкокачественных и товаров Гифена
Source: Cambridge International syllabus · Источник: Программа Cambridge International
English
An indifference curve 无差异曲线 shows all the combinations of two goods that give a consumer the same total utility. It slopes downward (more of one good means less of the other) and bows in towards the origin.
A budget line 预算线 shows all the combinations the consumer can just afford with their income, at the current prices.
consumer equilibrium 消费者均衡 is the best the consumer can do: the point where the budget line just touches the highest possible indifference curve.
Income and substitution effects
When the price of a good falls, the consumer buys more for two reasons:
the substitution effect 替代效应 — the good is now cheaper than others, so the consumer switches towards it.
the income effect 收入效应 — the consumer's money now buys more, so real income has risen.
These effects work differently for different goods:
for a normal good 正常品, both effects raise the quantity bought.
for an inferior good 低档品, the income effect works the other way (higher real income lowers demand), but it is usually weaker, so demand still rises when price falls.
a Giffen good 吉芬品 is a rare, very inferior good where the income effect is so strong that demand actually falls when the price falls. Its demand curve slopes upward.
Русский
Кривая безразличия показывает все комбинации двух товаров, обеспечивающие потребителю одну и ту же общую полезность. Она идет вниз (больше одного товара означает меньше другого) и выпукла к началу координат.
Бюджетная линия отображает все комбинации товаров, которые потребитель может купить на свой доход при текущих ценах.
Равновесие потребителя — это оптимальный результат для него: точка касания бюджетной линии с максимально возможной кривой безразличия.
Лучший выбор потребителя находится там, где бюджетная линия касается наиболее достижимой кривой безразличия; более высокая кривая недоступна по бюджету.
Доходный и замещающий эффекты
При снижении цены на товар потребитель покупает больше по двум причинам:
замещающий эффект — товар стал дешевле других, поэтому потребитель переключается на его потребление.
доходный эффект — деньги потребителя теперь позволяют купить больше, то есть реальное доходы выросли.
Эти эффекты проявляются по-разному для разных товаров:
для нормального блага оба эффекта увеличивают объем спроса.
для низкокачественного блага доходный эффект работает иначе (рост реальных доходов снижает спрос), но обычно он слабее, поэтому спрос все равно растет при снижении цены.
товар Гиффена — редкое, очень низкокачественное благо, где доходный эффект настолько силен, что спрос фактически падает при снижении цены. Его кривая спроса имеет восходящий наклон.
Explore · Исследовать
Budget line lab · Лабораторная работа с бюджетной линией
good B = income / priceB - slope x good A · товар B = доход / ценаB - наклон × товар A
Move quantity of one good and see the trade-off with the other good. · Измените количество одного товара и посмотрите компромисс с другим товаром.
Efficiency and market failure · Эффективность и провал рынка
Syllabus · Программа
English
explain productive and allocative efficiency, Pareto optimality and dynamic efficiency
explain market failure, including from monopoly, externalities, public goods, information failure and factor immobility
Русский
объясните производственную и аллокативную эффективность, оптимальность Парето и динамическую эффективность
объясните провалы рынка, включая вызванные монополиями, внешними эффектами, общественными благами, информационными провалами и неподвижностью факторов производства
Source: Cambridge International syllabus · Источник: Программа Cambridge International
English
Economists judge how well resources are used.
productive efficiency 生产效率 — making goods at the lowest possible cost (using the fewest resources).
allocative efficiency 配置效率 — making the goods people most want, where price equals marginal cost.
Pareto optimality 帕累托最优 — a point where no one can be made better off without making someone else worse off.
dynamic efficiency 动态效率 — improving over time through new technology and better products.
market failure 市场失灵 happens when the free market does not reach an efficient result. The main causes are monopoly power, externalities 外部性, public goods 公共物品, information failure 信息失灵, and factor immobility 要素不流动性 (factors cannot move quickly to where they are needed).
Русский
Экономисты оценивают, насколько эффективно используются ресурсы.
Производственная эффективность — это минимальные издержки; аллокативная — это производство того, что хотят люди
производственная эффективность — выпуск товаров при наименьших возможных издержках (использование минимального объема ресурсов).
аллокативная эффективность — производство тех товаров, которые нужны людям больше всего, при условии равенства цены и предельных издержек.
оптимальность Парето — состояние, при котором невозможно улучшить положение кого-либо, не ухудшив положение кого-то другого.
динамическая эффективность — улучшение ситуации со временем благодаря новым технологиям и улучшенным продуктам.
Провал рынка происходит, когда свободный рынок не приводит к эффективному результату. Основные причины: монополия, внешние эффекты, общественные блага, информационная асимметрия и неподвижность факторов производства (ресурсы не могут быстро переместиться туда, где они необходимы).
The market is allocatively efficient where supply meets demand — price equals marginal cost. Market failure pushes it away from that point. · Рынок аллокативно эффективен там, где предложение встречается со спросом — цена равна предельным издержкам. Провалы рынка смещают его от этой точки.
Externalities and social costs and benefits · Внешние эффекты, социальные издержки и выгоды
Syllabus · Программа
English
distinguish private, external and social costs and benefits
analyse positive and negative externalities of production and consumption using marginal analysis and explain deadweight welfare loss
Русский
различайте частные, внешние и социальные издержки и выгоды
анализируйте положительные и отрицательные внешние эффекты производства и потребления с использованием маржинального анализа и объясняйте потери чистого благосостояния (deadweight welfare loss)
Source: Cambridge International syllabus · Источник: Программа Cambridge International
English
Some costs and benefits fall on people outside the deal. We separate three levels:
a private cost 私人成本 or private benefit 私人收益 falls on the buyer or seller.
an external cost 外部成本 or external benefit 外部收益 falls on a third party.
the social cost 社会成本 is private cost plus external cost; the social benefit 社会收益 is private benefit plus external benefit.
Marginal analysis
We study externalities with marginal analysis 边际分析, using these curves:
marginal private cost 边际私人成本 (MPC) and marginal social cost 边际社会成本 (MSC).
marginal private benefit 边际私人收益 (MPB) and marginal social benefit 边际社会收益 (MSB).
The best outcome for society is where MSC = MSB. But the market produces where MPC = MPB. The gap between these creates lost welfare.
a negative externality 负外部性 (like pollution) means MSC is above MPC. The market makes too much.
a positive externality 正外部性 (like education) means MSB is above MPB. The market makes too little.
The lost welfare from making too much or too little is the deadweight welfare loss 无谓损失 — the triangle on the diagram between the social and private curves.
Русский
Некоторые издержки и выгоды ложатся на людей, не участвующих в сделке. Выделяют три уровня:
частные издержки или частная выгода ложатся на покупателя или продавца.
внешние издержки или внешние выгоды ложатся на третью сторону.
социальные издержки — это частные издержки плюс внешние издержки; социальная выгода — это частная выгода плюс внешняя выгода.
Предельный анализ
Внешние эффекты изучаются с помощью предельного анализа с использованием следующих кривых:
предельные частные издержки (MPC) и предельные социальные издержки (MSC).
предельные частные выгоды (MPB) и предельные социальные выгоды (MSB).
Оптимальный результат для общества достигается, когда MSC = MSB. Однако рынок функционирует там, где MPC = MPB. Разрыв между этими точками создает потери благосостояния.
отрицательный внешний эффект (например, загрязнение) означает, что MSC выше MPC. Рынок производит слишком много.
положительный внешний эффект (например, образование) означает, что MSB выше MPB. Рынок производит слишком мало.
Потери благосостояния от чрезмерного или недостаточного производства составляют потери нетривиального благосостояния — треугольник на диаграмме между социальными и частными кривыми.
Промышленное загрязнение: отрицательный внешний эффект, при котором социальные издержки превышают частные
Explore · Исследовать
Externalities shift the social curve · Внешние эффекты смещают социальную кривую
A negative externality means the social cost is above the private supply curve; the free-market quantity is then too high. · Отрицательный внешний эффект означает, что социальные издержки находятся выше кривой частного предложения; тогда рыночный объем слишком велик.
Costs, revenue and profit · Издержки, выручка и прибыль
Syllabus · Программа
English
explain fixed, variable, total, average and marginal cost and short-run and long-run production (law of diminishing returns, returns to scale)
explain total, average and marginal revenue and normal, supernormal (abnormal) and subnormal profit
Русский
объясните постоянные, переменные, общие, средние и предельные издержки, а также краткосрочное и долгосрочное производство (закон убывающей отдачи, эффекты масштаба)
объясните общую, среднюю и предельную выручку, а также нормальную, сверхнормальную (аномальную) и субнормальную прибыль
Source: Cambridge International syllabus · Источник: Программа Cambridge International
English
Economies of scale: average cost falls
Costs
In the short run 短期, at least one factor is fixed; in the long run 长期, all factors can change.
Cost
Meaning
fixed cost 固定成本
does not change with output (rent on a factory)
variable cost 可变成本
changes with output (raw materials)
total cost 总成本
fixed cost plus variable cost
average cost 平均成本
total cost per unit: $AC = TC / Q$
marginal cost 边际成本
the cost of one more unit: $MC = \Delta TC / \Delta Q$
Worked example. Making $10$ units costs £500 in total; making $11$ units costs £540. Find the average cost at $10$ units and the marginal cost of the 11th unit.
Here $MC$ ($\text{\pounds} 40$) is below $AC$ ($\text{\pounds} 50$), so making the 11th unit pulls the average cost down — whenever marginal cost is below average cost, average cost falls.
In the short run, output is limited by the law of diminishing returns 边际报酬递减: as you add more of a variable factor (workers) to a fixed factor (machines), each extra worker eventually adds less output. This makes marginal cost rise.
In the long run, all factors vary, so we look at returns to scale 规模报酬. As a firm grows, it can gain economies of scale 规模经济 (lower average cost from buying in bulk, using big machines, and specialising). If it grows too big, it may suffer diseconomies of scale 规模不经济 (poor communication and control), and average cost rises.
Revenue
Revenue
Meaning
total revenue 总收益
all money from sales: $TR = P \times Q$
average revenue 平均收益
revenue per unit, which equals the price
marginal revenue 边际收益
the revenue from one more unit: $MR = \Delta TR / \Delta Q$
Worked example. A firm sells $10$ units at £50 each. To sell an 11th unit it must lower the price to £48 on every unit. Find the total revenue at each output and the marginal revenue of the 11th unit.
The marginal revenue ($\text{\pounds} 28$) is well below the £48 price, because the lower price applies to all $11$ units, not just the extra one.
Profit
Profit is total revenue minus total cost. Economists include the opportunity cost of the owner's resources in cost, so:
normal profit 正常利润 is just enough profit to keep the firm in the industry. It counts as a cost.
supernormal profit 超常利润 (also called abnormal profit) is profit above normal.
subnormal profit 次正常利润 is profit below normal — the firm may leave in the long run.
A firm makes the most profit at the output where $MR = MC$.
Worked example. At its best output a firm makes $100$ units, sells each for £12 (its average revenue), and has an average cost of £9. Find the supernormal profit.
Because average revenue (£12) is above average cost (£9), the firm earns supernormal profit. If instead $AR = AC$, it would make only normal profit; if $AR < AC$, it would make a loss.
Русский
Экономия на масштабе: средние издержки снижаются
Издержки
В краткосрочном периоде хотя бы один фактор производства является постоянным; в долгосрочном периоде все факторы могут изменяться.
Крупный сталеплавильный завод: крупные компании получают эффект масштаба, поэтому средние издержки снижаются при росте выпуска.
Издержки
Значение
постоянные издержки
не зависят от объема выпуска (аренда завода)
переменные издержки
меняются в зависимости от объема выпуска (сырье)
общие издержки
постоянные издержки плюс переменные издержки
средние издержки
общие издержки на единицу: $AC = TC / Q$
предельные издержки
затраты на производство еще одной единицы: $MC = \Delta TC / \Delta Q$
Разобранное решение. Производство $10$ единиц стоит £500 в целом; производство $11$ единиц стоит £540. Найдите средние издержки при $10$ единицах и предельные издержки 11-й единицы.
Здесь $MC$ ($\text{\pounds} 40$) ниже $AC$ ($\text{\pounds} 50$), поэтому увеличение производства до 11-й единицы снижает средние издержки —每当边际成本低于平均成本时,平均成本下降。
В краткосрочном периоде объем выпуска ограничен законом убывающей отдачи: по мере добавления переменной фактора (рабочих) к постоянному фактору (оборудованию), каждый дополнительный рабочий в конечном итоге дает все меньше прироста продукции. Это приводит к росту предельных издержек.
Предельные, средние общие и средние переменные издержки имеют U-образную форму; MC пересекает две средние кривые в их минимальных точках.
В долгосрочном периоде все факторы изменяются, поэтому мы рассматриваем отдачу от масштаба. По мере роста фирма может получать экономии от масштаба (снижение средних издержек за счет оптовых закупок, использования крупного оборудования и специализации). Если она вырастает слишком большой, то может столкнуться с дизэкономиями от масштаба (плохая коммуникация и контроль), и средние издержки растут.
Долгосрочные средние издержки снижаются благодаря экономиям от масштаба, достигают минимума, а затем растут из-за дисэкономий от масштаба.
Выручка
Выручка
Значение
общая выручка
все деньги от продаж: $TR = P \times Q$
средняя выручка
выручка на единицу, равная цене
предельная выручка
выручка от одной дополнительной единицы: $MR = \Delta TR / \Delta Q$
Разбор примера. Фирма продает $10$ единиц по £50 каждая. Чтобы продать 11-ю единицу, ей приходится снизить цену до £48 на каждую единицу. Найдите общую выручку при каждом объеме выпуска и предельную выручку 11-й единицы.
Предельная выручка ($\text{\pounds} 28$) значительно ниже цены £48, потому что более низкая цена применяется ко всем $11$ единицам, а не только к дополнительной.
Прибыль
Прибыль — это общая выручка минус общие издержки. Экономисты включают упущенную выгоду ресурсов владельца в издержки, поэтому:
нормальная прибыль — это ровно столько прибыли, чтобы оставить фирму в отрасли. Она считается издержкой.
сверхнормальная прибыль (также называемая аномальной прибылью) — это прибыль выше нормальной.
субнормальная прибыль — это прибыль ниже нормальной — в долгосрочном периоде фирма может уйти с рынка.
Фирма максимизирует прибыль при объеме выпуска, где $MR = MC$.
Разбор примера. При оптимальном объеме выпуска фирма производит $100$ единиц, продает каждую за £12 (ее средняя выручка) и имеет средние издержки £9. Найдите сверхнормальную прибыль.
Поскольку средняя выручка (£12) выше средних издержек (£9), фирма зарабатывает сверхнормальную прибыль. Если бы вместо этого $AR = AC$, она получала бы только нормальную прибыль; если бы $AR < AC$, она понесла бы убытки.
Explore · Исследовать
Revenue & profit · Выручка & прибыль
y = ax² + bx + c
Total revenue rises then falls as price changes. · Общая выручка растет, затем падает при изменении цены.
Explore · Исследовать
Costs and the firm · Издержки и фирма
Average cost is U-shaped; marginal cost cuts it at the minimum. Different market structures price relative to these curves. · Средние издержки имеют U-образную форму; предельные издержки пересекают их в точке минимума. Различные рыночные структуры устанавливают цены относительно этих кривых.
Explore · Исследовать
Average and marginal cost · Средние и предельные издержки
Change output. Marginal cost cuts average cost at its lowest point — the heart of the theory of the firm. · Изменяйте объем выпуска. Предельные издержки пересекают средние издержки в их минимальной точке — это основа теории фирмы.
explain the assumptions, behaviour and outcomes of perfect competition, monopolistic competition, oligopoly and monopoly
explain price and non-price competition, collusion, price discrimination and the efficiency of each market structure
Русский
объясните допущения, поведение и результаты для идеальной конкуренции, монополистической конкуренции, олигополии и монополии
объясните ценовую и неценовую конкуренцию, коллаюзию, ценовую дискриминацию и эффективность каждой рыночной структуры
Source: Cambridge International syllabus · Источник: Программа Cambridge International
English
A market structure 市场结构 describes a market by the number of firms, the barriers to entry, and the type of product.
Structure
Firms
Barriers
Product
Long-run profit
perfect competition 完全竞争
very many
none
identical
normal only
monopolistic competition 垄断竞争
many
low
slightly different
normal
oligopoly 寡头垄断
a few
high
varies
often supernormal
monopoly 垄断
one
very high
unique
supernormal
in perfect competition, each firm is a tiny price taker 价格接受者 — it must accept the market price. Firms make only normal profit in the long run, and the market is both productively and allocatively efficient.
in monopolistic competition, many firms sell slightly different products (product differentiation 产品差异化), so each has a little price-setting power, but free entry competes profit away.
in an oligopoly, a few large firms dominate. They watch each other closely. They may compete hard on price, or they may agree to fix prices — this is collusion 合谋, and a group that does so is a cartel 卡特尔.
a monopoly is a single seller protected by high barriers to entry 进入壁垒. It can earn supernormal profit for a long time but is usually inefficient.
Price and non-price competition
price competition 价格竞争 means cutting prices to win customers.
non-price competition 非价格竞争 means competing in other ways — advertising, quality, branding and service.
Price discrimination
price discrimination 价格歧视 is charging different consumers different prices for the same good (for example, cheaper train tickets for students). It needs price-setting power, groups with different elasticities, and a way to stop resale between groups. It raises the firm's profit.
Русский
Рыночная структура описывает рынок по количеству фирм, барьерам для входа и типу продукта.
Структура
Фирмы
Барьеры
Продукт
Долгосрочная прибыль
совершенная конкуренция
очень много
нет
идентичный
только нормальная
монополистическая конкуренция
много
низкие
слегка различающиеся
нормальная
олигополия
несколько
высокие
варьируется
часто сверхнормальная
монополия
одна
очень высокие
уникальный
сверхнормальная
Четыре структуры расположены на спектре конкуренции: много фирм на одном конце (совершенная конкуренция), одна фирма на другом (монополия)
в совершенной конкуренции каждая фирма является крошечным принявшим цену — она должна принимать рыночную цену. В долгосрочном периоде фирмы получают только нормальную прибыль, и рынок эффективен как с точки зрения производственной, так и распределительной эффективности.
в монополистической конкуренции многие фирмы продают слегка разные продукты (дифференциация продукта), поэтому каждая имеет немного власти над ценой, но свободный вход конкурирует сверхнормальную прибыль прочь.
в олигополии несколько крупных фирм доминируют. Они внимательно следят друг за другом. Они могут жестко конкурировать по цене, или они могут договориться установить цены — это сговор, и группа, которая так делает, называется картелем.
монополия — это единственный продавец, защищенный высокими барьерами для входа. Она может зарабатывать сверхнормальную прибыль долгое время, но обычно неэффективна.
В долгосрочном равновесии совершенно конкурентная фирма производит там, где MC = MR внизу ATC, получая только нормальную прибыль.Монополия производит там, где MC = MR, затем устанавливает более высокую цену, которую готовы платить покупатели (считывается с кривой AR), сохраняя сверхнормальную прибыль.
Ценовая и неценовая конкуренция
ценовая конкуренция означает снижение цен для привлечения покупателей.
неценовая конкуренция означает конкуренцию другими способами — реклама, качество, брендинг и обслуживание.
Ценовая дискриминация
ценовая дискриминация — это взимание разных цен у разных потребителей за одно и то же благо (например, дешевые билеты на поезд для студентов). Она требует способности устанавливать цены, групп с разной эластичностью и способа предотвращения перепродажи между группами. Она повышает прибыль фирмы.
Explore · Исследовать
Pricing and competition · Ценообразование и конкуренция
How a firm prices depends on demand and supply; with market power it can charge above the competitive level. · Как фирма устанавливает цену, зависит от спроса и предложения; при наличии рыночной власти она может взимать цену выше конкурентного уровня.
The growth and survival of firms · Рост и выживание фирм
Syllabus · Программа
English
explain why firms grow (internal and external — horizontal, vertical, conglomerate integration) and why some remain small
explain barriers to entry and exit and the survival of small firms
Русский
объясните причины роста фирм (внутренний и внешний — горизонтальная, вертикальная, конгломератная интеграция) и причины того, почему некоторые остаются маленькими
объясните барьеры входа и выхода и выживание малых фирм
Source: Cambridge International syllabus · Источник: Программа Cambridge International
English
Firms grow in two ways:
internal growth 内部增长 (organic) — growing bigger by selling more.
external growth 外部增长 — joining with another firm through a merger 合并 or takeover. Types:
horizontal integration 横向一体化 — joining a firm at the same stage of the same industry (two car makers).
vertical integration 纵向一体化 — joining a firm at a different stage (a car maker buys a tyre maker).
conglomerate integration 混合一体化 — joining a firm in a different industry, to spread risk.
Why some firms stay small
Many firms stay small because the market is small (local services), the owner wants to keep control, or there are few economies of scale. They survive by offering personal service or filling a niche 利基市场.
Firms also face barriers to entry and barriers to exit 退出壁垒 (such as costly machines that cannot be sold). High exit barriers can trap a firm in a loss-making market.
Русский
Фирмы растут двумя способами:
внутренний рост (органический) — рост за счет увеличения продаж.
внешний рост — присоединение к другой фирме посредством слияния или поглощения. Типы:
горизонтальная интеграция — объединение с фирмой на той же стадии той же отрасли (два автопроизводителя).
вертикальная интеграция — объединение с фирмой на другой стадии (автопроизводитель покупает шинное предприятие).
конгломератная интеграция — объединение с фирмой в другой отрасли для диверсификации рисков.
Внешний рост в производственной цепочке: горизонтальная, вертикальная и конгломератная интеграции
Почему некоторые компании остаются маленькими
Многие компании остаются небольшими, потому что рынок мал (местные услуги), владелец хочет сохранить контроль или существует мало эффектов масштаба. Они выживают за счет личного обслуживания или занятия нишевой позиции.
Компании также сталкиваются с барьерами для входа и барьерами для выхода (например, дорогостоящее оборудование, которое нельзя продать). Высокие барьеры для выхода могут запереть компанию на рынке с убытками.
Explore · Исследовать
Firm objective lab · Лаборатория целей фирмы
Classify real firm decisions by the objective they reveal. · Классифицируйте реальные решения фирмы по цели, которую они раскрывают.
объясните разделение собственности и управления (проблемаprincipal-agent) и её последствия
Source: Cambridge International syllabus · Источник: Программа Cambridge International
English
Not every firm simply chases the most profit.
profit maximisation 利润最大化 — producing where MR = MC. The traditional aim.
revenue maximisation 收益最大化 — producing where MR = 0, perhaps to grow market share.
sales maximisation 销售最大化 — selling as much as possible while still making normal profit.
satisficing 满意化 — aiming for "good enough" results that keep owners, workers and customers all reasonably happy.
Divorce of ownership from control
In large companies the owners (shareholders) are not the managers. This divorce of ownership from control 所有权与控制权分离 creates the principal-agent problem 委托代理问题: managers (the agents) may pursue their own aims — bigger salaries or an easier life — instead of the owners' aim of maximum profit.
Русский
Не каждая компания просто преследует максимальную прибыль.
максимизация прибыли — производство при MR = MC. Традиционная цель.
максимизация выручки — производство при MR = 0, возможно, для роста доли рынка.
максимизация продаж — продажа как можно большего объема при сохранении нормальной прибыли.
удовлетворительность (satisficing) — стремление к результатам «достаточно хорошим», которые удовлетворяют владельцев, работников и клиентов.
Разделение собственности и контроля
В крупных компаниях владельцы (акционеры) не являются менеджерами. Это разделение собственности и контроля создает проблемуPrincipal-agent: менеджеры (агенты) могут преследовать собственные цели — более высокие зарплаты или легкую жизнь — вместо цели владельцев по максимизации прибыли.
Explore · Исследовать
Firm objective lab · Лаборатория целей фирмы
Classify real firm decisions by the objective they reveal. · Классифицируйте реальные решения фирмы по цели, которую они раскрывают.
Calculate AC, MC, TR and MR, and remember a firm maximises profit where $MR = MC$.
Distinguish the market structures (perfect competition, monopolistic competition, oligopoly, monopoly) by number of firms, barriers and price-setting power.
Distinguish normal from supernormal profit and link long-run entry and exit to it.
On a cost diagram, note that MC cuts AC at the minimum of AC.
Русский
Рассчитайте AC, MC, TR и MR, и помните, что фирма максимизирует прибыль, когда $MR = MC$.
Различайте рыночные структуры (совершенная конкуренция, монополистическая конкуренция, олигополия, монополия) по числу фирм, барьерам и способности устанавливать цены.
Различайте нормальную и сверхприбыль и связывайте долгосрочный вход и выход с ними.
На диаграмме издержек注意点, что MC пересекает AC в точке минимума AC.
explain policies to correct market failure: taxes, subsidies, price controls, tradable permits, regulation, provision, nationalisation and privatisation
explain competition policy and the concept of government failure
Русский
объясните политику исправления провалов рынка: налоги, субсидии, контроль цен, торгуемые квоты, регулирование, предоставление, национализация и приватизация
объясните политику конкуренции и концепцию провала государства (government failure)
Source: Cambridge International syllabus · Источник: Программа Cambridge International
English
A government has many tools to push a market towards a better use of resources.
an indirect tax 间接税 on a good with a negative externality (like fuel) raises its price and cuts the quantity used.
a subsidy 补贴 for a good with a positive externality (like solar panels) lowers its price and raises the quantity.
a price control 价格管制 sets a legal maximum or minimum price.
tradable permits 可交易许可证 cap total pollution and let firms buy and sell the right to pollute.
regulation 管制 uses rules and laws, such as bans, safety standards and pollution limits.
state provision 政府提供 means the government supplies a good directly, often free (schools, hospitals, defence).
nationalisation 国有化 is taking an industry into government ownership; privatisation 私有化 is selling a state industry to private owners.
Competition policy
A firm with monopoly power 垄断势力 can raise prices and cut output. competition policy 竞争政策 is the set of laws used to protect competition — for example, blocking mergers that create too much power, banning price-fixing, and fining firms that abuse their position.
Government failure
Intervention can backfire. government failure 政府失灵 is when the government's action leads to a worse use of resources than before — through poor information, high costs, long time lags, or unintended effects (such as a black market caused by a price control).
Русский
У правительства есть множество инструментов для направления рынка к лучшему использованию ресурсов.
косвенный налог на товар с отрицательным внешним эффектом (например, топливо) повышает его цену и сокращает потребление.
субсидия на товар с положительным внешним эффектом (например, солнечные панели) снижает его цену и увеличивает потребление.
контроль цен устанавливает законодательный максимум или минимум цены.
торгуемые разрешения ограничивают общий объем загрязнения и позволяют фирмам покупать и продавать право на загрязнение.
регулирование использует правила и законы, такие как запреты, стандарты безопасности и лимиты загрязнения.
государственное предоставление означает, что правительство непосредственно поставляет товары, часто бесплатно (школы, больницы, оборона).
национализация — это перевод отрасли в государственную собственность; приватизация — продажа государственной отрасли частным владельцам.
Конкурентная политика
Фирма с монопольной властью может повышать цены и снижать выпуск. Конкурентная политика — это набор законов, используемых для защиты конкуренции — например, блокирование слияний, создающих слишком большую власть, запрет фиксирования цен и штрафы за злоупотребление положением.
Провалы государственной политики
Вмешательство может дать обратный эффект. Провал государства возникает, когда действия правительства приводят к худшему использованию ресурсов, чем до этого — из-за плохой информации, высоких затрат, длительных временных лагов или непредвиденных последствий (например, черного рынка, вызванного контролем цен).
Демаритные товары, такие как сигареты, потребляются в избытке, когда игнорируются внешние издержки — классический провал рынка
Explore · Исследовать
When a market fails · Когда рынок терпит неудачу
An externality (like pollution) means the market price ignores a real cost — output ends up above the efficient level. Add the external cost to see the gap. · Внешний эффект (например, загрязнение) означает, что рыночная цена игнорирует реальные издержки — объем производства оказывается выше эффективного уровня. Прибавьте внешние издержки, чтобы увидеть разрыв.
Equity and redistribution · Справедливость и перераспределение
Syllabus · Программа
English
distinguish equity, equality, and the difference between income and wealth
explain the Lorenz curve and Gini coefficient and policies to redistribute income and wealth (taxation, benefits, the difficulty of redistributing wealth)
Русский
различайте справедливость (equity), равенство (equality) и разницу между доходом и богатством
объясните кривую Лоренца и коэффициент Джини, а также политики перераспределения доходов и богатства (налоговое налогообложение, пособия, сложность перераспределения богатства)
Source: Cambridge International syllabus · Источник: Программа Cambridge International
English
It is important to separate two words that sound alike:
equity 公平 means fairness — people getting what is fair, which may not be an equal share.
equality 平等 means everyone getting the same.
A fair (equitable) outcome is not always an equal one. Most governments worry about too much inequality 不平等.
Remember the difference between the two things being shared:
income 收入 is a flow received over time (wages, rent, interest).
wealth 财富 is a stock of assets owned (houses, shares, savings).
Measuring inequality
the Lorenz curve 洛伦兹曲线 is a graph. It plots the share of total income against the share of the population, from poorest to richest. A straight diagonal line would mean perfect equality. The further the curve bends below the line, the more unequal the country.
the Gini coefficient 基尼系数 turns this into one number between 0 and 1. Zero means perfect equality; one means one person has everything. A higher number means more inequality.
Policies to redistribute
a progressive tax 累进税 takes a larger share from higher incomes.
benefits 福利金 (also called transfer payments 转移支付) give money to the poor, the old and the unemployed.
free state services (education, health care) raise the real living standards of the poor.
These bring about redistribution 再分配 — moving income from richer to poorer people. Wealth is harder to redistribute than income, because the rich can hide assets or move them abroad, and wealth taxes are hard to collect.
Worked example. Country X has a Gini coefficient of 0.25 and country Y one of 0.48. What does that mean, and what does each Lorenz curve look like? The Gini runs from 0 (perfect equality) to 1 (one person has everything), so a higher number means more unequal: country Y at 0.48 is markedly more unequal than X at 0.25. On the graph, Y's Lorenz curve sags further below the 45° line of equality, while X's hugs it more closely. The Gini is exactly the area between the line of equality and the Lorenz curve, as a fraction of the whole triangle beneath that line - which is why a bigger sag gives a bigger number. One caution is worth stating: the Gini measures relative inequality only. It says nothing about absolute living standards, so a poor country and a rich one can share the same Gini.
Русский
Важно различать два слова, звучащих одинаково:
справедливость (equity) означает честность — люди получают то, что им положено по справедливости, что может быть не равной долей.
равенство (equality) означает, что все получают одно и то же.
Равенство дает всем одинаковое; справедливость дает каждому свое по справедливости — поэтому справедливый результат не всегда является равнымНеравенство доходов: неформальные поселения часто расположены рядом с гораздо более богатыми районами.
Справедливый (справедливый) результат не всегда является равным. Большинство правительств беспокоятся о чрезмерном неравенстве.
Помните разницу между двумя вещами, которые распределяются:
доход — это поток, получаемый со временем (зарплата, аренда, проценты).
богатство — это совокупность owned активов (дома, акции, сбережения).
Измерение неравенства
кривая Лоренца — это график. Она отображает долю общего дохода против доли населения, от беднейших к богатейшим. Прямая диагональная линия означала бы полное равенство. Чем больше кривая отклоняется вниз от линии, тем более неравно распределены доходы в стране.
коэффициент Джини превращает это в одно число от 0 до 1. Ноль означает полное равенство; единица означает, что один человек владеет всем. Более высокое число означает большее неравенство.
Кривая Лоренца отображает накопленную долю дохода против накопленной доли населения; чем сильнее она провисает ниже линии равенства, тем выше коэффициент Джини.
Политики перераспределения
прогрессивный налог изымает бо́льшую долю у лиц с высоким доходом.
пособия (также называемые трансфертными платежами) предоставляют деньги бедным, пожилым людям и безработным.
бесплатные государственные услуги (образование, здравоохранение) повышают реальную покупательную способность малообеспеченных слоев населения.
Прогрессивный налог взимает более высокую ставку с высоких доходов
Это приводит к перераспределению — перемещению доходов от богатых к бедным. Перераспределить богатство сложнее, чем доход, так как богатые могут прятать активы или выводить их за рубеж, а налоги на имущество сложно собирать.
Разбор примера. В стране X коэффициент Джини составляет 0,25, а в стране Y — 0,48. Что это означает и как выглядят кривые Лоренца? Коэффициент Джини варьируется от 0 (абсолютное равенство) до 1 (у одного человека все), поэтому более высокое значение означает большее неравенство: страна Y со значением 0,48 значительно более неравномерна, чем страна X со значением 0,25. На графике кривая Лоренца для Y сильнее провисает ниже линии равенства под углом 45°, тогда как для X она проходит ближе к ней. Коэффициент Джини представляет собой отношение площади между линией равенства и кривой Лоренца к общей площади треугольника под этой линией — именно поэтому большее провисание дает большее числовое значение. Важно отметить одну оговорку: коэффициент Джини отражает только относительное неравенство. Он ничего не говорит об абсолютном уровне жизни, поэтому бедная и богатая страны могут иметь одинаковый коэффициент Джини.
Explore · Исследовать
Inequality policy route · Путь политики по борьбе с неравенством
Follow how policy can change disposable income and opportunity. · Проследите, как политика может изменить располагаемый доход и возможности.
Explore · Исследовать
Bend the Lorenz curve · Изогнуть кривую Лоренца
Drag each economy's top-20% income share — the curve that hugs the line of equality has the lower Gini, and the quintile chips give the exam-table numbers. · Перетащите долю доходов топ-20% каждой экономики — кривая, прилегающая ближе к линии равенства, имеет меньший индекс Джини, а долевые чипсы дают числа для таблицы экзамена.
explain the demand for and supply of labour, marginal revenue product (MRP) and wage determination in competitive labour markets
explain monopsony, trade unions, the national minimum wage, wage differentials and discrimination, and government intervention
Русский
объясните спрос на труд и предложение труда, предельный доходный продукт (MRP) и определение заработной платы на конкурентных рынках труда
объясните мононопсонию, профсоюзы, минимальную заработную плату, дифференциацию заработной платы и дискриминацию, а также государственное вмешательство
Source: Cambridge International syllabus · Источник: Программа Cambridge International
English
A wage is just a price — the price of labour — so we use demand and supply to study the labour market 劳动力市场.
The demand for labour
The demand for labour 劳动力需求 is a derived demand 派生需求: firms want workers not for their own sake, but to make goods that sell. So labour demand depends on the marginal revenue product 边际收益产品 (MRP) — the extra revenue one more worker brings in. A worker is worth hiring while the MRP is at least as big as the wage.
The supply of labour
The supply of labour 劳动力供给 to a job rises when the wage 工资 rises, and also depends on training needed, working conditions, and how many people have the right skills.
In a competitive labour market, the wage settles where the demand for labour equals the supply of labour.
When the market is not competitive
a monopsony 买方垄断 is a single, dominant buyer of labour (for example, the only large employer in a town). It can pay a wage below the competitive level and hire fewer workers.
a trade union 工会 is an organised group of workers that bargains for higher pay. A union can push the wage above the competitive level, but this may reduce the number of jobs.
a national minimum wage 全国最低工资 is a legal lowest wage. Set above the market wage, it raises low pay but may cause some unemployment. Interestingly, in a monopsony it can raise both the wage and employment.
Wage differentials and discrimination
Wages differ between jobs — this is a wage differential 工资差异. The main reasons are differences in MRP (skilled work is more productive), the training and qualifications needed, and the risk or unpleasantness of the work.
Some wage gaps come from discrimination 歧视 — paying people differently because of gender, race or age rather than their productivity. Governments use equal-pay laws and anti-discrimination laws to reduce this.
Русский
Зарплата — это просто цена, то есть цена рабочей силы, поэтому мы используем спрос и предложение для изучения рынка труда.
На рынке труда компании требуют работников, а зарплата является ценой на труд.
Спрос на труд
Спрос на труд является производным спросом: компаниям нужны работники не сами по себе, а для производства товаров, которые будут продаваться. Поэтому спрос на труд зависит от предельного продукта труда (MRP — Marginal Revenue Product) — дополнительной выручки, которую приносит каждый дополнительный работник. Работника выгодно нанимать, пока MRP не меньше зарплаты.
Предложение труда
Предложение труда на работу возрастает при росте зарплаты, а также зависит от требуемого обучения, условий труда и количества людей, обладающих необходимыми навыками.
На конкурентном рынке труда зарплата устанавливается там, где спрос на труд равен предложению труда.
На конкурентном рынке труда зарплата $W^*$ и уровень занятости $L^*$ определяются точкой пересечения спроса на труд (MRP) и предложения труда.
Когда рынок неконкурентен
монопопсония — это единственный, доминирующий покупатель рабочей силы (например, единственный крупный работодатель в городе). Она может платить зарплату ниже конкурентного уровня и нанимать меньше работников.
профсоюз — это организованная группа работников, которая добивается повышения оплаты труда. Профсоюз может поднять зарплату выше конкурентного уровня, но это может сократить количество рабочих мест.
минимальная заработная плата — это установленный законом нижний предел оплаты труда. При установлении ее выше рыночного уровня она повышает доходы низкоквалифицированных работников, но может вызвать безработицу. Интересно, что в условиях монопопсонии она может повысить как зарплату, так и уровень занятости.
Установление минимальной зарплаты выше равновесного уровня означает, что больше работников хотят работать, чем готовы нанять компании, что ведет к безработице.
Разница в оплате труда и дискриминация
Оплата труда различается между профессиями — это разница в оплате труда. Основные причины кроются в различиях MRP (квалифицированный труд более производительен), необходимости специального обучения и квалификации, а также в рисках или неприятности самой работы.
Некоторые разрывы в оплате обусловлены дискриминацией — выплатой разной зарплаты людям из-за пола, расы или возраста, а не из-за их продуктивности. Правительства используют законы о равной оплате труда и антидискриминационные законы для сокращения этого явления.
Explore · Исследовать
The labour market · Рынок труда
Wages are a price. The demand for labour (from firms) and the supply of labour (from workers) set the equilibrium wage. · Заработная плата — это цена. Спрос на труд (со стороны фирм) и предложение труда (со стороны работников) определяют равновесную ставку.
Evaluate ways to correct market failure, and warn of government failure (unintended effects, poor information).
Distinguish equity from equality; discuss redistribution (progressive tax, benefits) and its trade-off with incentives.
Analyse a labour market with the demand for and supply of labour, and explain wage differentials and the effect of a minimum wage.
Русский
Оценить способы устранения провалов рынка и предостеречь от провалов государственного регулирования (непреднамеренные последствия, плохая информация).
Проводить различие между справедливостью и равенством; обсуждать перераспределение (прогрессивное налогообложение, пособия) и его компромисс с мотивацией.
Проанализировать рынок труда с учетом спроса и предложения на труд, объяснить разницу в оплате труда и влияние минимальной заработной платы.
This topic studies the wider economy at A Level depth: how spending multiplies, how growth links to the environment, the jobs–prices link, and money.
Русский
Эта тема изучает широкую экономику на уровне A Level: как умножаются расходы, как рост связан с окружающей средой, связь между занятостью и ценами, а также вопросы денег.
9.1
The circular flow and the multiplier · Кругооборот и мультипликатор
Syllabus · Программа
English
explain the circular flow of income, injections and leakages, and the multiplier (including the marginal propensities)
explain the accelerator and the determinants of consumption, saving and investment
Русский
объясните кругооборот национального дохода, инъекции и утечки, а также мультипликатор (включая предельные склонности к расходованию/накоплению)
объясните ускоритель и детерминанты потребления, сбережений и инвестиций
Source: Cambridge International syllabus · Источник: Программа Cambridge International
English
The multiplier effect
The circular flow of income 收入循环流 shows money passing between households and firms. injections 注入 add money to the flow (investment, government spending, exports); leakages 漏出 take it out (saving, taxation, imports).
The multiplier
An injection raises income by more than the first amount. This is the multiplier 乘数. When a firm builds a factory, the builders earn income, and they spend part of it, which becomes someone else's income, and so on.
How much is spent again depends on the marginal propensity to consume 边际消费倾向 (MPC) — the fraction of extra income that people spend on home goods. The rest leaks out. In a simple model:
$$\text{multiplier} = \frac{1}{1 - MPC}$$
A bigger MPC (smaller leakages) gives a bigger multiplier. The main leakages are measured by the marginal propensity to save 边际储蓄倾向 (MPS) and the marginal propensity to import 边际进口倾向 (MPM).
Worked example. In an economy the MPC is $0.8$. Find the multiplier, then the effect of a $\text{\pounds} 10$ billion rise in investment.
National income therefore rises by $5 \times \text{\pounds} 10\text{ billion} = \text{\pounds} 50\text{ billion}$ — five times the original injection. (Because all income is either spent or saved, $\text{MPC} + \text{MPS} = 1$, so here $\text{MPS} = 0.2$ and the multiplier is also $1/\text{MPS}$.)
The accelerator
The accelerator 加速数 says that investment 投资 depends on the rate of change of output. When demand is rising quickly, firms need lots of new capital, so investment jumps. When demand merely stays high, investment falls back.
What drives consumption, saving and investment
consumption 消费 and saving 储蓄 depend on disposable income 可支配收入 (income after tax), wealth, interest rates, and confidence.
investment depends on interest rates, expected profit, technology, and business confidence.
Русский
Эффект мультипликатора
Кругооборот доходов показывает движение денег между домохозяйствами и фирмами. Вливания добавляют деньги в оборот (инвестиции, государственные расходы, экспорт); утечки изымают их (сбережения, налоги, импорт).
Доход циркулирует между домохозяйствами и фирмами, с инъекциями и оттоками
Мультипликатор
Вливание увеличивает доход на большую величину, чем первоначальная сумма. Это и есть мультипликатор. Когда фирма строит завод, строители получают доход, тратят его часть, что становится доходом для кого-то другого, и так далее.
То, сколько будет потрачено снова, зависит от предельной склонности к потреблению (MPC — Marginal Propensity to Consume) — доли дополнительного дохода, которую люди тратят на товары внутреннего потребления. Остальное утекает. В простой модели:
$$\text{multiplier} = \frac{1}{1 - MPC}$$
Большая MPC (меньшие утечки) дает больший мультипликатор. Основные утечки измеряются предельной склонностью к сбережению (MPS — Marginal Propensity to Save) и предельной склонностью к импорту (MPM — Marginal Propensity to Import).
Разбор примера. В экономике MPC составляет $0.8$. Найдите мультипликатор, а затем эффект от роста инвестиций на $\text{\pounds} 10$ миллиарда.
Национальный доход, следовательно, вырастает на $5 \times \text{\pounds} 10\text{ billion} = \text{\pounds} 50\text{ billion}$ — в пять раз больше первоначального вливания. (Поскольку весь доход либо тратится, либо сберегается, $\text{MPC} + \text{MPS} = 1$, то здесь $\text{MPS} = 0.2$, а мультипликатор также равен $1/\text{MPS}$.)
Инъекция тратится из раунда в раунд (каждый следующий меньше на величину MPC), поэтому совокупный доход возрастает во много раз по сравнению с первой инъекцией.
Ускоритель
Ускоритель утверждает, что инвестиции зависят от темпа прироста выпуска. Когда спрос быстро растет, фирмам требуется много нового капитала, и инвестиции резко возрастают. Если спрос просто остается высоким, инвестиции снижаются.
Что движет потреблением, сбережениями и инвестициями
потребление и сбережения зависят от располагаемого дохода (дохода после налогов), богатства, процентных ставок и уверенности.
инвестиции зависят от процентных ставок, ожидаемой прибыли, технологий и деловой уверенности.
Explore · Исследовать
The circular flow and the multiplier · Кругооборот и мультипликатор
Income circles between households and firms. An injection (e.g. investment) is re-spent again and again — the multiplier effect. · Доход циркулирует между домохозяйствами и фирмами. Инъекция (например, инвестиции) тратится снова и снова — эффект мультипликатора.
Explore · Исследовать
The multiplier, round by round · Мультипликатор, раунд за раундом
Drag the injection and the MPC, then press Play — each spending round is MPC times the last, and the total settles at k × the injection. · Перетащите внедрение и MPC, затем нажмите Play — каждый цикл расходов составляет MPC умноженное на предыдущий, а итоговая сумма стабилизируется на уровне k × внедрения.
marginal propensity to consume/ˈmɑːdʒɪnl prəˈpensɪti tə kənˈsjuːm/
предельная склонность к потреблению
marginal propensity to save/ˈmɑːdʒɪnl prəˈpensɪti tə seɪv/
предельная склонность к сбережению
marginal propensity to import/ˈmɑːdʒɪnl prəˈpensɪti tʊ ɪmˈpɔːt/
предельная склонность к импорту
accelerator/əkˈseləreɪtə/
ускоритель
9.2
Economic growth and sustainability · Экономический рост и устойчивость
Syllabus · Программа
English
distinguish actual and potential growth, output gaps and sustainable growth
explain the costs and benefits of growth and the relationship between growth and sustainability
Русский
различайте фактический и потенциальный рост, выпускные разрывы и устойчивый рост
объясните издержки и выгоды роста, а также связь между ростом и устойчивостью
Source: Cambridge International syllabus · Источник: Программа Cambridge International
English
economic growth 经济增长 is a rise in real output.
actual growth 实际增长 is the real rise in output that happens.
potential growth 潜在增长 is the rise in the economy's capacity.
The output gap 产出缺口 is the difference between actual output and potential output. A positive gap (actual above potential) tends to cause inflation; a negative gap (actual below potential) means spare capacity and unemployment.
Sustainability
sustainable growth 可持续增长 is growth that meets today's needs without harming the ability of future generations to meet theirs. Fast growth can use up non-renewable resources and cause pollution, which threatens sustainability 可持续性. So a country must weigh growth today against the environment and resources of tomorrow.
Русский
экономический рост — это рост реального объема выпуска.
Инвестиции в новые здания и капитал являются ключевым драйвером экономического роста.
фактический рост — это реальный прирост выпуска, который происходит.
потенциальный рост — это рост производственных возможностей экономики.
разрыв в выпуске — это разница между фактическим и потенциальным объемом выпуска. Положительный разрыв (фактический выше потенциального) обычно вызывает инфляцию; отрицательный разрыв (фактический ниже потенциального) означает наличие резервных мощностей и безработицу.
Фактический выпуск колеблется вокруг потенциального: выше него — положительный (инфляционный) разрыв, ниже него — отрицательный разрыв с резервными мощностями.
Устойчивость
устойчивый рост — это рост, который удовлетворяет потребности сегодняшнего дня, не нанося ущерба возможности будущих поколений удовлетворять свои потребности. Быстрый рост может истощить невозобновляемые ресурсы и вызвать загрязнение, что угрожает устойчивости. Поэтому страна должна взвешивать рост сегодня против окружающей среды и ресурсов завтрашнего дня.
Ветер, используемый этими турбинами, никогда не исчерпывается, и они не сжигают топливо. Перевод производства с угля и нефти на такие возобновляемые источники позволяет экономике продолжать расти, не расходуя ресурсы — и не заполняя воздух выбросами, которые лишили бы будущие поколения.
Explore · Исследовать
Economics case lab · Лаборатория экономических кейсов
Classify real examples by the economic idea they show. · Классифицируйте реальные примеры по экономической идее, которую они иллюстрируют.
Employment and unemployment · Занятость и безработица
Syllabus · Программа
English
explain the measurement, types and causes of unemployment and the natural rate of unemployment
explain the relationship between unemployment and inflation (the Phillips curve, short run and long run)
Русский
объясните методы измерения, виды и причины безработицы, а также естественный уровень безработицы
объясните связь между безработицей и инфляцией (кривая Филлипса, краткосрочная и долгосрочная)
Source: Cambridge International syllabus · Источник: Программа Cambridge International
English
unemployment 失业 is measured in two ways: the claimant count 申领救济人数 (people claiming benefits) and the wider labour force survey 劳动力调查 (a sample asked about work).
Types
frictional unemployment 摩擦性失业 — short spells between jobs.
structural unemployment 结构性失业 — skills no longer match the jobs, as industries decline.
cyclical unemployment 周期性失业 — caused by low demand in a recession.
seasonal unemployment 季节性失业 — work only at certain times of year.
The natural rate and the Phillips curve
The natural rate of unemployment 自然失业率 is the unemployment left when the labour market is in balance (mainly frictional and structural). It cannot be removed just by raising demand.
The Phillips curve 菲利普斯曲线 shows the link between unemployment and inflation:
in the short run, there is a trade-off: lower unemployment comes with higher inflation, because strong demand pushes up wages and prices.
in the long run, the curve is vertical at the natural rate. Once people expect inflation, there is no lasting trade-off — pushing unemployment below the natural rate only speeds up inflation.
Русский
безработица измеряется двумя способами: учет заявлений о пособии (люди, получающие пособия) и более широкая опрос рабочей силы (выборочное опрос о занятости).
Четыре вида безработицы: фрикционная, структурная, циклическая и сезонная
Типы
фрикционная безработица — кратковременные периоды между местами работы.
структурная безработица — навыки больше не соответствуют имеющимся вакансиям по мере спада отраслей.
циклическая безработица — вызвана низким спросом во время рецессии.
сезонная безработица — работа только в определенное время года.
Естественный уровень и кривая Филлипса
естественный уровень безработицы — это уровень безработицы, остающийся при равновесии на рынке труда (преимущественно фрикционная и структурная). Его нельзя устранить простым повышением спроса.
кривая Филлипса показывает связь между безработицей и инфляцией:
в краткосрочном периоде существует компромисс: снижение безработицы сопровождается ростом инфляции, поскольку сильный спрос толкает вверх зарплаты и цены.
в долгосрочном периоде кривая вертикальна на уровне естественной безработицы. Как только люди ожидают инфляцию, устойчивого компромисса нет — попытка снизить безработицу ниже естественного уровня лишь ускоряет инфляцию.
Краткосрочная кривая Филлипса показывает компромисс между безработицей и инфляцией; долгосрочная кривая вертикальна на естественном уровне.
Explore · Исследовать
Development chain lab · Лаборатория цепочки развития
Follow how policy and resources can change living standards. · Отслеживайте, как политика и ресурсы могут изменять уровень жизни.
natural rate of unemployment/ˈnætʃərəl reɪt ɒv ʌnemˈplɔɪmənt/
естественного уровня безработицы
Phillips curve/ˈfɪlɪps kɜːv/
кривая Филлипса
9.4
Money and banking · Деньги и банковская система
Syllabus · Программа
English
explain the functions and characteristics of money and the role of the central bank and commercial banks
explain the demand for money (liquidity preference), the money supply, and the determination of interest rates, including moral hazard
Русский
объясните функции и характеристики денег, а также роль центрального банка и коммерческих банков
объясните спрос на деньги (предпочтение ликвидности), денежную массу и определение процентных ставок, включая моральный риск
Source: Cambridge International syllabus · Источник: Программа Cambridge International
English
What money does
money 货币 is anything widely accepted in payment. It has four jobs:
a medium of exchange 交换媒介 — used to buy and sell, avoiding barter.
a store of value 价值储藏 — it keeps its worth over time, so you can save it.
a unit of account 记账单位 — a common way to measure and compare prices.
a standard of deferred payment 延期支付标准 — it lets people borrow and repay later.
Good money is durable, easy to carry, easy to divide, hard to fake, and limited in supply.
Banks
the central bank 中央银行 issues notes, runs monetary policy, holds the country's reserves, and acts as lender of last resort 最后贷款人 to banks in trouble.
commercial banks 商业银行 take deposits and make loans. By lending out most of what is deposited, the banking system creates money.
The demand for money and interest rates
People hold money rather than other assets for its liquidity 流动性 (it can be spent at once). The demand for money 货币需求 — also called liquidity preference 流动性偏好 — comes from the need to make everyday payments, to keep a safety buffer, and to be ready to buy assets.
The interest rate 利率 is the price of borrowing money. It is set where the demand for money meets the money supply 货币供给. A larger money supply tends to lower the interest rate.
Moral hazard
moral hazard 道德风险 is the danger that banks take bigger risks because they expect to be rescued if things go wrong. If a bank believes the government will bail it out, it may lend recklessly — knowing it keeps the gains but passes losses to others.
Русский
Что делают деньги
деньги — это всё, что широко принимается в качестве платежа. Они выполняют четыре функции:
средство обращения — используются для покупки и продажи, избегая бартера.
средство накопления стоимости — сохраняют свою ценность со временем, что позволяет их откладывать.
мера стоимости — общий способ измерения и сравнения цен.
средство отложенного платежа — позволяют людям брать кредиты и возвращать их позже.
Деньги выполняют четыре функции одновременно — без них торговля вернулась бы к медленному и неудобному бартеру
Хорошие деньги должны быть долговечными, удобными для переноски, легко делимыми, трудными для подделки и ограниченными в количестве.
Банки
центральный банк выпускает банкноты, проводит денежно-кредитную политику, хранит валютные резервы страны и выступает как кредитор последней инстанции для банков, испытывающих трудности.
коммерческие банки принимают депозиты и выдают кредиты. Выдавая большую часть принятых депозитов, банковская система создает деньги.
Коммерческие банки принимают депозиты и выдают кредиты — и за счет кредитования банковская система создает большую часть денег в экономике.
Спрос на деньги и процентные ставки
Люди держат деньги вместо других активов из-за их ликвидности (их можно потратить немедленно). Спрос на деньги — также называемый предпочтением ликвидности — возникает из необходимости совершать повседневные платежи, иметь запасной буфер и быть готовым к покупке активов.
процентная ставка — это цена заёмных денег. Она устанавливается там, где спрос на деньги встречается с денежным предложением. Увеличение денежного предложения, как правило, снижает процентную ставку.
Процентная ставка устанавливается там, где спрос на деньги встречается с денежным предложением; увеличение денежного предложения снижает её.
Моральный риск
моральный риск — это опасность того, что банки берут на себя более высокие риски, потому что рассчитывают на спасение в случае неудачи. Если банк верит, что правительство его поддержит, он может выдывать кредиты безрассудно — зная, что сохраняет прибыль, но перекладывает убытки на других.
Explore · Исследовать
Economics case lab · Лаборатория экономических кейсов
Classify real examples by the economic idea they show. · Классифицируйте реальные примеры по экономической идее, которую они иллюстрируют.
This topic pulls the macroeconomics together: the goals a government has, how they clash, and how well its tools work.
10.1
Objectives and the tools to reach them
Syllabus · Программа
English
state and explain the macroeconomic policy objectives and how they are measured
explain the use of fiscal, monetary and supply-side policy to achieve the objectives
Русский
назвать и объяснить цели макроэкономической политики и способы их измерения
объяснить применение фискальной, монетарной и политики предложения для достижения целей
Source: Cambridge International syllabus · Источник: Программа Cambridge International
Governments aim at several macroeconomic objectives 宏观经济目标 at once:
Fiscal and monetary policy act on demand; supply-side on capacityThe four macroeconomic objectives
Objective
How it is measured
economic growth 经济增长
the % change in real GDP
price stability 物价稳定 (low inflation 通货膨胀)
the % change in the consumer price index
full employment 充分就业
the unemployment rate
balance of payments 国际收支 stability
the current account balance
To reach these goals, the government uses three sets of tools:
fiscal policy 财政政策 — changing government spending and taxes.
monetary policy 货币政策 — changing the interest rate 利率 and the money supply.
supply-side policy 供给侧政策 — raising the economy's capacity and productivity.
Fiscal and monetary policy mainly work on aggregate demand 总需求, so they are quick but can cause inflation. Supply-side policy works on capacity, so it is slow but lasting.
Central banks, such as the European Central Bank, are a main tool of macroeconomic policy.
explain the links and trade-offs between macroeconomic problems (e.g. growth and inflation, unemployment and inflation, growth and the balance of payments)
analyse the interrelatedness of macroeconomic objectives
Русский
объяснить связи и компромиссы между макроэкономическими проблемами (например, рост и инфляция, безработица и инфляция, рост и платежный баланс)
проанализировать взаимозависимость макроэкономических целей
Source: Cambridge International syllabus · Источник: Программа Cambridge International
The objectives are interrelated — reaching one can move another. Often there is a trade-off 取舍, a conflict 冲突 where gaining on one goal costs you on another.
unemployment versus inflation. Raising demand to cut unemployment tends to push prices up. The Phillips curve 菲利普斯曲线 shows this short-run trade-off. (In the long run it may disappear.)
growth versus inflation. Fast demand-led growth can overheat the economy and cause inflation.
growth versus the balance of payments. As incomes rise, people buy more imports, so the current account can worsen.
growth versus the environment. More output often means more pollution and use of resources.
growth versus equality. Growth does not always reach everyone, so the income gap can widen.
The objectives pull against each other, so a government must trade one off against another — there is rarely a way to win on all of them at once
Because the goals are linked, a government must often accept "second best" on one aim to protect another. A clever policy mix tries to ease the trade-offs — for example, supply-side policy can raise growth and lower inflation, easing the usual clash.
evaluate the effectiveness of fiscal, monetary and supply-side policies in achieving the macroeconomic objectives
explain the limitations of policies (time lags, conflicts, crowding out, the Laffer curve)
Русский
оценить эффективность фискальной, монетарной и политики предложения в достижении макроэкономических целей
объяснить ограничения политик (временные лаги, конфликты, вытеснение частной деятельности, кривая Лаффера)
Source: Cambridge International syllabus · Источник: Программа Cambridge International
Each tool has strengths and weaknesses.
Financial markets react quickly to policy, which affects how well a policy works.
Fiscal policy
It can act directly and powerfully on demand, and it can target particular groups or regions. But:
it suffers time lags 时滞 — a budget is set once a year, and the effects take time.
large deficits add to the national debt 国债.
it can cause crowding out 挤出效应 — heavy government borrowing raises interest rates and reduces private investment.
Heavy government borrowing shifts the demand for loanable funds right, raising the interest rate ($r_0 \to r_1$) and crowding out private investment.
The Laffer curve 拉弗曲线 is a useful warning. It shows that as the tax rate rises, tax revenue 税收收入 first rises but then falls: very high rates discourage work and encourage tax avoidance, so revenue drops. There is a tax rate that raises the most revenue, and going above it is self-defeating.
Tax revenue is zero at both a 0% and a 100% tax rate; it peaks at the rate $t^*$, and pushing rates above $t^*$ actually lowers revenue.
Monetary policy
It is flexible — the interest rate can be changed at any time. But it also works with a long time lag, and in a deep slump even very low rates may fail to make worried firms and households borrow.
Supply-side policy
It is the only tool that can raise growth and lower inflation together, with no trade-off. But it is slow (education and training take years), it is costly, and some measures (like cutting benefits) can widen inequality.
Putting it together
No single policy can hit every target. The objectives conflict, the effects come with delays, and the future is uncertain. So governments usually combine demand-side policies 需求侧政策 (fiscal and monetary) for the short term with supply-side policy for the long term, and accept that some goals must be traded against others.
Worked example. A government cuts interest rates to reduce unemployment. Which other objective is put at risk, and why? Lower rates make borrowing cheaper and saving less attractive, so consumption and investment rise: aggregate demand rises, output rises, and unemployment falls. But that same rise in demand pulls prices up, especially as the economy nears full capacity - so the objective at risk is low inflation. This is the classic Phillips curve trade-off: lower unemployment bought at the price of higher inflation. It also tends to worsen the current account, because richer consumers buy more imports. Name the objective at risk and the mechanism joining the two - and remember that a supply-side policy is the one tool that can improve both objectives at once, which is usually the evaluation the question is fishing for.
Explore · Исследовать
Economics case lab · Лаборатория экономических кейсов
Classify real examples by the economic idea they show. · Классифицируйте реальные примеры по экономической идее, которую они иллюстрируют.
This final topic covers trade imbalances, exchange rates in depth, and how countries develop and connect.
11.1
Correcting a balance of payments imbalance
Syllabus · Программа
English
explain expenditure-switching and expenditure-reducing policies and the Marshall–Lerner condition and J-curve effect
evaluate policies to correct a current account imbalance
Русский
объяснить политики перераспределения расходов и политики сокращения расходов, а также условие Маршалла–Лернера и эффект J-кривой
оценить политику устранения дисбаланса текущего счета
Source: Cambridge International syllabus · Источник: Программа Cambridge International
A country with a large balance of payments 国际收支 problem — usually a deficit on the current account 经常账户 — can use two kinds of policy.
expenditure-reducing 支出减少 policies cut total demand (higher taxes or interest rates). With less spending, people buy fewer imports. But growth slows and unemployment may rise.
expenditure-switching 支出转换 policies move spending away from imports towards home goods. The main tool is a lower exchange rate 汇率 — a depreciation 贬值 under floating rates, or a devaluation 法定贬值 under a fixed system — which makes exports cheaper and imports dearer.
Two routes out of a deficit: spend less overall, or switch spending to home goods
The Marshall–Lerner condition and the J-curve
A lower exchange rate only improves the current account if buyers respond enough. The Marshall-Lerner condition 马歇尔勒纳条件 says the sum of the price elasticities of demand for exports and imports must be greater than one:
Worked example. After a depreciation, the demand for a country's exports has $PED = 0.6$ and its demand for imports has $PED = 0.7$. Will the current account improve?
$$0.6 + 0.7 = 1.3 > 1,$$
so the Marshall-Lerner condition is met, and the depreciation should improve the current account in the long run. (If the two elasticities had summed to less than $1$ — for example $0.3 + 0.4 = 0.7$ — a depreciation would make the deficit worse.)
Even when this holds, the gain takes time. The J-curve effect J曲线效应 describes what happens: just after a depreciation, the current account first gets worse (imports cost more straight away, but trade volumes are slow to change), then later improves as buyers adjust — tracing the shape of a letter J.
After a depreciation the current account first worsens (imports cost more at once), then improves as trade volumes adjust — tracing a letter J.
Explore · Исследовать
Economics case lab · Лаборатория экономических кейсов
Classify real examples by the economic idea they show. · Классифицируйте реальные примеры по экономической идее, которую они иллюстрируют.
explain nominal, real and trade-weighted (effective) exchange rates and how they are determined
explain fixed, floating and managed exchange rate systems, devaluation/revaluation and the effects of exchange rate changes
Русский
объяснить номинальный, реальный и торговый (взвешенный/эффективный) валютные курсы и способы их определения
объяснить системы фиксированного, плавающего и управляемого валютных курсов, девальвацию/ревальвацию и последствия изменений валютных курсов
Source: Cambridge International syllabus · Источник: Программа Cambridge International
Exchange rates: appreciation
An exchange rate is the price of one currency in terms of another. There is more than one way to measure it:
the nominal exchange rate 名义汇率 is the everyday market rate between two currencies.
the real exchange rate 实际汇率 adjusts the nominal rate for differences in prices between the countries, so it shows true competitiveness.
the trade-weighted exchange rate 贸易加权汇率, also called the effective exchange rate 有效汇率, is an average of a currency's value against all its trading partners, weighted by how much trade is done with each.
The three systems
a floating exchange rate 浮动汇率 is set by the demand for and supply of the currency.
a fixed exchange rate 固定汇率 is held at a set value by the central bank.
a managed exchange rate 管理浮动汇率 mostly floats, with the central bank stepping in at times.
Under floating rates, a rise in value is an appreciation 升值 and a fall is a depreciation. Under a fixed system, a deliberate rise is a revaluation 法定升值 and a deliberate fall is a devaluation. A weaker currency tends to raise exports and inflation; a stronger currency does the opposite.
The three exchange-rate systems, and the words for a rise or fall in each
Explore · Исследовать
Exchange rates in the FX market · Обменные курсы на рынке FOREX
The exchange rate is set by the demand for and supply of the currency. Shift either to see the rate appreciate or depreciate. · Обменный курс определяется спросом и предложением валюты. Сдвиньте одно из них, чтобы увидеть appreciation или depreciation курса.
distinguish economic growth and economic development and explain the characteristics of development
explain indicators of development including the Human Development Index (HDI) and other measures
Русский
различать экономический рост и экономическое развитие и объяснить характеристики развития
объяснить показатели развития, включая Индекс человеческого развития (ИЧР) и другие меры
Source: Cambridge International syllabus · Источник: Программа Cambridge International
It is important not to confuse two ideas:
Growth is more income; development is wider wellbeing too
economic growth 经济增长 is simply a rise in real output.
economic development 经济发展 is wider. It is about people's standard of living 生活水平 — their health, education, and freedom of choice, not just their income.
Economic development is wider than growth: it is about living standards in a fast-growing developing economy.
A country can grow without developing much (if the extra income goes to a few people). Development usually means rising incomes plus better health, more schooling, and less poverty.
Measuring development
The best-known measure is the Human Development Index 人类发展指数 (HDI). It combines three things into one number between 0 and 1:
income (GNI per person),
health (life expectancy 预期寿命 at birth),
education (mean and expected years of schooling 受教育年限).
The HDI rolls income, health and education into one number — so it captures living standards far better than income alone
Other useful signs of development include access to clean water, the number of doctors per person, and mobile-phone and internet use.
Explore · Исследовать
Development chain lab · Лаборатория цепочки развития
Follow how policy and resources can change living standards. · Отслеживайте, как политика и ресурсы могут изменять уровень жизни.
Human Development Index/ˈhjuːmən dɪˈveləpmənt ˈɪndeks/
Индекс развития человеческого потенциала
life expectancy/laɪf ekˈspektənsi/
продолжительность жизни
years of schooling/jɪəz ɒv ˈskuːlɪŋ/
количество лет обучения
11.4
Comparing countries at different levels of development
Syllabus · Программа
English
compare the economic and demographic characteristics of countries at different levels of development (income, population, employment structure, education, health)
explain the factors that influence the level of development
Русский
сравнить экономические и демографические характеристики стран на разных уровнях развития (доход, население, структура занятости, образование, здравоохранение)
объяснить факторы, влияющие на уровень развития
Source: Cambridge International syllabus · Источник: Программа Cambridge International
We often compare a developed country 发达国家 (high income, like Germany) with a developing country 发展中国家 (lower income, like Kenya). They differ in clear ways:
Feature
Developed
Developing
income per person
high
low
birth rate 出生率 and population growth
low
often high
life expectancy
high
lower
share of workers in farming
small
large
The employment structure 就业结构 also differs. As a country develops, workers move out of the primary sector 第一产业 (farming and mining), into the secondary sector 第二产业 (making goods), and later into the tertiary sector 第三产业 (services).
As a country develops, workers shift out of the primary sector and into the secondary and then the tertiary (services) sector.
Many things shape development: savings and investment, the quality of education and health, infrastructure, stable government and law, and access to world markets.
Explore · Исследовать
Economics case lab · Лаборатория экономических кейсов
Classify real examples by the economic idea they show. · Классифицируйте реальные примеры по экономической идее, которую они иллюстрируют.
explain the relationship between developed and developing countries through trade, aid, debt, foreign direct investment and multinationals, and migration/remittances
evaluate the impact of these relationships on development
Русский
объяснить взаимоотношения между развитыми и развивающимися странами через торговлю, помощь, долг, прямые иностранные инвестиции и транснациональные корпорации, а также миграцию/денежные переводы
оценить влияние этих взаимоотношений на развитие
Source: Cambridge International syllabus · Источник: Программа Cambridge International
Richer and poorer countries are linked in several ways, each with good and bad sides.
trade can raise incomes, but many developing countries rely on a few primary exports whose prices swing sharply.
foreign aid 援助 can fund schools and roads, but it may create dependency or be wasted.
debt 债务 owed to other countries can pay for development, but repaying it can drain a poor country's budget.
foreign direct investment 外国直接投资 (FDI) by a multinational corporation 跨国公司 brings money, jobs and technology, but profits may flow back abroad and workers may be poorly treated.
migration 移民 of workers can ease unemployment and bring in remittances 侨汇 (money sent home), but it can also drain a country of its most skilled people.
Explore · Исследовать
Economics case lab · Лаборатория экономических кейсов
Classify real examples by the economic idea they show. · Классифицируйте реальные примеры по экономической идее, которую они иллюстрируют.
explain globalisation and its causes and the role of multinational corporations and trade blocs
evaluate the benefits and costs of globalisation for developed and developing economies
Русский
объяснить глобализацию и её причины, а также роль транснациональных корпораций и торговых союзов
оценить выгоды и издержки глобализации для развитых и развивающихся экономик
Source: Cambridge International syllabus · Источник: Программа Cambridge International
globalisation 全球化 is the growing links between countries — in trade, money, technology and people — so that the world acts more like one market. Its causes include cheaper transport and communication, free trade 自由贸易 agreements, and the spread of multinational firms.
Countries often join a trade bloc 贸易集团 — a group that trades freely among themselves (like the European Union).
Globalisation: falling trade and transport costs tie national economies together.
Benefits and costs
Benefits
Costs
lower prices and more choice
some industries and jobs are lost to cheaper countries
faster growth and technology transfer
the gap between rich and poor can widen
larger markets for firms
more pollution and use of resources
poorer countries can industrialise
powerful multinationals may avoid tax and dodge protectionism 贸易保护主义 rules
Globalisation helps developed and developing economies in different ways, but the gains are not shared evenly, which is why it remains so argued about.
Explore · Исследовать
Open economy lab · Лаборатория открытой экономики
See how trade or exchange-rate pressure changes domestic outcomes. · Посмотрите, как давление торговли или обменного курса меняет внутренние результаты.
Pick one and the site follows you — notes, papers, videos and practice all open on it. · Выберите один, и сайт будет вести вас — конспекты, работы, видео и практика откроются там.
Type to search notes, lessons, code, vocabulary and past-paper questions across every subject. · Введите запрос для поиска заметок, уроков, кода, словаря и вопросов с реальных экзаменов по всем предметам.