This topic studies the wider economy at A Level depth: how spending multiplies, how growth links to the environment, the jobs–prices link, and money.
The macroeconomy (A Level)
A-Level Economics · Topic 9
 8:33
The macroeconomy (A Level)
Look at one building going up. Someone is paying for steel, for concrete, for wages. But the story does not stop there. The builders take those wages home and…
English narration · English + 中文 subtitles burned in
9.1
The circular flow and the multiplier

Syllabus
- explain the circular flow of income, injections and leakages, and the multiplier (including the marginal propensities)
- explain the accelerator and the determinants of consumption, saving and investment
Source: Cambridge International syllabus
The circular flow of income 收入循环流 shows money passing between households and firms. injections 注入 add money to the flow (investment, government spending, exports); leakages 漏出 take it out (saving, taxation, imports).
The multiplier
An injection raises income by more than the first amount. This is the multiplier 乘数. When a firm builds a factory, the builders earn income, and they spend part of it, which becomes someone else's income, and so on.
How much is spent again depends on the marginal propensity to consume 边际消费倾向 (MPC) — the fraction of extra income that people spend on home goods. The rest leaks out. In a simple model:
$$\text{multiplier} = \frac{1}{1 - MPC}$$
A bigger MPC (smaller leakages) gives a bigger multiplier. The leakages are measured by the marginal propensity to save 边际储蓄倾向 (MPS), the marginal propensity to tax 边际税收倾向 (MPT) and the marginal propensity to import 边际进口倾向 (MPM). In an open economy with a government, all three count:
$$\text{multiplier} = \frac{1}{MPS + MPT + MPM} = \frac{1}{MPW},$$
where MPW is the marginal propensity to withdraw 边际漏出倾向.
Worked example. In an economy the MPC is $0.8$. Find the multiplier, then the effect of a $\text{\pounds} 10$ billion rise in investment.
$$\text{multiplier} = \frac{1}{1 - 0.8} = \frac{1}{0.2} = 5.$$
National income therefore rises by $5 \times \text{\pounds} 10\text{ billion} = \text{\pounds} 50\text{ billion}$ — five times the original injection. (In this simple model with no taxes or imports, all income is either spent or saved, so $\text{MPC} + \text{MPS} = 1$, here $\text{MPS} = 0.2$, and the multiplier is also $1/\text{MPS}$. If MPS were 0.1, MPT 0.15 and MPM 0.25, the multiplier would be $1/0.5 = 2$.)

The accelerator
The accelerator 加速数 says that investment 投资 depends on the rate of change of output. When demand is rising quickly, firms need lots of new capital, so investment jumps. When demand merely stays high, investment falls back.
Worked accelerator example. A firm needs one machine for every 100 units of yearly output, and one old machine wears out each year. Net investment 净投资 adds to the capital stock; replacement investment 重置投资 replaces worn-out machines.
| Year | Output | Machines needed | Net investment | Replacement | Gross investment |
|---|---|---|---|---|---|
| 1 | 1,000 | 10 | — | 1 | — |
| 2 | 1,200 | 12 | 2 | 1 | 3 |
| 3 | 1,300 | 13 | 1 | 1 | 2 |
| 4 | 1,300 | 13 | 0 | 1 | 1 |
Output grows by 20% and then by about 8%, but gross investment falls from 3 machines to 2 (a 33% fall). When output stops growing, investment falls again, to 1. Output never falls, yet investment shrinks: only a slower rise in output is needed to cut investment. The accelerator and the multiplier feed each other, which helps explain why the economy moves in cycles.
What drives consumption, saving and investment
- consumption 消费 and saving 储蓄 depend on disposable income 可支配收入 (income after tax), wealth, interest rates, and confidence.
- investment depends on interest rates, expected profit, technology, and business confidence.
Explore
The circular flow and the multiplier
Income circles between households and firms. An injection (e.g. investment) is re-spent again and again — the multiplier effect.
Explore
Income rounds and the multiplier’s assumptions
$\Delta Y=k\Delta J$
Compare the first few income rounds with the infinite model total. Domestic re-spending and total consumption must be distinguished when tax and imports are present.
Vocabulary
Train
| English |
|---|
| circular flow of income/ˈsɜːkjʊlə fləʊ ɒv ˈɪŋkʌm/ |
| injections/ɪnˈdʒekʃnz/ |
| leakages/ˈliːkɪdʒɪz/ |
| multiplier/ˌmʌltɪˈplaɪə/ |
| marginal propensity to consume/ˈmɑːdʒɪnl prəˈpensɪti tə kənˈsjuːm/ |
| marginal propensity to save/ˈmɑːdʒɪnl prəˈpensɪti tə seɪv/ |
| marginal propensity to tax |
| marginal propensity to import/ˈmɑːdʒɪnl prəˈpensɪti tʊ ɪmˈpɔːt/ |
| marginal propensity to withdraw/ˈmɑːdʒɪnl prəˈpensɪti tə wɪθˈdrɔː/ |
| accelerator/əkˈseləreɪtə/ |
| investment/ɪnˈvestmənt/ |
| net investment/net ɪnˈvestmənt/ |
| replacement investment |
| consumption/kənˈsʌmpʃn/ |
| saving/ˈseɪvɪŋ/ |
| disposable income/dɪˈspəʊzəbl ˈɪŋkʌm/ |
9.2
Economic growth and sustainability
Syllabus
- distinguish actual and potential growth, output gaps and sustainable growth
- explain the costs and benefits of growth and the relationship between growth and sustainability
Source: Cambridge International syllabus
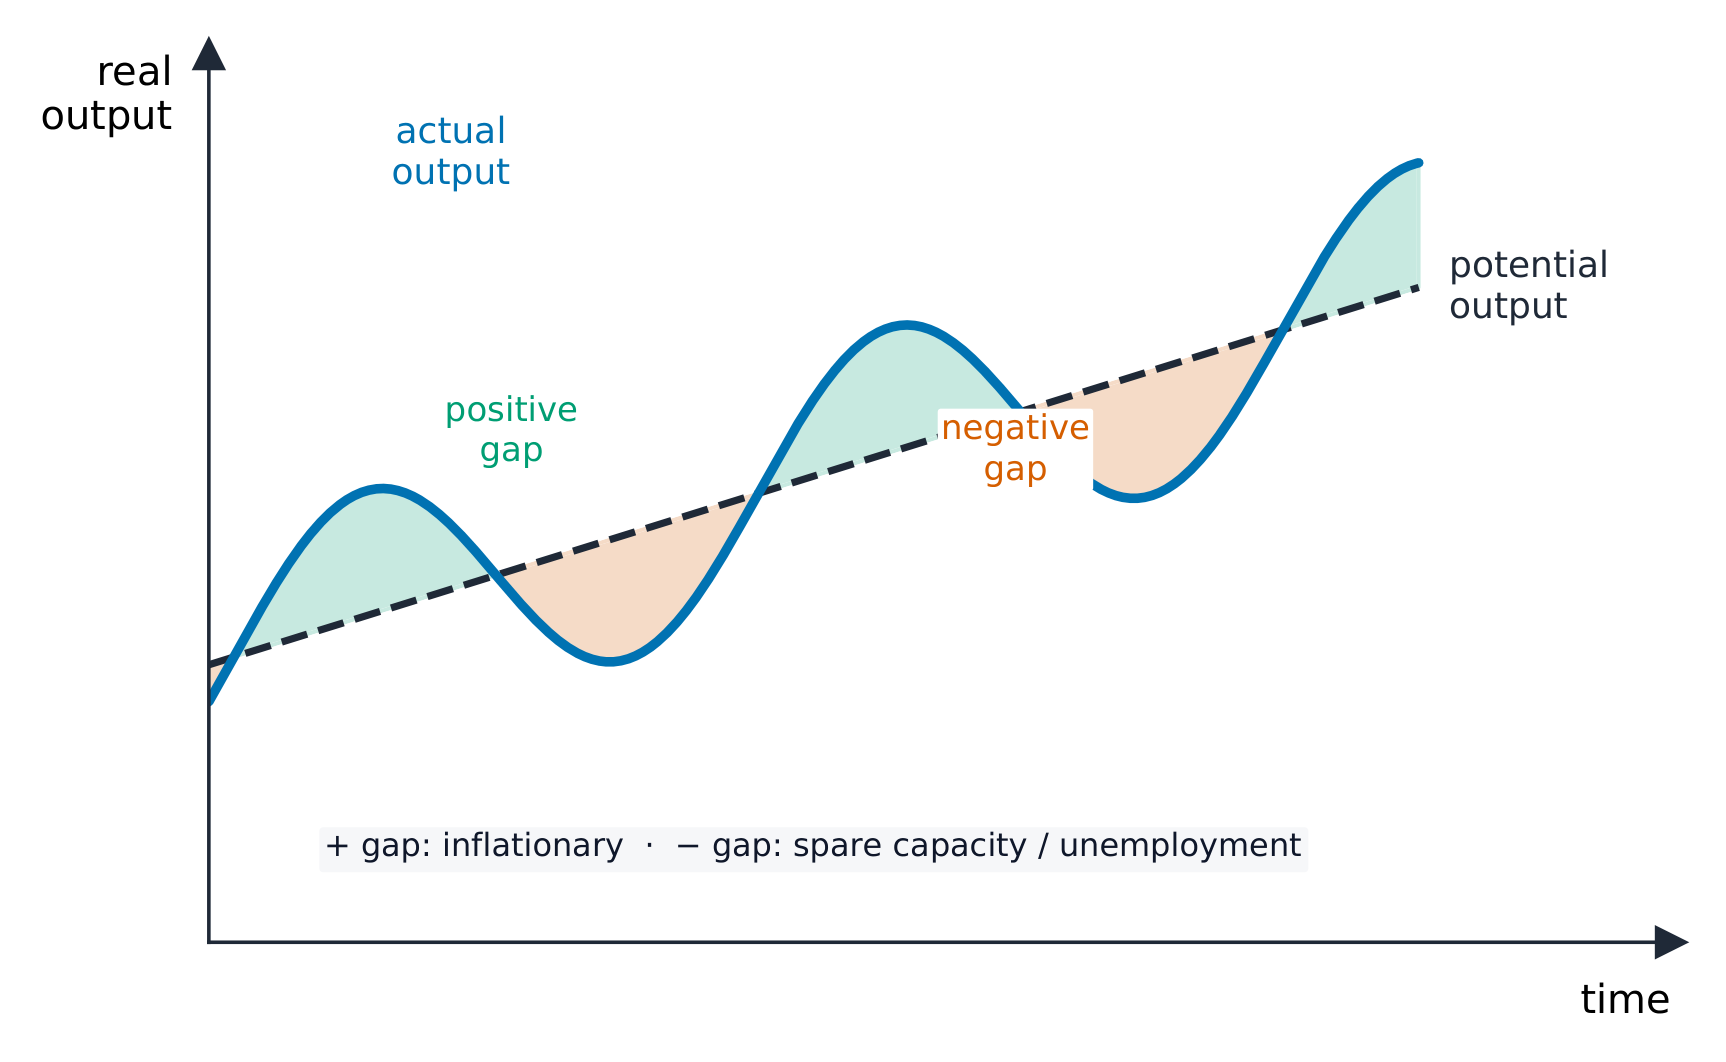
economic growth 经济增长 is a rise in real output.
- actual growth 实际增长 is the real rise in output that happens.
- potential growth 潜在增长 is the rise in the economy's capacity.
The output gap 产出缺口 compares actual real output with potential output: the level sustainable with normal use of resources. A positive gap creates inflationary pressure as spare capacity runs out. A negative gap suggests unused capacity and cyclical unemployment; it does not mean inflation must be zero, or that all unemployment is cyclical. Potential output is estimated and can be revised.
Worked output-gap comparison. Illustrative real GDP figures, all billions at constant prices on the same basis, are A: actual 190, potential 200; B: actual 198, potential 210; C: actual 214, potential 210. Express each gap relative to potential output:
$$\text{Gap (\%)}=\frac{Y-Y^*}{Y^*}\times100.$$
$$\text{Gap}_A=\frac{Y_A-Y_A^*}{Y_A^*}\times100=\frac{190-200}{200}\times100=-5\%.$$
$$\text{Gap}_B=\frac{Y_B-Y_B^*}{Y_B^*}\times100=\frac{198-210}{210}\times100\approx-5.71\%.$$
$$\text{Actual growth}_{A\to B}=\frac{Y_B-Y_A}{Y_A}\times100=\frac{198-190}{190}\times100\approx4.21\%.$$
$$\text{Potential growth}_{A\to B}=\frac{Y_B^*-Y_A^*}{Y_A^*}\times100=\frac{210-200}{200}\times100=5\%.$$
Actual output grew, but capacity grew faster, so the negative percentage gap widened. Actual growth does not necessarily close a gap.
$$\text{Gap}_C=\frac{Y_C-Y_C^*}{Y_C^*}\times100=\frac{214-210}{210}\times100\approx1.90\%.$$
Temporary overtime and intensive equipment use can lift actual output above its estimated sustainable level. The positive gap suggests demand pressure, not a precise inflation forecast. Neither growth nor a gap's sign alone establishes environmental sustainability.
Sustainability
sustainable growth 可持续增长 is growth that meets today's needs without harming the ability of future generations to meet theirs. Fast growth can use up non-renewable resources and cause pollution, which threatens sustainability 可持续性. So a country must weigh growth today against the environment and resources of tomorrow.

Explore
Economics case lab
Classify real examples by the economic idea they show.
Vocabulary
Train
| English |
|---|
| economic growth/ˌiːkəˈnɒmɪk ɡrəʊθ/ |
| actual growth/ˈæktʃuːəl ɡrəʊθ/ |
| potential growth/pəˈtenʃl ɡrəʊθ/ |
| output gap/ˈaʊtpʊt ɡæp/ |
| sustainable growth/səˈsteɪnəbl ɡrəʊθ/ |
| sustainability/səˌsteɪnəˈbɪlɪti/ |
9.3
Employment and unemployment

Syllabus
- explain the measurement, types and causes of unemployment and the natural rate of unemployment
- explain the relationship between unemployment and inflation (the Phillips curve, short run and long run)
Source: Cambridge International syllabus
unemployment 失业 is measured in two ways: the claimant count 申领救济人数 (people claiming benefits) and the wider labour force survey 劳动力调查 (a sample asked about work).
Types
- frictional unemployment 摩擦性失业 — short spells between jobs.
- structural unemployment 结构性失业 — skills no longer match the jobs, as industries decline.
- cyclical unemployment 周期性失业 — caused by low demand in a recession.
- seasonal unemployment 季节性失业 — work only at certain times of year.
The natural rate and the Phillips curve
The natural rate of unemployment 自然失业率 is the unemployment left when the labour market is in balance (mainly frictional and structural). It cannot be removed just by raising demand.
The Phillips curve 菲利普斯曲线 relates the inflation rate to the unemployment rate. In a short-run demand expansion, lower unemployment may accompany higher inflation, holding expected inflation and supply conditions constant. This is not a universal relation between employment and the price level.
Worked expectations model. Use the illustrative equation below. Here $\pi$ is actual annual inflation (%), $\pi^e$ is expected inflation (%), $u$ is unemployment (%), and the assumed natural rate is 5%. The coefficient is illustrative, not an estimated law for every economy.
$$\pi=\pi^e-0.5(u-5).$$
At unchanged expected inflation of 2%:
$$\pi_A=\pi^e-0.5(u_A-5)=2-0.5(5-5)=2\%.$$
$$\pi_B=\pi^e-0.5(u_B-5)=2-0.5(3-5)=3\%.$$
A demand expansion may move A to B along the same short-run curve: unemployment falls by 2 percentage points and inflation rises by 1 percentage point. Inflation of 2% still means prices rise; falling inflation is not necessarily falling prices.
When expected inflation rises to 3%, at unemployment of 5%:
$$\pi_C=\pi^e-0.5(u_C-5)=3-0.5(5-5)=3\%.$$
The same unemployment now accompanies higher inflation. The short-run curve shifts up (right), rather than showing a movement along the old curve. Holding unemployment at 3% under the new expectations gives:
$$\pi_D=\pi^e-0.5(u_D-5)=3-0.5(3-5)=4\%.$$
In this expectations-augmented model, repeated demand stimulus cannot maintain unemployment below an unchanged natural rate without rising inflation as expectations adjust. When actual and expected inflation are equal:
$$\pi=\pi^e-0.5(u-5),\quad\pi=\pi^e\quad\Rightarrow\quad u=5\%.$$
Different fully expected inflation rates are compatible with the same natural rate. The long-run curve is vertical at 5% in this example; full employment does not mean zero unemployment. Better matching, training or mobility may change the natural rate and shift the long-run curve. An adverse oil-cost shock can raise inflation while reducing output and employment, shifting the short-run relationship instead of tracing a stable demand trade-off. State what is held constant before predicting the effect of a policy. This model also supports the policy-conflict discussion in Topic 10.

Explore
Development chain lab
Follow how policy and resources can change living standards.
Vocabulary
Train
| English |
|---|
| unemployment/ʌnemˈplɔɪmənt/ |
| claimant count/ˈkleɪmənt kaʊnt/ |
| labour force survey/ˈleɪbə fɔːs ˈsɜːveɪ/ |
| frictional unemployment/ˈfrɪkʃənl ʌnemˈplɔɪmənt/ |
| structural unemployment/ˈstrʌktʃərəl ʌnemˈplɔɪmənt/ |
| cyclical unemployment/ˈsaɪklɪkl ʌnemˈplɔɪmənt/ |
| seasonal unemployment/ˈsiːzənl ʌnemˈplɔɪmənt/ |
| natural rate of unemployment/ˈnætʃərəl reɪt ɒv ʌnemˈplɔɪmənt/ |
| Phillips curve/ˈfɪlɪps kɜːv/ |
9.4
Money and banking
Syllabus
- explain the functions and characteristics of money and the role of the central bank and commercial banks
- explain the demand for money (liquidity preference), the money supply, and the determination of interest rates, including moral hazard
Source: Cambridge International syllabus
What money does
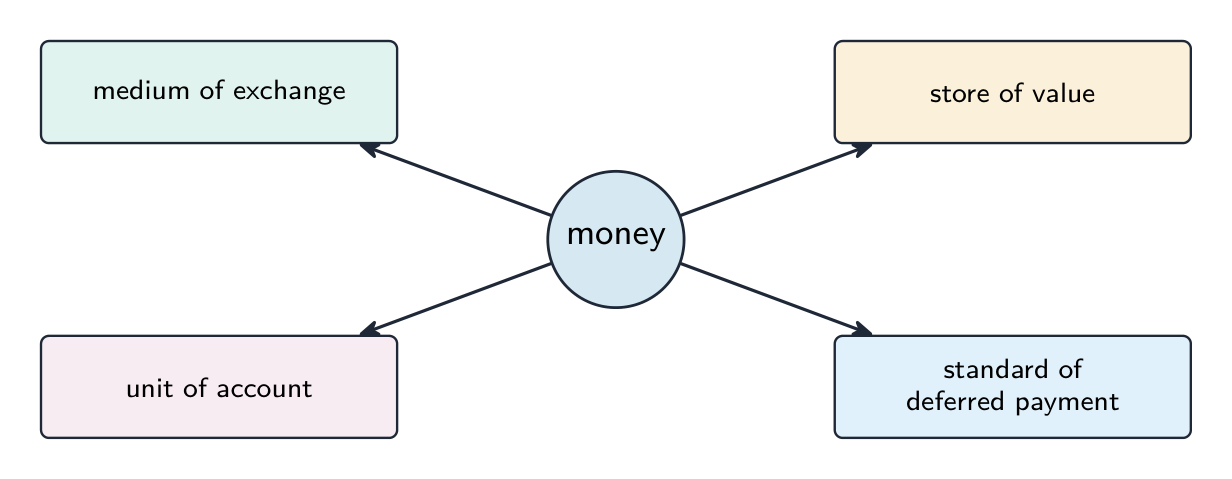
money 货币 is anything widely accepted in payment. It has four jobs:
- a medium of exchange 交换媒介 — used to buy and sell, avoiding barter.
- a store of value 价值储藏 — it keeps its worth over time, so you can save it.
- a unit of account 记账单位 — a common way to measure and compare prices.
- a standard of deferred payment 延期支付标准 — it lets people borrow and repay later.
Good money is durable, easy to carry, easy to divide, hard to fake, and limited in supply.
Banks
- the central bank 中央银行 issues notes, runs monetary policy, holds the country's reserves, and acts as lender of last resort 最后贷款人 to banks in trouble.
- commercial banks 商业银行 take deposits and make loans. When a bank makes a loan, it records a loan asset and creates a matching deposit in the borrower's account. Repaying loan principal cancels that amount of deposit money. Lending is limited by capital, liquidity, risk, profitability and demand.

The demand for money and interest rates
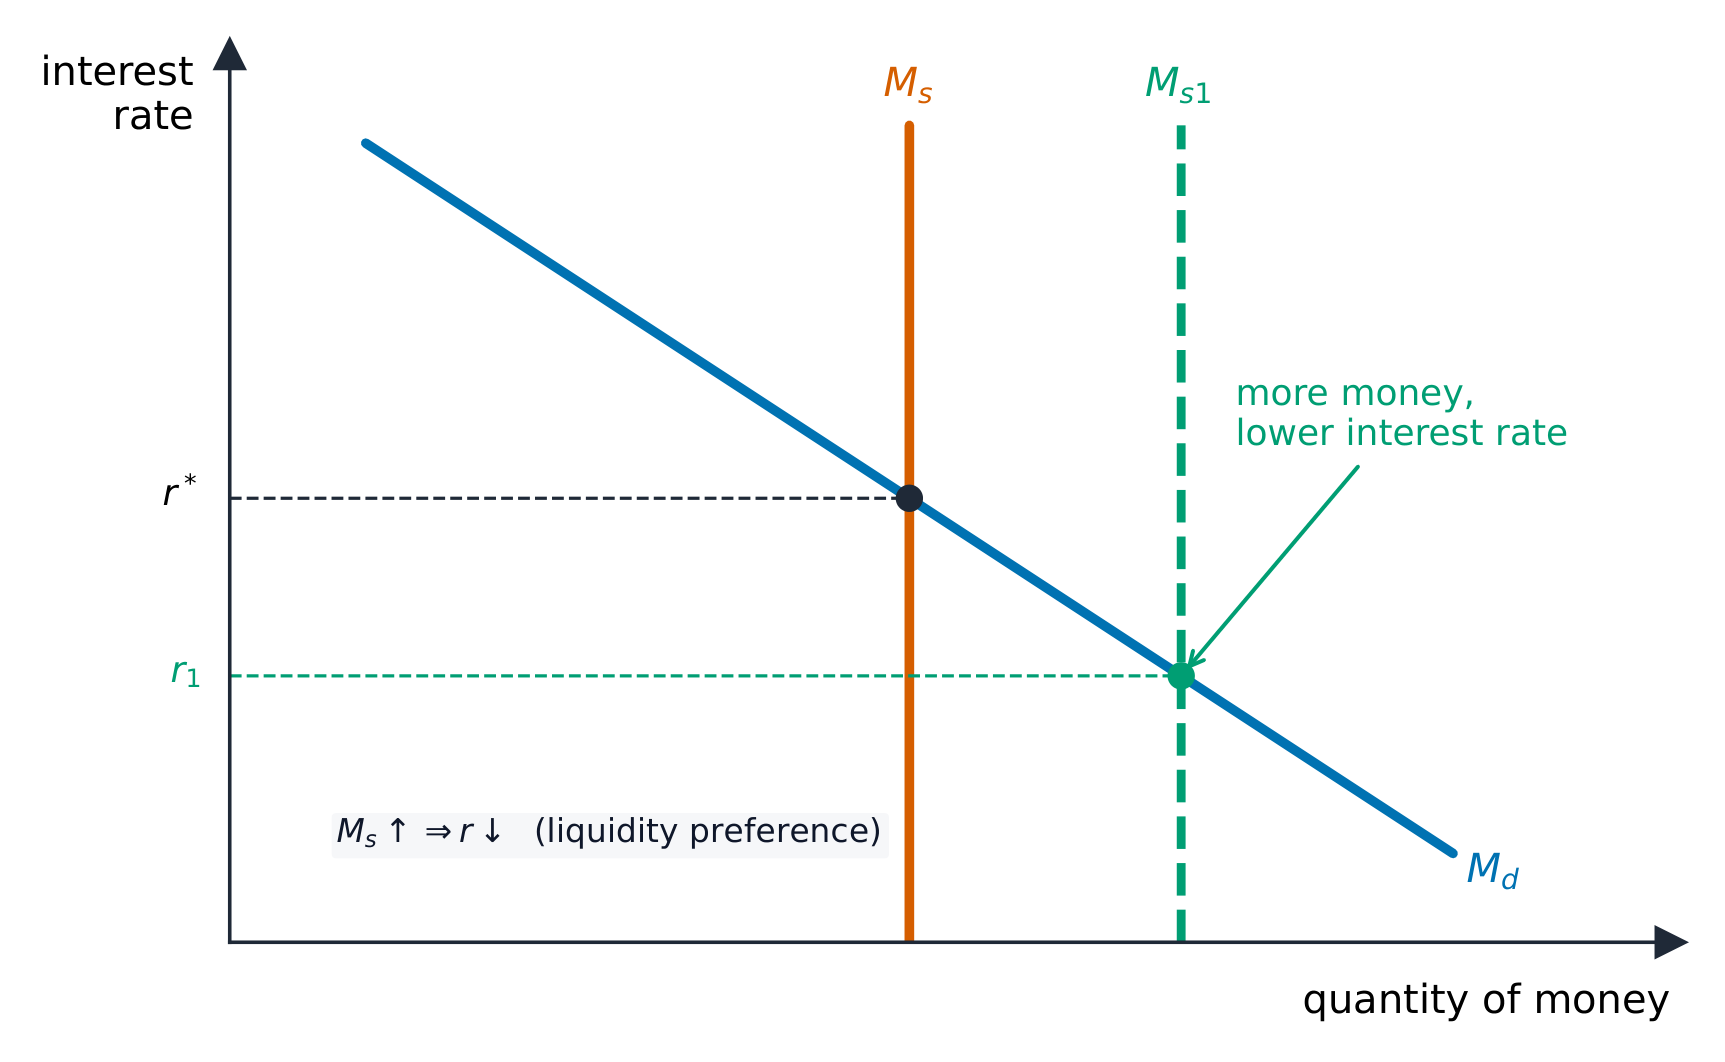
People hold money rather than other assets for its liquidity 流动性 (it can be spent at once). The demand for money 货币需求 — also called liquidity preference 流动性偏好 — comes from the need to make everyday payments, to keep a safety buffer, and to be ready to buy assets.
The interest rate 利率 is the price of borrowing money. It is set where the demand for money meets the money supply 货币供给. A larger money supply tends to lower the interest rate.
Moral hazard
moral hazard 道德风险 is the danger that banks take bigger risks because they expect to be rescued if things go wrong. If a bank believes the government will bail it out, it may lend recklessly — knowing it keeps the gains but passes losses to others.
A real case. In the 2008 financial crisis the US government let Lehman Brothers fail, and the shock spread through world markets. Other governments then rescued banks: the UK took large stakes in the Royal Bank of Scotland and Lloyds. The rescues protected savers and stopped a wider collapse, but they also showed large banks that they might be "too big to fail". To reduce moral hazard, regulators now require banks to hold more capital, and new rules make a failing bank's shareholders and bondholders bear losses before taxpayers do.
Explore
Economics case lab
Classify real examples by the economic idea they show.
Vocabulary
Train
| English |
|---|
| money/ˈmʌni/ |
| medium of exchange/ˈmiːdɪəm ɒv eksˈtʃeɪndʒ/ |
| store of value/stɔː ɒv ˈvæljuː/ |
| unit of account/ˈjuːnɪt ɒv əˈkaʊnt/ |
| standard of deferred payment/ˈstændəd ɒv dɪˈfɜːd ˈpeɪmənt/ |
| central bank/ˈsentrəl bæŋk/ |
| lender of last resort/ˈlendə ɒv læst rɪˈzɔːt/ |
| commercial bank/kəˈmɜːʃl bæŋk/ |
| liquidity/lɪˈkwɪdɪti/ |
| demand for money/dɪˈmænd fɔː ˈmʌni/ |
| liquidity preference/lɪˈkwɪdɪti ˈprefrəns/ |
| interest rate/ˈɪntrest reɪt/ |
| money supply/ˈmʌni səˈplaɪ/ |
| moral hazard/ˈmɒrəl ˈhæzəd/ |
9.1
Model essay plan (Paper 4 style)
Syllabus
- explain the circular flow of income, injections and leakages, and the multiplier (including the marginal propensities)
- explain the accelerator and the determinants of consumption, saving and investment
Source: Cambridge International syllabus
"An increase in government spending will always raise national income by the full value of the multiplier." Discuss.
- Define and explain. Define the multiplier and show the mechanism: spending becomes income, part of which is spent again. Calculate an example: with MPS 0.1, MPT 0.15 and MPM 0.25, a £10 billion rise in government spending raises income by $10 \times \tfrac{1}{0.5} = 20$ billion. Use AD/AS: AD shifts right.
- When the full effect is likely. A large negative output gap (spare capacity), so extra demand raises real output, not prices; stable leakages; confidence high enough that households spend extra income.
- Why the effect may be smaller.
- The economy is near full capacity, so the AD shift mainly raises the price level (LRAS vertical): real income rises less.
- Crowding out: borrowing to pay for the spending can raise interest rates and cut private investment (Topic 10).
- Leakages may be larger than estimated: an open economy with high imports has a small multiplier.
- Time lags: the full effect builds up over several rounds, and the economy may have changed by then.
- Confidence: households may save more if they expect higher taxes later.
- Why the effect may be larger. The accelerator: rising demand can encourage extra investment, adding a second injection.
- Judgement. "Always" is too strong. The size depends on spare capacity, the leakages, the interest-rate response and confidence. The multiplier is largest in a deep recession with low interest rates and a closed economy, and smallest near full employment in a very open economy.
What examiners reward: a correct calculation used in the argument, an AD/AS diagram that shows where AD shifts relative to full capacity, and a conclusion that states the conditions under which the claim holds.
9.1
Exam tips
- Calculate the multiplier $= 1 \div (1 - MPC)$, which is $1 \div MPS$ in a closed economy without taxes and $1 \div (MPS + MPT + MPM)$ in an open one, and apply it to an injection.
- Distinguish actual from potential growth and link sustainability to long-run capacity.
- Explain the functions of money and the role of banks and the central bank.
- Explain the Phillips curve trade-off (unemployment vs inflation) and why it may not hold in the long run.
Vocabulary card meanings
marginal propensity to import: The fraction of one extra unit of income that is spent on imports. accelerator: The link from a change in the growth of demand to a change in investment, which is not always a larger swing. disposable income: Income left after income tax, free to spend or save. sustainable growth: A rise in output that can continue without exhausting key resources. standard of deferred payment: Money's role in letting a debt be settled at a later date. liquidity preference: The wish to hold wealth as cash rather than as assets that are harder to sell.
Interactive lessons on this topic
Work through it step by step, with instant-check exercises.