Graphical Representations of Summary Statistics
Introduced| English | Meaning |
|---|---|
| boxplot/ˈbɒksplɒt/ | A display showing the median and quartiles with whiskers defined by a stated rule, sometimes marking outliers separately. |
| five-number summary/faɪv ˈnʌmbə ˈsʌməri/ | The minimum, lower quartile, median, upper quartile and maximum of a dataset. |
| z-score/zed skɔː/ | The number of standard deviations a value lies above or below the mean, found by subtracting the mean and dividing by the standard deviation. |
A five-number picture
- Some summaries are best shown as a compact graph: the boxplot 箱线图.
- It's built from the five-number summary 五数概括: minimum, $Q_1$, median, $Q_3$, maximum.
- A box spans the middle $50\%$ ($Q_1$ to $Q_3$) with a line at the median; whiskers reach the extremes.
- One glance shows center, spread, and skew.
A boxplot's five-number summary
The box spans $Q_1$ to $Q_3$ (the IQR) with the median inside; whiskers reach the extremes.
The five-number summary consists of which values?
Difficulty 2/5 · 140 coins + a small bonus on first completion today
Min, $Q_1$, median, $Q_3$, max — not the mean.
Reading a boxplot
- The box goes from $Q_1$ to $Q_3$ — its length is the IQR.
- The line inside the box is the median; whiskers extend to the min and max (or to the last non-outlier).
- A longer whisker or a median off-center in the box signals skew toward the longer side.
- The box holds the middle half of the data; the whiskers show the tails.
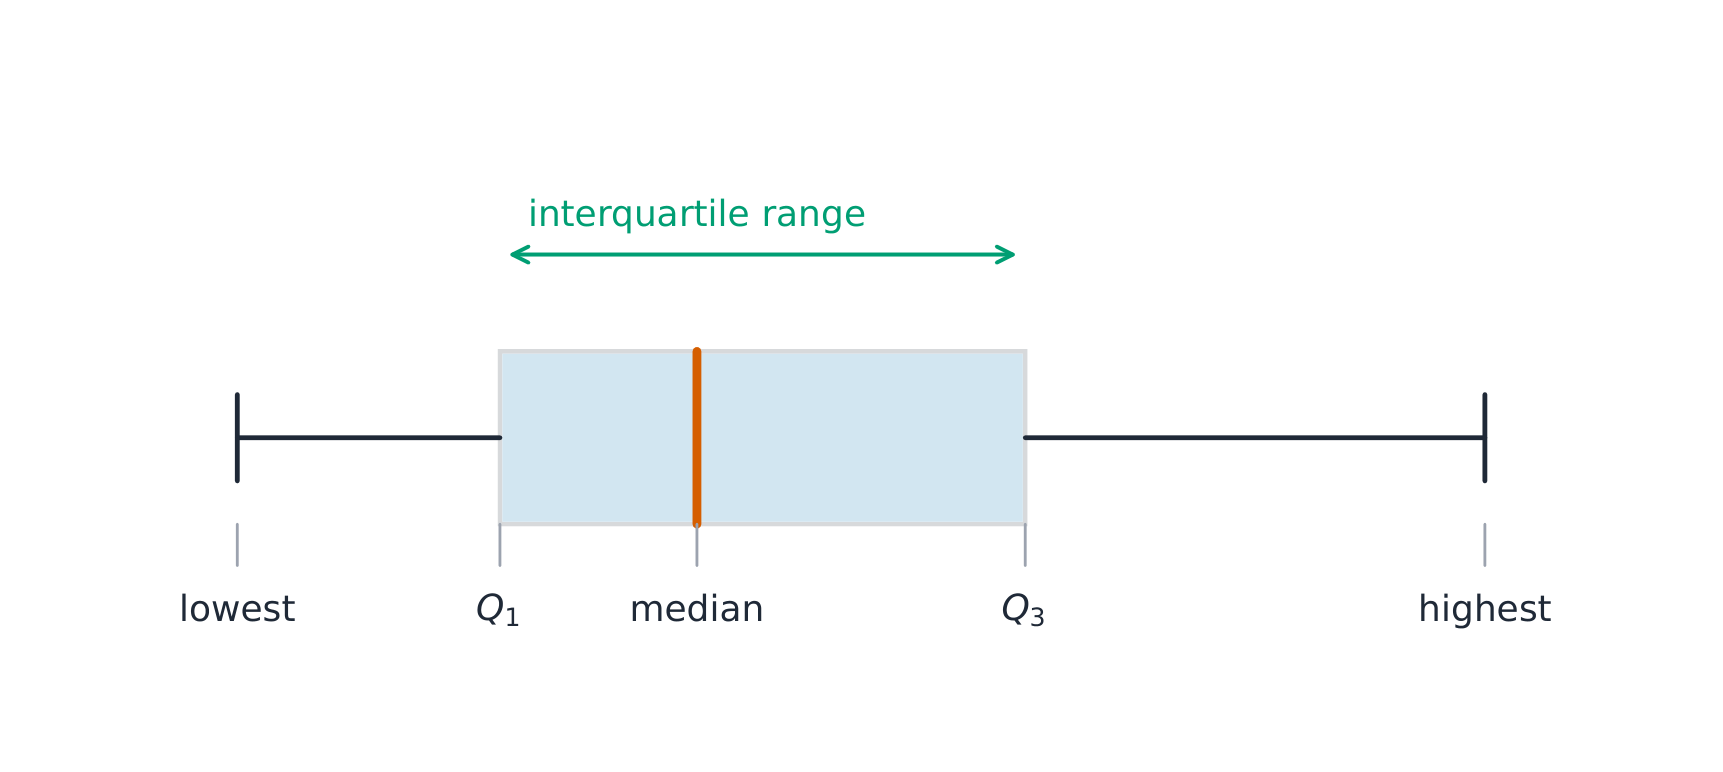
A box-and-whisker plot shows the quartiles and the range
The length of the box in a boxplot represents the...
Difficulty 1/5 · 100 coins + a small bonus on first completion today
Box from $Q_1$ to $Q_3$ = IQR.
The line inside the box marks the...
Difficulty 1/5 · 100 coins + a small bonus on first completion today
A boxplot shows the median, not the mean.
Modified boxplots and outliers
- A modified boxplot plots outliers as separate dots, using the $1.5\times\text{IQR}$ rule.
- The whiskers then stop at the most extreme non-outlier values.
- This keeps outliers from stretching the whiskers and hiding the real spread.
- Marked dots make unusual values obvious at a glance.
A ____ boxplot plots outliers as separate dots using the $1.5\times\text{IQR}$ rule.
Difficulty 1/5 · 100 coins + a small bonus on first completion today
Whiskers then stop at the last non-outlier.
z-scores: locating a value
- A $z$-score 标准分数 measures how many standard deviations a value is from the mean:
-
$$z=\frac{x-\bar{x}}{s_x}$$
- $z=+2$ means "$2$ standard deviations above the mean"; $z=-1$ means "$1$ SD below."
- $z$-scores let you compare positions across different distributions (a common exam use).
A value $85$ with mean $70$ and $s_x=10$ has what $z$-score?
Difficulty 2/5 · 140 coins + a small bonus on first completion today
$z=(85-70)/10=1.5$.
A $z$-score of $-1$ means the value is...
Difficulty 1/5 · 100 coins + a small bonus on first completion today
Negative $z$ → below the mean.
A boxplot shows the five-number summary, not the mean — the center line is the median. To judge skew, compare whisker lengths and where the median sits in the box (a median pushed toward one side signals skew the other way). And a $z$-score is signed: negative means below the mean — don't drop the sign.
A student scores $85$ on a test with mean $\bar{x}=70$ and $s_x=10$.
- $z=\dfrac{85-70}{10}=\dfrac{15}{10}=1.5$.
- The score is $1.5$ standard deviations above the mean — better than typical.
- On a boxplot, this value would sit toward the upper whisker.
A boxplot displays the five-number summary (min, $Q_1$, median, $Q_3$, max): the box is the IQR, the center line the median. A modified boxplot dots outliers via the $1.5\times\text{IQR}$ rule. A $z$-score $z=\frac{x-\bar{x}}{s_x}$ says how many SDs a value is from the mean (sign = above/below).
Write from 31 as an outlier
- Q1 is 10 and Q3 is 18, so the IQR is 8.
- A value of 31 is in the data. The lesson fence uses 1.5 times the IQR.
Is 31 an outlier?
The upper fence is Q3 plus 1.5 IQR.
Is 31 an outlier here?
Difficulty 1/5 · 100 coins + a small bonus on first completion today
31 passes the upper fence.