Representations of Equilibrium
Introduced| English | Meaning |
|---|---|
| dynamic equilibrium/daɪˈnæmɪk ˌiːkwɪˈlɪbrɪəm/ | A state in which opposing processes continue at equal rates, so there is no overall change in composition. |
Seeing balance on a graph
- Plot the amounts over time and watch them level off.
- The curves flatten but never hit zero.
- A particle snapshot shows both reactants and products mixed.
- These pictures make the balance visible.
Concentration-versus-time
- On a graph, concentrations change quickly at first, then flatten.
- The flat part is dynamic equilibrium 动态平衡, where amounts no longer change.
- The reactant and product curves both go horizontal.
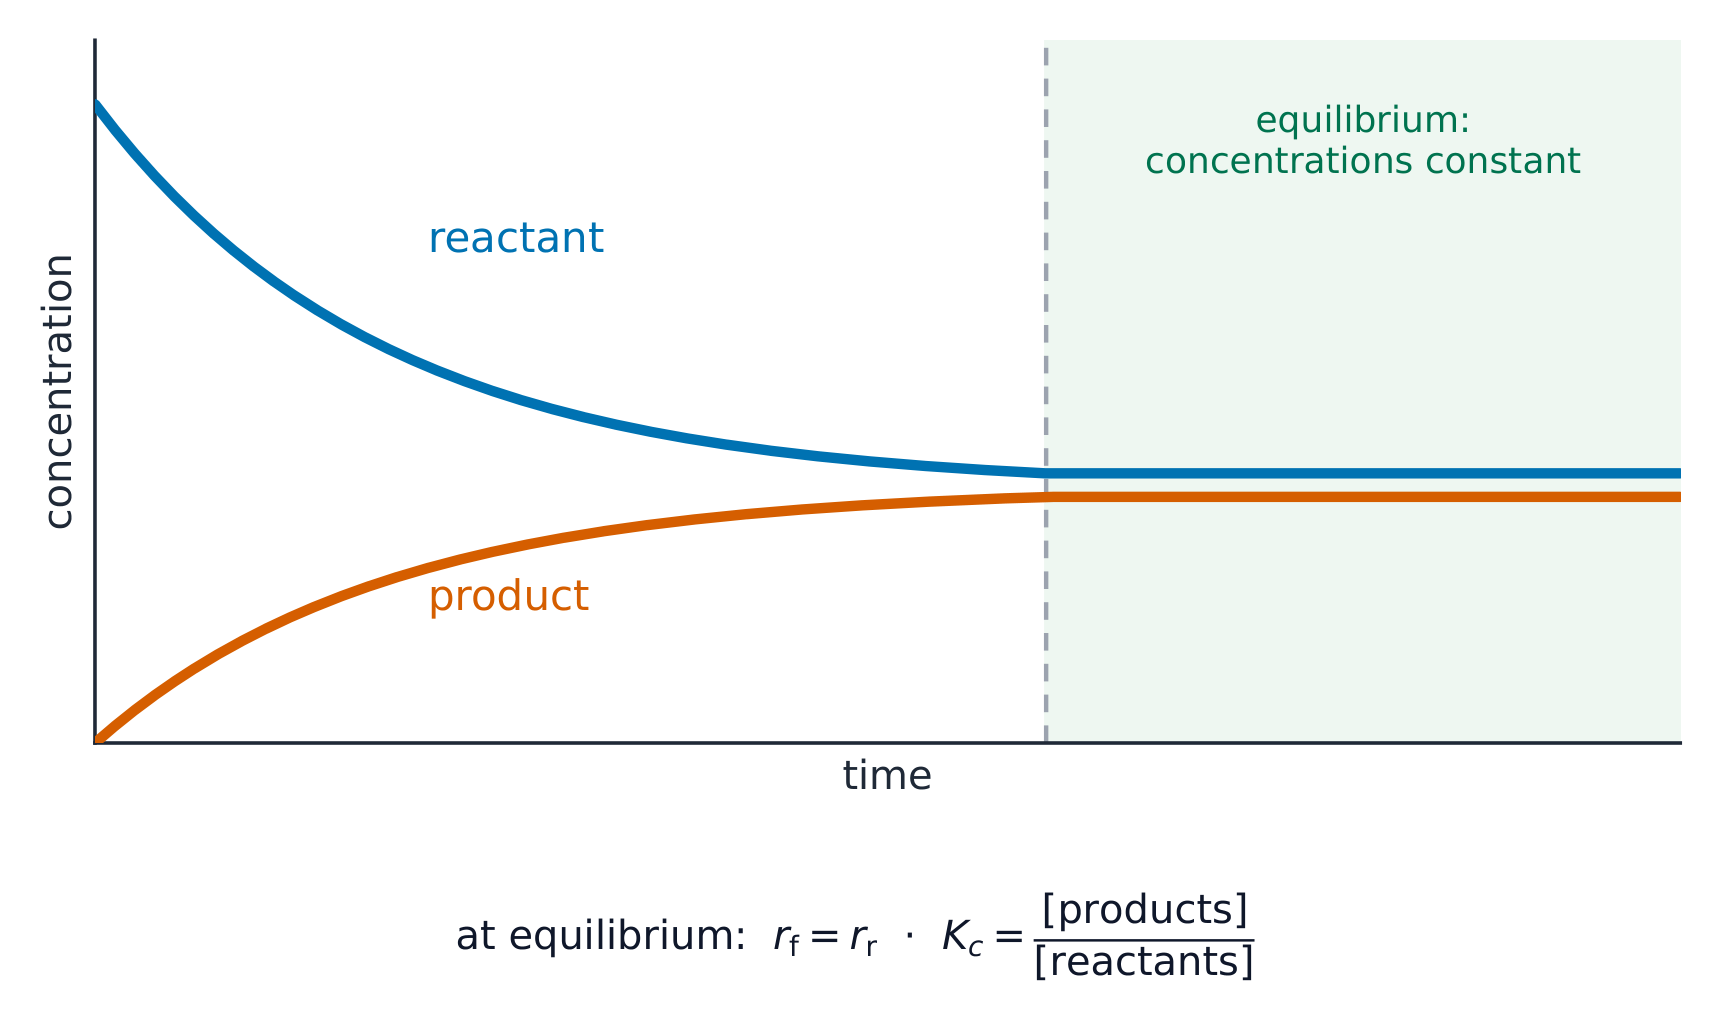
Reactant and product concentrations change, then hold constant once equilibrium is reached
On a concentration-time graph, equilibrium is where the curves...
Difficulty 1/5 · 100 coins + a small bonus on first completion today
Flat curves mean the concentrations stop changing.
A particle snapshot
- A particle diagram at equilibrium shows both species present.
- Their numbers stay steady even as the reactions continue.
- The mix reflects the value of $K$.
A particle diagram at equilibrium shows...
Difficulty 1/5 · 100 coins + a small bonus on first completion today
Equilibrium mixtures contain both species.
At equilibrium, the number of each kind of particle stays ____.
Difficulty 1/5 · 100 coins + a small bonus on first completion today
Steady numbers reflect the balanced rates.
What the pictures tell you
- A high product curve means a large $K$.
- Where the curves flatten tells you the equilibrium amounts.
- Both representations agree on the same balance.
A mixture at equilibrium
Tap the particle box to see what stays constant at equilibrium.
A graph whose product curve levels off much higher than the reactant curve suggests...
Difficulty 1/5 · 100 coins + a small bonus on first completion today
More product at equilibrium means a large $K$.
On a concentration-time graph, what marks the moment equilibrium is reached?
- It is where the curves stop changing and go flat.
- After that point, the amounts hold steady.
At equilibrium the reactant concentration reaches zero.
Difficulty 1/5 · 100 coins + a small bonus on first completion today
Both reactants and products remain present.
A flat concentration line means there is no net change, not that reactions stopped.
Difficulty 1/5 · 100 coins + a small bonus on first completion today
The reactions continue at equal rates -- dynamic equilibrium.
The curves flatten at equilibrium but do not reach zero — both reactants and products remain. A flat line means no net change, not that the reactions stopped. And more product than reactant at the plateau signals a large $K$.
Equilibrium looks like flattening curves on a concentration-time graph (a dynamic equilibrium where amounts stop changing but never hit zero) and like a particle snapshot with both species present. A high product plateau signals a large $K$; both pictures describe the same balance.