Estimating Limit Values from Graphs · Estimation des valeurs de limite à partir de graphiques
| English | Français |
|---|---|
| left-hand limit/left hænd ˈlɪmɪt/ | limite gauche |
| right-hand limit/raɪt hænd ˈlɪmɪt/ | limite droite |
| hole/həʊl/ | trou |
| jump/dʒʌmp/ | saut |
| unbounded/ʌnˈbaʊndɪd/ | sans limites |
| oscillation/ˌɒsɪˈleɪʃn/ | oscillation |
Read the limit straight off the picture
- Given a graph, you can often see a limit without any algebra.
- Put your finger on the curve a little left of $x=c$ and trace it toward $c$: what height are you heading for?
- Do the same from the right. If both fingers aim at the same height, that height is the limit.
- The trick: watch where the curve is going, and ignore any single plotted dot at $x=c$.
Lire la limite directement sur l'image
- Étant donné un graphique, vous pouvez souvent voir une limite sans algèbre.
- Posez votre doigt sur la courbe un peu à gauche de $x=c$ et suivez-la vers $c$ : quelle hauteur visez-vous ?
- Faites la même chose depuis la droite. Si les deux doigts visent la même hauteur, cette hauteur est la limite.
- L'astuce : regardez où la courbe va, et ignorez tout point tracé unique à $x=c$.
Trace the curve toward a point · Suivez la courbe vers un point
y = ax² + bx + c
Slide toward an input from the left and the right — the limit is the shared height the curve approaches, whatever a lone dot might say. · Glissez vers une entrée depuis la gauche et la droite — la limite est la hauteur partagée que la courbe s'approche, peu importe ce qu'un point isolé pourrait indiquer.
To read $\lim_{x\to c} f(x)$ from a graph, you should look at... · Pour lire $\lim_{x\to c} f(x)$ à partir d'un graphique, vous devez regarder...
A limit is the shared height approached from both sides — the dot at $c$ is irrelevant. · Une limite est la hauteur partagée approchée des deux côtés — le point en $c$ est irrelevant.
Left and right, read separately
- Trace from the left only → the left-hand limit 左极限 $\displaystyle\lim_{x\to c^-}f(x)$.
- Trace from the right only → the right-hand limit 右极限 $\displaystyle\lim_{x\to c^+}f(x)$.
- On a graph a filled dot ● means the point is on the curve; an open dot ○ (a hole 空洞) means it is not.
- The limit ignores whether the dot is filled or open — it only cares about the approach.
Gauche et droite, lire séparément
- Tracez depuis la gauche uniquement → la limite gauche 左极限 $\displaystyle\lim_{x\to c^-}f(x)$.
- Tracez uniquement depuis la droite → la limite à droite 右极限 $\displaystyle\lim_{x\to c^+}f(x)$.
- Sur un graphique, un point plein ● signifie que le point est sur la courbe ; un point ouvert ○ (un trou 空洞) signifie qu'il ne l'est pas.
- La limite ignore si le point est plein ou ouvert — elle ne s'intéresse qu'à l'approche.
A graph rises steadily and, just left of $x=5$, the curve is passing through heights $2.9, 2.99, 2.999$. Estimate $\lim_{x\to 5^-} f(x)$. · Un graphique monte régulièrement et, juste à gauche de $x=5$, la courbe passe par les hauteurs $2.9, 2.99, 2.999$. Estimez $\lim_{x\to 5^-} f(x)$.
The left-hand values close in on $3$, so the left-hand limit is $3$. · Les valeurs de gauche convergent vers $3$, donc la limite latérale gauche est $3$.
When the limit does not exist
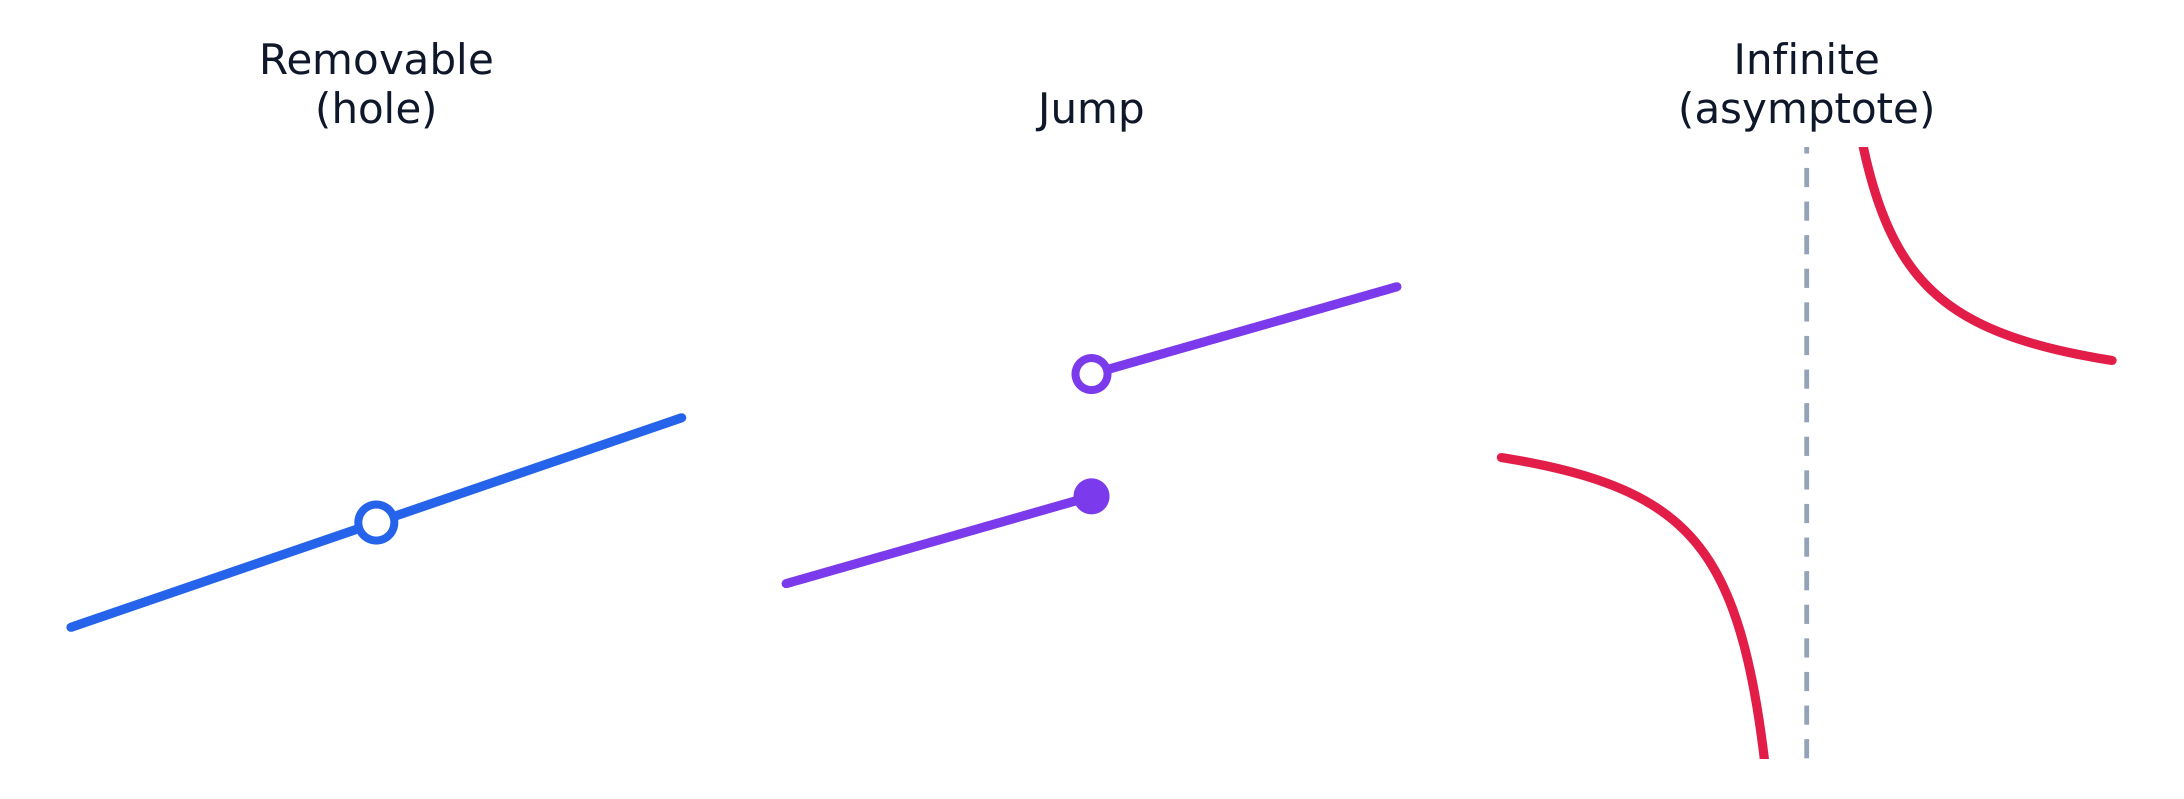
- Three classic graph shapes make a limit fail (DNE):
- A jump 跳跃: the two sides trace to different heights.
- An unbounded 无界 blow-up: the curve rockets to $\pm\infty$ near a vertical asymptote.
- An oscillation 振荡: the curve wiggles infinitely fast (like $\sin\frac1x$) and never settles.
Quand la limite n'existe pas
- Trois formes graphiques classiques font échouer une limite (DNE) :
- Un saut 跳跃 : les deux côtés convergent vers des hauteurs différentes.
- Une infinie 无界 explosion : la courbe fonce vers $\pm\infty$ près d'une asymptote verticale.
- Une oscillation 振荡 : la courbe vibre infiniment vite (comme $\sin\frac1x$) et ne se stabilise jamais.
If the left side of a graph heads to $2$ and the right side heads to $6$, the limit does not exist because of a ____. · Si le côté gauche d'un graphique tend vers $2$ et le côté droit vers $6$, la limite n'existe pas à cause d'une ____.
Different one-sided heights means a jump · saut discontinuity, so the two-sided limit is DNE. · Des hauteurs unilatérales différentes signifient une discontinuité de saut, donc la limite bilatérale est DNE.
From a graph, select all · tout features that make $\lim_{x\to c} f(x)$ fail to exist. · À partir d'un graphique, sélectionnez toutes les caractéristiques qui empêchent $\lim_{x\to c} f(x)$ d'exister.
Blow-ups, jumps, and oscillation all kill a limit. A removable hole does not · non — both sides still agree. · Les explosions, les sauts et l'oscillation tuent tous une limite. Un trou évitable ne le fait pas — les deux côtés s'accordent toujours.
The dot at $c$ is a decoy
- The height the curve reaches for, $\lim_{x\to c}f(x)$, is a separate question from the plotted value $f(c)$.
- A curve can head smoothly toward $4$ while a lone dot sits at $f(c)=1$ — the limit is still $4$.
- $f(c)$ can even be undefined (a hole) while the limit exists.
- So always answer two questions separately: where is the curve going? and is there a dot, and where?
Le point à $c$ est un leurre
- La hauteur que la courbe vise, $\lim_{x\to c}f(x)$, est une question séparée de la valeur tracée $f(c)$.
- Une courbe peut tendre doucement vers $4$ tandis qu'un point isolé est placé à $f(c)=1$ — la limite reste $4$.
- $f(c)$ peut même être indéfini (un trou) alors que la limite existe.
- Répondez donc toujours à deux questions séparément : où va la courbe ? et y a-t-il un point, et où ?
If the graph shows an open hole at $(2,4)$ and a filled dot at $(2,1)$, then $\lim_{x\to 2} f(x) = 4$. · Si le graphique montre un trou ouvert en $(2,4)$ et un point plein en $(2,1)$, alors $\lim_{x\to 2} f(x) = 4$.
The curve approaches height $4$ from both sides, so the limit is $4$; the filled dot is only $f(2)=1$. · La courbe approche de la hauteur $4$ des deux côtés, donc la limite est $4$ ; le point plein n'est que $f(2)=1$.
A smooth curve passes through height $7$ at $x=3$ with no · aucun hole or dot elsewhere. What are $f(3)$ and · et $\lim_{x\to 3} f(x)$? · Une courbe lisse passe par la hauteur $7$ en $x=3$ sans trou ni autre point. Quelles sont $f(3)$ et $\lim_{x\to 3} f(x)$ ?
With no hole or jump, the curve is continuous there, so limit $= f(3) = 7$. · Sans trou ni saut, la courbe est continue là, donc limite $= f(3) = 7$.
A common trap: reading $f(c)$ (the plotted dot) when the question asks for $\lim_{x\to c}f(x)$ (the approach). They are different. If you see a filled dot floating above a smooth curve, the limit is the curve's height — not the dot's.
Un piège courant : lire $f(c)$ (le point tracé) quand la question demande $\lim_{x\to c}f(x)$ (l'approche). Ce sont différents. Si vous voyez un point plein flottant au-dessus d'une courbe lisse, la limite est la hauteur de la courbe — pas celle du point.
From a graph: near $x=2$ the curve rises to a hole at height $4$, and a filled dot is plotted at $(2,\,1)$.
- Left-hand limit: heading to $4$. Right-hand limit: heading to $4$.
- Both agree, so $\displaystyle\lim_{x\to 2}f(x) = 4$.
- But $f(2) = 1$ (the filled dot). Limit $\neq$ function value here.
Sur un graphique : près de $x=2$, la courbe monte vers un trou à la hauteur $4$, et un point plein est tracé à $(2,\,1)$.
- Limite à gauche : direction $4$. Limite à droite : direction $4$.
- Les deux concordent, donc $\displaystyle\lim_{x\to 2}f(x) = 4$.
- Mais $f(2) = 1$ (le point plein). Valeur de fonction pour la limite $\neq$ ici.
To read a limit off a graph, trace the curve toward $c$ from both sides and ask what height you head for; the plotted dot at $c$ is a decoy. The limit is DNE when the sides give different heights (jump), the curve is unbounded, or it oscillates endlessly.
Pour lire une limite sur un graphique, tracez la courbe vers $c$ depuis les deux côtés et demandez-vous quelle hauteur vous visez ; le point tracé à $c$ est un leurre. La limite est DNE lorsque les côtés donnent des hauteurs différentes (saut), que la courbe est infinie, ou qu'elle oscille sans fin.