Scatter diagrams and correlation · 散点图与相关
| English | 中文 | Pinyin · 拼音 |
|---|---|---|
| scatter diagram/ˈskætə ˈdaɪəɡræm/ | 散点图 | sàn diǎn tú |
| correlation/ˌkɒrɪˈleɪʃn/ | 相关性 | xiāng guān xìng |
| positive correlation/ˈpɒzɪtɪv ˌkɒrɪˈleɪʃn/ | 正相关 | zhèng xiāng guān |
| negative correlation/ˈneɡətɪv ˌkɒrɪˈleɪʃn/ | 负相关 | fù xiāng guān |
| line of best fit/laɪn ɒv best fɪt/ | 最佳拟合线 | zuì jiā nǐ hé xiàn |
| extrapolation/ekˈstræpəleɪʃn/ | 外推 | wài tuī |
| outlier/ˈaʊtlaɪə/ | 异常值 | yì cháng zhí |
Do tall people have bigger feet?
- Plot height against shoe size for 30 people and you'll see a pattern: taller people tend to have larger feet.
- A scatter diagram 散点图 reveals whether two variables are linked — and how strongly.
高的人脚更大吗?
- 为 30 个人绘制身高对鞋码,你会看到一个模式:更高的人倾向于有更大的脚。
- 一个散点图(scatter diagram)揭示两个变量是否关联——以及多强。
Correlation 相关性
- Positive correlation 正相关: as one goes up, the other goes up (points slope upward).
- Negative correlation 负相关: as one goes up, the other goes down (points slope downward).
- Zero correlation: no clear pattern (points scattered randomly).
Correlation $\neq$ causation. Ice cream sales and drowning deaths both rise in summer — but ice cream doesn't cause drowning. Both are caused by a third factor: hot weather.
A line of best fit 最佳拟合线 is one straight line through the middle of the points, with about as many on each side; use it to predict
相关
- 正相关(positive correlation):一个上升时,另一个上升(点向上倾斜)。
- 负相关(negative correlation):一个上升时,另一个下降(点向下倾斜)。
- 零相关(zero correlation):没有清晰的模式(点随机散布)。
相关 $\neq$ 因果。 冰淇淋销售和溺水死亡在夏天都上升——但冰淇淋不造成溺水。两者都由第三个因素造成:炎热的天气。
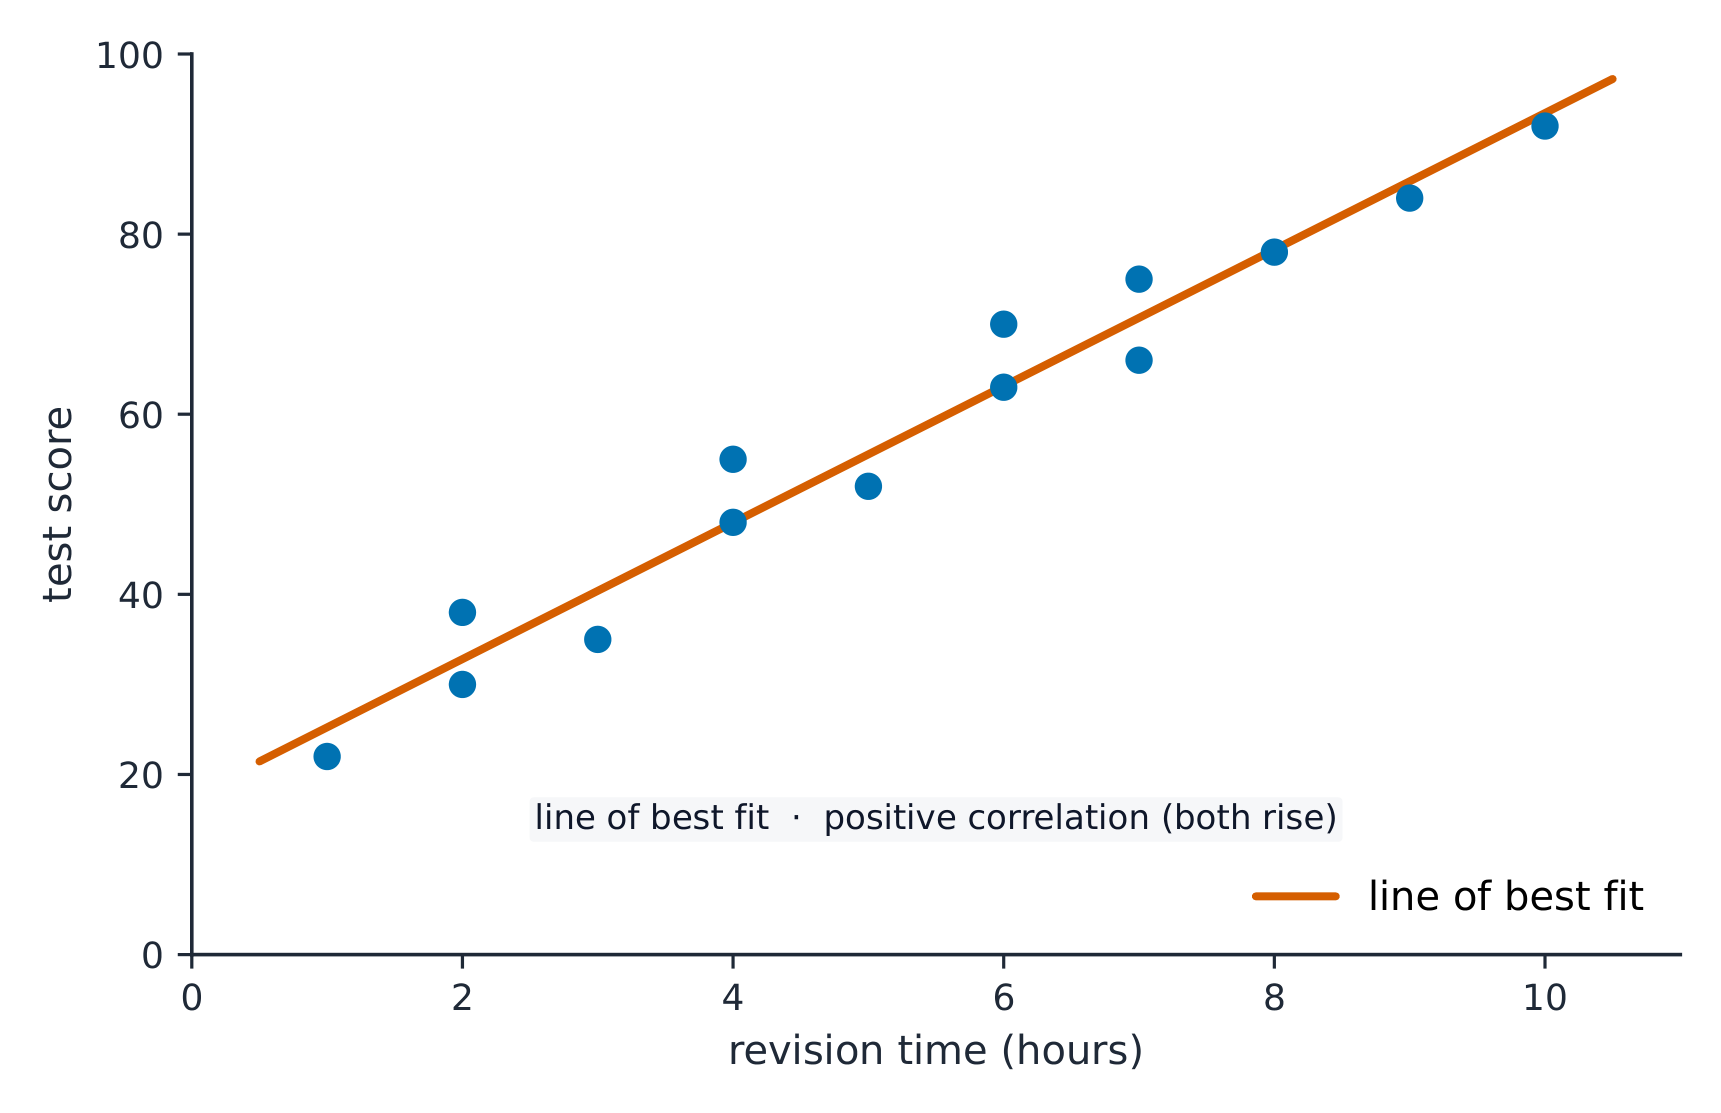
一条最佳拟合线是穿过点中间的一条直线,每一侧大约有同样多的点;用它来预测
Scatter & correlation · 散点与相关
r near ±1 = strong · r 接近 ±1 = 强相关
Tighten the points to see strong · 强效 correlation; scatter them for weak · 弱效 — read r and the line.
As one quantity increases, the other also increases. This is:
Both rising together is positive correlation.
Negative correlation means as one quantity goes up, the other goes down.
A downward trend on the scatter diagram is negative correlation.
If two variables are correlated, one must cause the other.
Correlation does not prove causation — both could be caused by a third factor.
Line of best fit
- If there is correlation, draw one straight line through the middle of the points, with roughly equal numbers on each side.
- Use it to predict values.
A line of best fit through height-shoe size data: height $170$ cm → predicted shoe size $9$. But don't trust predictions far outside the data range (extrapolation 外推 is risky).
Positive correlation: both rise together. Negative: one rises as the other falls. Zero: no clear link
最佳拟合线
- 如果有相关,穿过点的中间画一条直线,每一侧大致有相等数量的点。
- 用它来预测值。
一条穿过身高-鞋码数据的最佳拟合线:身高 $170$ cm → 预测鞋码 $9$。但不要相信远在数据范围之外的预测(外推extrapolation 有风险)。
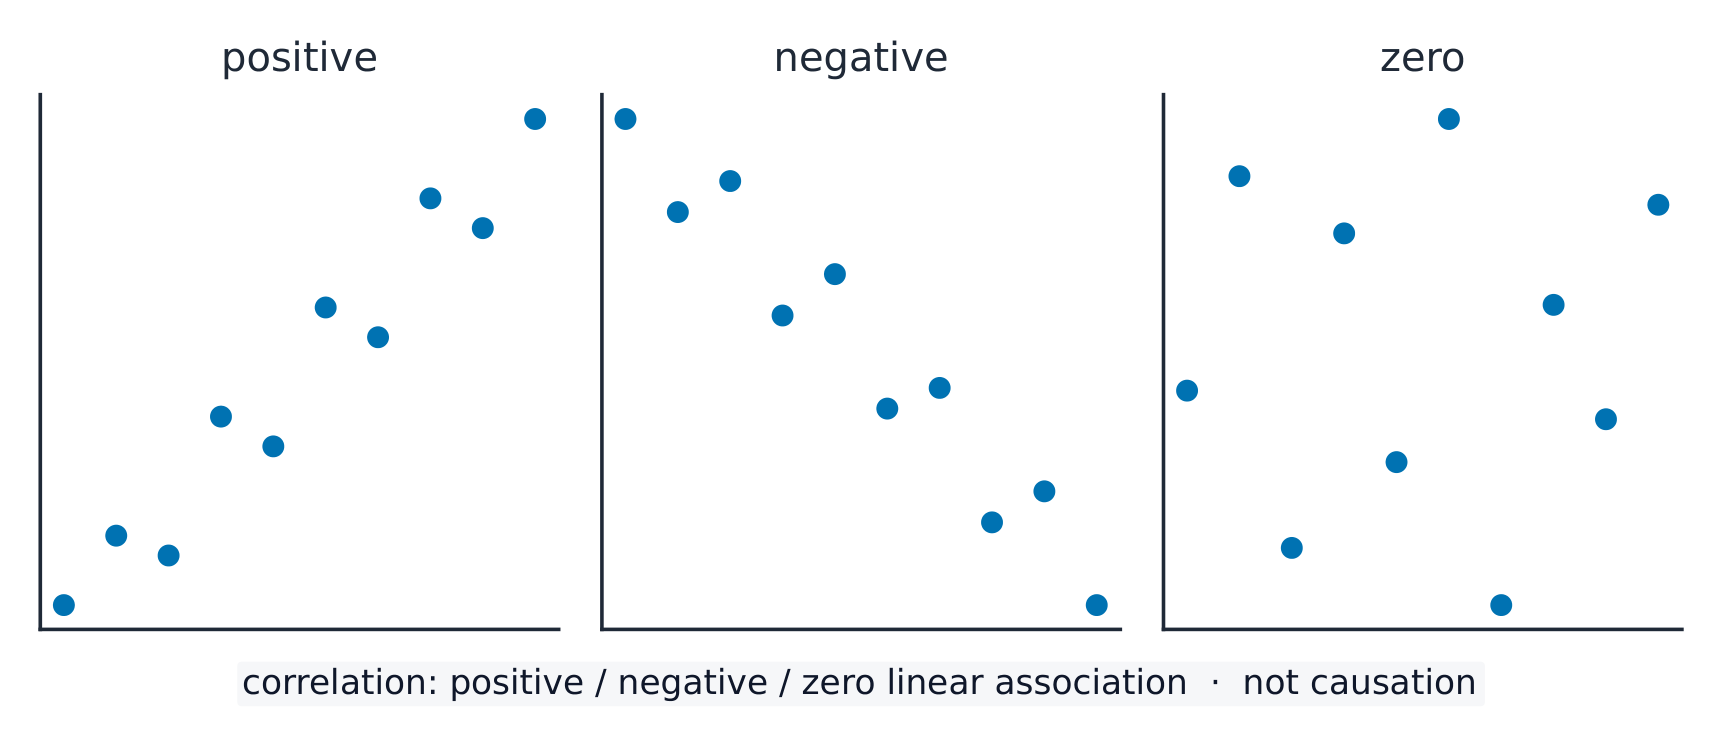
正相关:两者一起上升。负相关:一个上升时另一个下降。零相关:没有清晰的关联
A line of best fit is mainly used to:
It models the trend so you can predict one value from the other.
Using the line of best fit to predict values far outside the data range is called ______.
Extrapolation is unreliable because the trend may not continue beyond the observed data.
Outliers 异常值 on scatter diagrams
- A point far from the general pattern is an outlier.
- Investigate before removing it — it might be a genuine unusual case, or a recording error.
Scatter diagrams reveal patterns: positive (like a rising line), negative (like a falling line), or zero (no pattern).
散点图上的异常值
- 一个远离总体模式的点是一个异常值(outlier)。
- 在移除它之前调查——它可能是一个真实的不寻常案例,或一个记录错误。
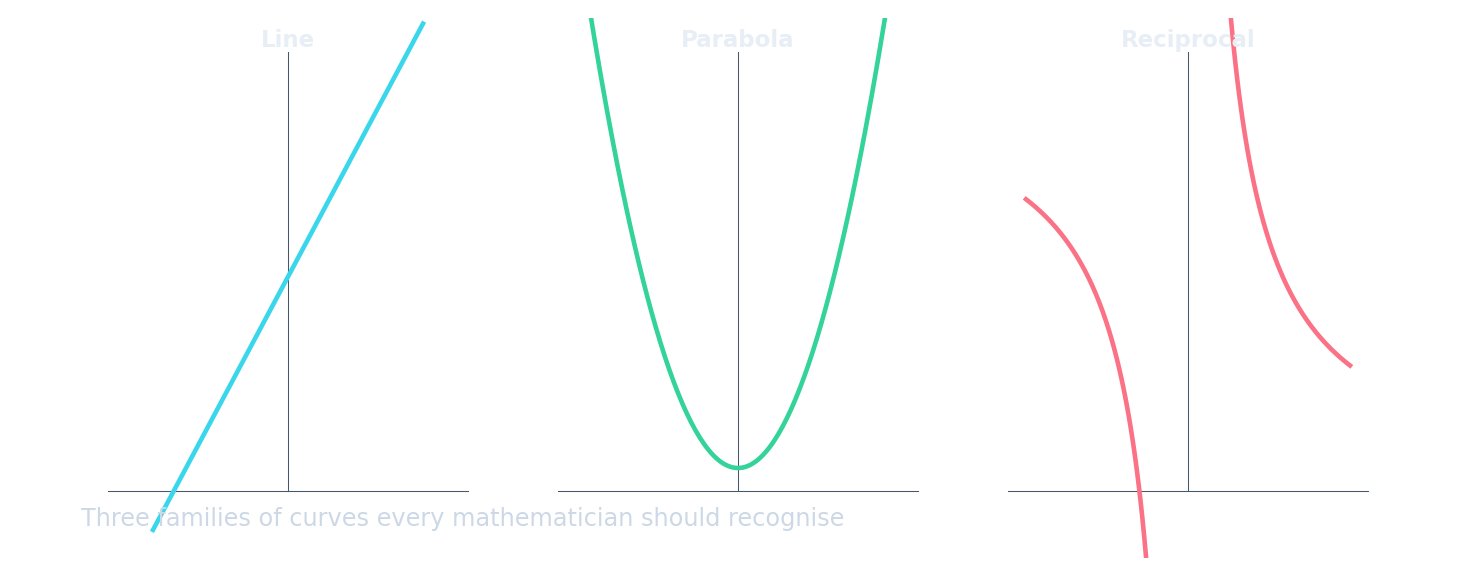
散点图揭示模式:正(像一条上升的线)、负(像一条下降的线),或零(没有模式)。
On a scatter diagram, most points follow a line, but one point is far away. This point is called an ______.
An outlier is a data point that does not fit the general pattern.
Plot pairs and read an estimate
- Mark each pair with a small cross, not joined points. For $(1,12),(2,15),(3,19),(4,20),(5,24)$, a sensible by-eye line is close to $y=3x+9$; it spans all the data and roughly balances the points above and below.
- At $x=3.5$, this line estimates $y=19.5$. A nearby balanced line may give a slightly different answer. Predicting at $x=20$ is extrapolation and much less secure; correlation alone does not prove cause.
绘制散点图并读取估计值
- 用一个小叉号标记每一对数据,不要连接各点。对于 $(1,12),(2,15),(3,19),(4,20),(5,24)$,一条合理的目测直线应接近 $y=3x+9$;该线覆盖所有数据,并使上下方的点大致平衡。
- 在 $x=3.5$ 处,该线估计值为 $y=19.5$。附近另一条平衡线可能给出略有不同的结果。在 $x=20$ 处进行预测属于外推法,可靠性较低;仅凭相关性不能证明因果关系。
Use the line y = 3x + 9 to estimate y at x = 3.5.
y = 3(3.5) + 9 = 19.5.
You've got it
- positive correlation rises together; negative falls as the other rises; zero $=$ no link
- a line of best fit is one straight line through the middle of the points
- use the line to predict — but don't trust it far outside the data
你掌握了
- 正相关一起上升;负在另一个上升时下降;零 $=$ 没有关联
- 一条最佳拟合线是穿过点中间的一条直线
- 用线来预测——但不要相信它远在数据之外