Estimating Limit Values from Graphs · 从图像估算极限值
| English | 中文 | Pinyin · 拼音 |
|---|---|---|
| left-hand limit/left hænd ˈlɪmɪt/ | 左极限 | zuǒ jí xiàn |
| right-hand limit/raɪt hænd ˈlɪmɪt/ | 右极限 | yòu jí xiàn |
| hole/həʊl/ | 空洞 | kōng dòng |
| jump/dʒʌmp/ | 跳跃 | tiào yuè |
| unbounded/ʌnˈbaʊndɪd/ | 无界 | wú jiè |
| oscillation/ˌɒsɪˈleɪʃn/ | 振荡 | zhèn dàng |
Read the limit straight off the picture
- Given a graph, you can often see a limit without any algebra.
- Put your finger on the curve a little left of $x=c$ and trace it toward $c$: what height are you heading for?
- Do the same from the right. If both fingers aim at the same height, that height is the limit.
- The trick: watch where the curve is going, and ignore any single plotted dot at $x=c$.
直接从图上读出极限
- 给你一张图,你常常不用任何代数就能看出极限。
- 把手指放在 $x=c$ 稍靠左的曲线上,沿曲线向 $c$ 滑动:你正奔向哪个高度?
- 从右边再做一次。如果两根手指都瞄准同一个高度,那个高度就是极限。
- 诀窍:盯住曲线正奔向哪里,忽略 $x=c$ 处画出的任何一个孤立圆点。
Trace the curve toward a point · 沿曲线追踪至某点
y = ax² + bx + c
Slide toward an input from the left and the right — the limit is the shared height the curve approaches, whatever a lone dot might say. · 从左侧和右侧滑向一个输入——极限是曲线趋近的共享高度,无论孤立点的标注如何。
To read $\lim_{x\to c} f(x)$ from a graph, you should look at... · 要从图像读取 $\lim_{x\to c} f(x)$,你应该查看...
A limit is the shared height approached from both sides — the dot at $c$ is irrelevant. · 极限是从两侧趋近的共享高度——$c$ 处的点是无关紧要的。
Left and right, read separately
- Trace from the left only → the left-hand limit 左极限 $\displaystyle\lim_{x\to c^-}f(x)$.
- Trace from the right only → the right-hand limit 右极限 $\displaystyle\lim_{x\to c^+}f(x)$.
- On a graph a filled dot ● means the point is on the curve; an open dot ○ (a hole 空洞) means it is not.
- The limit ignores whether the dot is filled or open — it only cares about the approach.
左右分开来读
- 只从左边滑近 → 左侧极限 $\displaystyle\lim_{x\to c^-}f(x)$。
- 只从右边滑近 → 右侧极限 $\displaystyle\lim_{x\to c^+}f(x)$。
- 图上实心点 ● 表示该点在曲线上;空心点 ○(一个空心洞)表示它不在曲线上。
- 极限并不在意圆点是实心还是空心——它只关心趋近的过程。
A graph rises steadily and, just left of $x=5$, the curve is passing through heights $2.9, 2.99, 2.999$. Estimate $\lim_{x\to 5^-} f(x)$. · 图像持续上升,且在 $x=5$ 左侧,曲线经过高度 $2.9, 2.99, 2.999$。估算 $\lim_{x\to 5^-} f(x)$。
The left-hand values close in on $3$, so the left-hand limit is $3$. · 左侧的值收敛于 $3$,因此左极限为 $3$。
When the limit does not exist
- Three classic graph shapes make a limit fail (DNE):
- A jump 跳跃: the two sides trace to different heights.
- An unbounded 无界 blow-up: the curve rockets to $\pm\infty$ near a vertical asymptote.
- An oscillation 振荡: the curve wiggles infinitely fast (like $\sin\frac1x$) and never settles.
极限何时不存在
- 有三种经典的图形会让极限失效(DNE):
- 跳跃:两侧滑向不同的高度。
- 无界地爆发:曲线在竖直渐近线附近冲向 $\pm\infty$。
- 振荡:曲线无限快地摆动(如 $\sin\frac1x$),永远安定不下来。
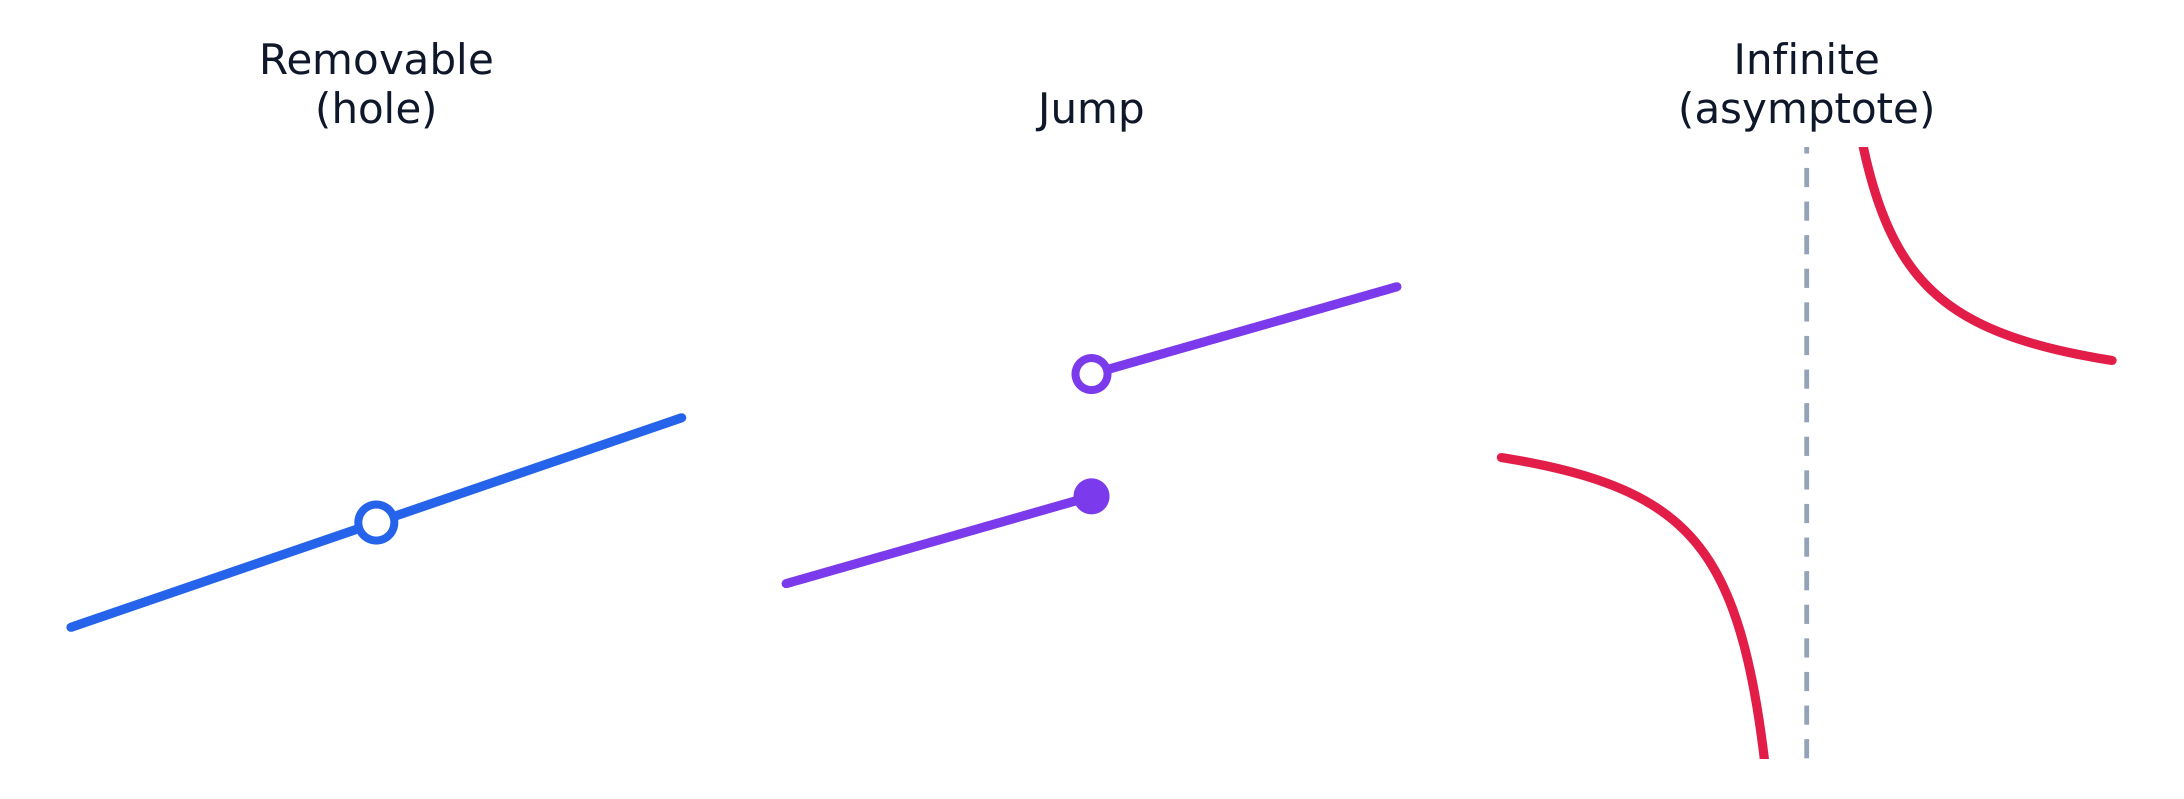
If the left side of a graph heads to $2$ and the right side heads to $6$, the limit does not exist because of a ____. · 如果图像左侧趋近 $2$ 而右侧趋近 $6$,则极限不存在,因为存在 ____。
Different one-sided heights means a jump · 跳跃 discontinuity, so the two-sided limit is DNE. · 不同的单侧高度意味着跳跃间断,因此双侧极限不存在 (DNE)。
From a graph, select all · 所有 features that make $\lim_{x\to c} f(x)$ fail to exist. · 从图像中,选择所有导致 $\lim_{x\to c} f(x)$ 不存在的所有特征。
Blow-ups, jumps, and oscillation all kill a limit. A removable hole does not · 不 — both sides still agree. · 爆炸、跳跃和振荡都会破坏极限。可去间断点不会——两侧仍然一致。
The dot at $c$ is a decoy
- The height the curve reaches for, $\lim_{x\to c}f(x)$, is a separate question from the plotted value $f(c)$.
- A curve can head smoothly toward $4$ while a lone dot sits at $f(c)=1$ — the limit is still $4$.
- $f(c)$ can even be undefined (a hole) while the limit exists.
- So always answer two questions separately: where is the curve going? and is there a dot, and where?
$c$ 处的圆点是个"诱饵"
- 曲线所奔向的高度 $\lim_{x\to c}f(x)$,与画出的取值 $f(c)$ 是两个分开的问题。
- 曲线可以平滑地奔向 $4$,而一个孤立圆点却落在 $f(c)=1$——极限仍然是 $4$。
- $f(c)$ 甚至可以没有定义(一个洞),而极限依然存在。
- 所以永远把两个问题分开回答:曲线要去哪里? 以及 有没有圆点,在哪里?
If the graph shows an open hole at $(2,4)$ and a filled dot at $(2,1)$, then $\lim_{x\to 2} f(x) = 4$. · 如果图像在 $(2,4)$ 处显示空心孔而在 $(2,1)$ 处显示实心点,则 $\lim_{x\to 2} f(x) = 4$。
The curve approaches height $4$ from both sides, so the limit is $4$; the filled dot is only $f(2)=1$. · 曲线从两侧趋近高度 $4$,因此极限为 $4$;实心点仅为 $f(2)=1$。
A smooth curve passes through height $7$ at $x=3$ with no · 否 hole or dot elsewhere. What are $f(3)$ and $\lim_{x\to 3} f(x)$? · 一条平滑曲线在高度 $7$ 处经过 $x=3$,且其他地方没有孔或点。$f(3)$ 和 $\lim_{x\to 3} f(x)$ 是什么?
With no hole or jump, the curve is continuous there, so limit $= f(3) = 7$. · 由于没有孔或跳跃,曲线在该处连续,因此极限为 $= f(3) = 7$。
A common trap: reading $f(c)$ (the plotted dot) when the question asks for $\lim_{x\to c}f(x)$ (the approach). They are different. If you see a filled dot floating above a smooth curve, the limit is the curve's height — not the dot's.
一个常见陷阱:题目问 $\lim_{x\to c}f(x)$(趋近的高度),你却去读 $f(c)$(画出的圆点)。它们不一样。如果你看到一个实心点悬在平滑曲线的上方,极限是曲线的高度——而不是圆点的高度。
From a graph: near $x=2$ the curve rises to a hole at height $4$, and a filled dot is plotted at $(2,\,1)$.
- Left-hand limit: heading to $4$. Right-hand limit: heading to $4$.
- Both agree, so $\displaystyle\lim_{x\to 2}f(x) = 4$.
- But $f(2) = 1$ (the filled dot). Limit $\neq$ function value here.
从一张图上看:在 $x=2$ 附近,曲线升到高度 $4$ 处的一个空心洞,而一个实心点画在 $(2,\,1)$。
- 左侧极限:奔向 $4$。右侧极限:奔向 $4$。
- 两者一致,所以 $\displaystyle\lim_{x\to 2}f(x) = 4$。
- 但 $f(2) = 1$(那个实心点)。这里极限 $\neq$ 函数值。
To read a limit off a graph, trace the curve toward $c$ from both sides and ask what height you head for; the plotted dot at $c$ is a decoy. The limit is DNE when the sides give different heights (jump), the curve is unbounded, or it oscillates endlessly.
要从图上读极限,就从两侧沿曲线滑向 $c$,问自己奔向哪个高度;$c$ 处画出的圆点是个诱饵。当两侧给出不同高度(跳跃)、曲线无界、或曲线无休止地振荡时,极限不存在(DNE)。