Estimating Limit Values from Tables
Introduced| English | Meaning |
|---|---|
| estimate/ˈestɪmət/ | A strong hint, confirmed later by algebra or a graph — never a proof on its own. |
| trend/trend/ | The general direction in which a quantity or pattern changes over time. |
| two-sided limit/tuː ˈsaɪdɪd ˈlɪmɪt/ | The value a function approaches from both sides of a point, when the left-hand and right-hand limits agree. |
Sneak up on the limit with a table
- No graph? No formula trick? You can still estimate a limit by making a table of outputs.
- Pick inputs that creep toward $c$ from both sides and watch the outputs.
- For $\displaystyle\lim_{x\to 2}\dfrac{x^2-4}{x-2}$, plugging in $x=2$ gives $\tfrac00$ — so build a table instead.
- The outputs will reveal the value the function is heading for.
Close in from both sides
- Choose inputs progressively closer to $c$: from the left $1.9, 1.99, 1.999$; from the right $2.1, 2.01, 2.001$.
- Evaluate the function at each and line the results up.
| $x$ | $1.9$ | $1.99$ | $1.999$ | $\to 2 \leftarrow$ | $2.001$ | $2.01$ | $2.1$ |
|---|---|---|---|---|---|---|---|
| $f(x)$ | $3.9$ | $3.99$ | $3.999$ | ? | $4.001$ | $4.01$ | $4.1$ |
- Both columns squeeze toward $4$, so $\displaystyle\lim_{x\to 2}\dfrac{x^2-4}{x-2}=4$.
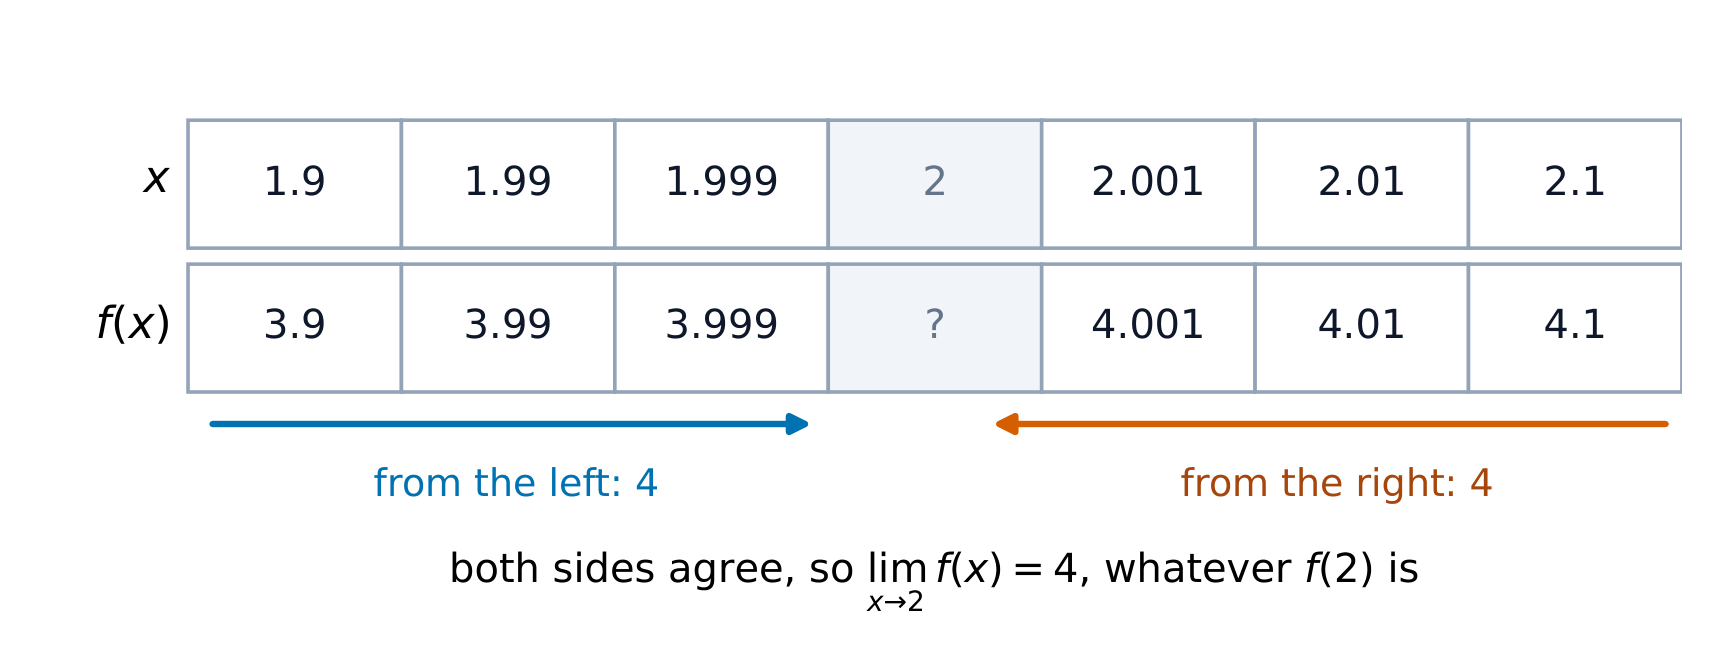
Values from both sides close in on 4, so the limit is 4 whatever f(2) is
See the curve behind the table
y = ax² + bx + c
A table is just sampled points on a curve — drag the coefficients and picture the outputs closing in on one height.
A table gives $f(2.9)=6.9$, $f(2.99)=6.99$, $f(3.01)=7.01$, $f(3.1)=7.1$. Estimate $\lim_{x\to 3} f(x)$.
Difficulty 2/5 · 140 coins + a small bonus on first completion today
Both sides close in on $7$, so the limit is $7$.
To estimate $\lim_{x\to 4} f(x)$ from a table, the best inputs to use are...
Difficulty 1/5 · 100 coins + a small bonus on first completion today
Inputs must close in on $4$ from both sides — and avoid $x=4$ itself.
The two sides must trend together
- Read the left trend and the right trend separately.
- If both head for the same number, that shared number is your estimate of the two-sided limit 双侧极限.
- If the left column drifts toward one value and the right toward another, the limit does not exist.
- The table makes a jump obvious: the numbers refuse to meet in the middle.
If a table's left column trends to $2$ and its right column trends to $5$, the two-sided limit does not ____.
Difficulty 1/5 · 100 coins + a small bonus on first completion today
Different one-sided trends mean the two-sided limit does not exist.
A table only suggests — it cannot prove
- A table shows a trend 趋势, not a guarantee. The function could do something surprising even closer to $c$.
- Some functions (like $\sin\frac1x$) fool a coarse table: pick nice round inputs and the pattern looks calm while the true behavior oscillates wildly.
- So a numerical estimate 估计值 is a strong hint, confirmed later by algebra or a graph — never a proof on its own.
- Always choose inputs genuinely close to $c$, not just convenient ones.
A neat table of values proves exactly what a limit equals.
Difficulty 1/5 · 100 coins + a small bonus on first completion today
A table only suggests a value — it can be fooled by oscillation. Proof needs algebra or a theorem.
Select all good practices when estimating a limit from a table.
Difficulty 2/5 · 140 coins + a small bonus on first completion today
Close in from both sides and stay skeptical. Plugging in $x=c$ misses the point — the limit is about the approach.
A table for $\dfrac{\sin x}{x}$ near $x=0$ gives $0.998, 0.99998, 0.9999998, \dots$. The limit is...
Difficulty 1/5 · 100 coins + a small bonus on first completion today
The outputs close in on $1$, so the limit is $1$ — even though $f(0)$ is the indeterminate $\tfrac00$.
A table can lie if your inputs are too spread out or land on a deceptive pattern. $f(x)=\sin\frac{\pi}{x}$ at $x=1,\tfrac12,\tfrac13,\dots$ reads $0,0,0,\dots$ — suggesting a limit of $0$ at $x=0$, when in fact the function oscillates and the limit does not exist. Choose inputs that truly close in, and stay skeptical.
Estimate $\displaystyle\lim_{x\to 0}\dfrac{\sin x}{x}$ (with $x$ in radians).
- $x=0.1 \Rightarrow 0.99833$; $\;x=0.01 \Rightarrow 0.99998$; $\;x=0.001 \Rightarrow 0.9999998$.
- The same from the negative side by symmetry.
- The outputs close in on $1$, so $\displaystyle\lim_{x\to 0}\dfrac{\sin x}{x}=1$ — a famous limit you will meet again.
To estimate a limit from a table, evaluate the function at inputs marching toward $c$ from both sides and read the shared trend. Matching trends → that value is the limit; diverging trends → DNE. A table only suggests a value; it can be fooled, so treat it as strong evidence, not proof.
Write from a table that only suggests
- Inputs from the left give outputs 3.1, 3.01 and 3.001.
- Inputs from the right give 2.9, 2.99 and 2.999.
What does the table suggest, and what does it not prove?
Matching trends are evidence of the shared height.
Both sides of a table trend toward 3. The table shows what?
Difficulty 1/5 · 100 coins + a small bonus on first completion today
A table suggests; it does not prove.