Skip to content

Core global change · Population patterns and development

International Baccalaureate · IB Diploma · Geography · HL · Topic 1

Video lesson for this topic Open the video page
6:48

Changing population

In 2024, nine point five four million babies were born in China and ten point nine three million people died. The population fell for the third year in a row.…

English narration · English + 中文 subtitles burned in

1.1

Changing population

IB Diploma Programme Geography HL (first assessment 2019; 2017 guide). This topic covers the first unit of the core 核心部分, Changing population, which SL and HL students both study. It has three parts: where people live and why, how populations change, and the challenges and opportunities this brings. Paper 2 tests the core with structured questions, a visual source and an essay. The examiners like calculations from data, so each section below shows one.

In 2024, 9.54 million babies were born in China and 10.93 million people died. The population fell for the third year in a row, to 1.408 billion. Fifty years earlier, China's problem was the opposite: too many births. In one lifetime the country has moved from fast growth to decline. This topic gives you the tools to explain such a change and to judge what governments can do about it.

Must-know for this topic:

Part Key content
distribution physical and human factors; density; megacities; core and periphery
measures birth and death rates; natural increase; doubling time; fertility
change the demographic transition model; population pyramids; dependency ratio
policy ageing and youthful populations; pro- and anti-natalist policies
migration push and pull factors; refugees; internal migration; impacts
Vocabulary Train
English
core/kɔː/
1.2

Where people live

Population distribution 人口分布 is the pattern of where people live. It depends on physical factors 自然因素 (climate, water, relief and soil) and human factors 人文因素 (jobs, transport, history and government policy). In China, about 94% of people live east of the "Hu Line", a line drawn from Heihe in the north-east to Tengchong in the south-west, on about 43% of the land. The west is high, dry and cold.

Population density 人口密度 is people per square kilometre:

$$\text{density} = \frac{\text{population}}{\text{area}}$$

Dividing by farmland instead of total area gives the physiological density 生理密度, which shows the pressure on the land that grows food.

Bars comparing arithmetic, physiological and agricultural density for an illustrative desert country with little arable land

The same population gives very different densities depending on which land you divide by

People also move towards cities. A megacity 超大城市 has more than 10 million people; there were 33 in 2018 (UN), including Shanghai, Beijing, Chongqing and Guangzhou. Inside a country, a rich, well-connected core region 核心区 (such as the Yangtze River Delta) attracts people, money and ideas from a poorer periphery 边缘区.

Vocabulary Train
English
population distribution/ˌpɒpjʊˈleɪʃn ˌdɪstrɪˈbjuːʃn/
physical factor
human factor
population density/ˌpɒpjʊˈleɪʃn ˈdensɪti/
physiological density/ˌfɪzɪəˈlɒdʒɪkl ˈdensɪti/
megacity/ˈmeɡəsɪti/
periphery/pəˈrɪfəri/
core region
1.3

Measuring population change

Measure Meaning
crude birth rate 粗出生率 (CBR) live births per 1,000 people per year
crude death rate 粗死亡率 (CDR) deaths per 1,000 people per year
natural increase 自然增长 CBR minus CDR
total fertility rate 总和生育率 (TFR) the average number of children a woman has

A TFR of about 2.1 is the replacement level 更替水平: each generation just replaces itself. China's TFR is about 1.0; Niger's is about 6.

Worked example. A country has a CBR of 24 and a CDR of 8 per 1,000.

  • Natural increase = 24 − 8 = 16 per 1,000 = 1.6% a year.
  • Doubling time 倍增时间 ≈ 70 ÷ growth rate in % = 70 ÷ 1.6 ≈ 44 years.

Total change also includes net migration 净迁移: people arriving minus people leaving.

Line graph of China's births and deaths from 2016 to 2024: births fall from 17.86 million to 9.54 million, deaths rise to about 11 million, crossing in 2022

China's births and deaths, 2016–2024: natural decrease began in 2022

From the graph: in 2024, natural change in China was 9.54 − 10.93 = −1.39 million.

Vocabulary Train
English
crude birth rate/kruːd bɜːθ reɪt/
crude death rate/kruːd deθ reɪt/
natural increase/ˈnætʃərəl ˈɪŋkriːs/
total fertility rate/ˈtəʊtl fɜːˈtɪlɪti reɪt/
replacement level/rɪˈpleɪsmənt ˈlevl/
doubling time/ˈdʌblɪŋ taɪm/
net migration/net maɪˈɡreɪʃn/
1.4

How populations change

The demographic transition model

The demographic transition model 人口转变模型 (DTM) shows how birth and death rates change as a country develops:

Stage Birth rate Death rate Growth Reason
1 high high slow disease, little medicine
2 high falling fast very fast clean water, vaccines, more food
3 falling low slowing education for women, cities, contraception
4 low low very slow children cost a lot; people choose small families
5 very low low or rising falling an ageing population (Japan, China)
Birth and death rate curves across five stages of the demographic transition, with the gap between them shaded as population growth

Demographic transition: death rates fall before birth rates, and the gap is population growth

The model is based on European history. It does not include migration, and it does not say how long each stage lasts: China passed through stages 2 to 4 in about 50 years, much faster than Britain.

Population pyramids and dependency

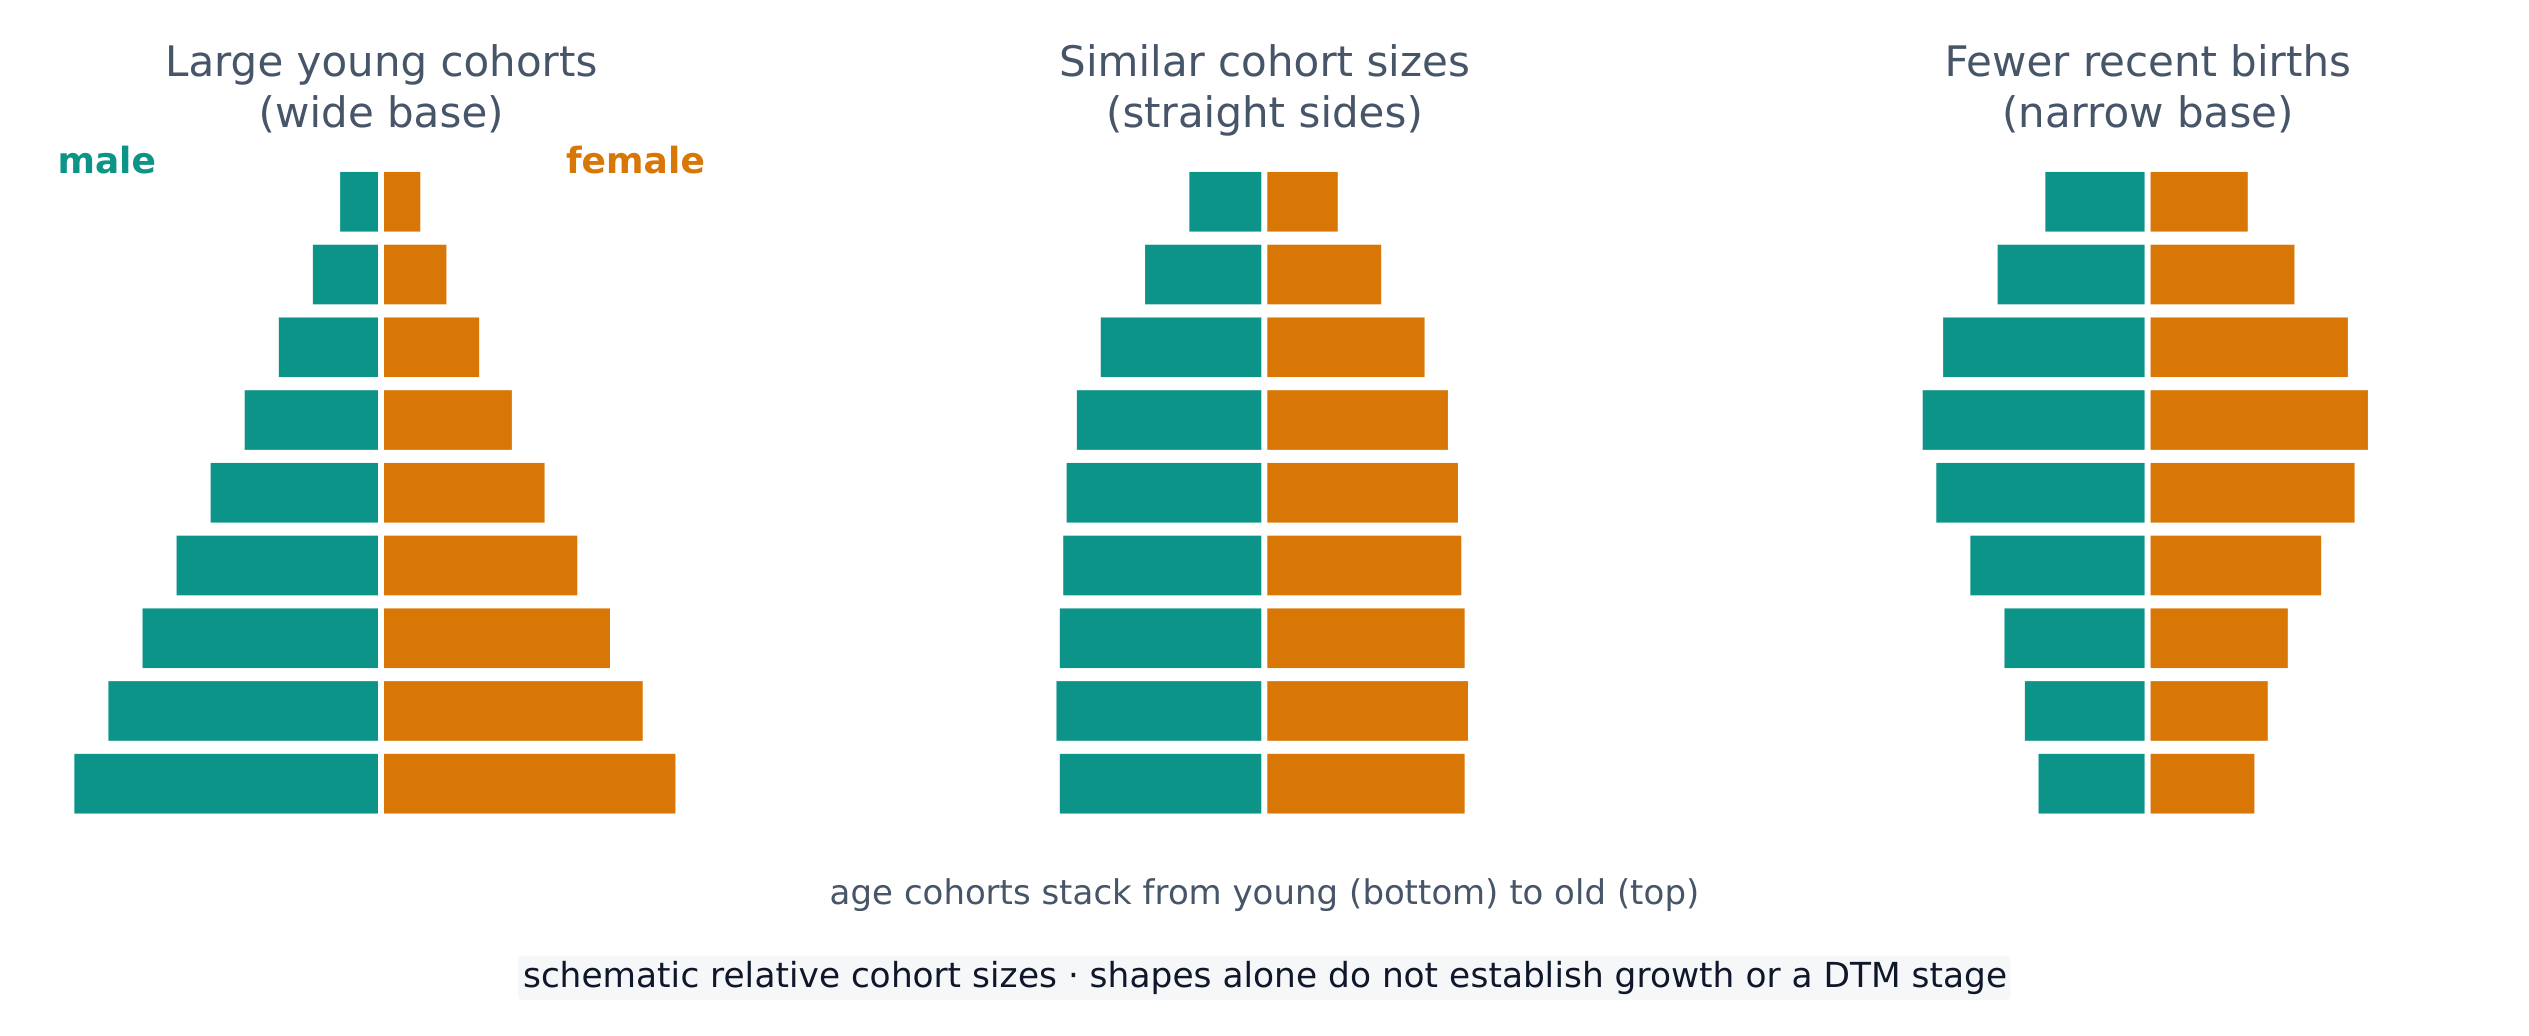
A population pyramid 人口金字塔 shows the number of males and females in each age group. A wide base means many young people; straight sides mean similar numbers at each age; a narrow base means few recent births.

Three population pyramids by sex: one with a wide base, one with nearly straight sides and one with a narrow base

A wide base means large young cohorts; straight sides mean similar cohort sizes

The dependency ratio 抚养比 compares people of non-working age with people of working age:

$$\text{dependency ratio} = \frac{\text{aged 0–14} + \text{aged 65 and over}}{\text{aged 15–64}} \times 100$$

Worked example. A town has 20,000 people aged 0–14, 15,000 aged 65 and over, and 70,000 aged 15–64. Dependency ratio = (20,000 + 15,000) ÷ 70,000 × 100 = 50. Every 100 people of working age support 50 dependants.

When birth rates fall, a country for some years has many people of working age and few dependants. This can speed up growth: the demographic dividend 人口红利. China's fast growth from the 1980s used this dividend; it is now ending.

Vocabulary Train
English
demographic transition model/ˌdeməˈɡræfɪk trænˈsɪʃn ˈmɒdl/
population pyramid/ˌpɒpjʊˈleɪʃn ˈpɪrəmɪd/
dependency ratio/dɪˈpendənsi ˈreɪʃɪəʊ/
demographic dividend
1.5

Challenges and policies

Ageing populations 人口老龄化 have more older people: Japan had about 29% of its people aged 65 and over in 2023. Problems: fewer workers, more spending on pensions and health care. Opportunities: older people care for grandchildren and volunteer, and "silver" industries grow. Youthful populations 年轻型人口 need schools and jobs; without jobs, young people may migrate or become frustrated.

Governments respond with policies:

Policy Aim Example
anti-natalist policy 限制生育政策 fewer births China's one-child policy, 1980–2015
pro-natalist policy 鼓励生育政策 more births China's two-child (2016) and three-child (2021) policies; France's family payments
ageing policy support an older population China began slowly raising the retirement age in 2025

Policies on births work slowly. China allowed three children in 2021, but births kept falling, because housing, education and childcare are expensive and many young people marry later. China's sex ratio at birth 出生性别比 was also unbalanced: about 111 boys per 100 girls in the 2020 census, against a natural level of about 105.

Vocabulary Train
English
ageing population/ˈeɪdʒɪŋ ˌpɒpjʊˈleɪʃn/
youthful population
anti-natalist policy
pro-natalist policy/prəʊ ˈneɪtəlɪst ˈpɒlɪsi/
sex ratio at birth
1.6

Migration

Migration 迁移 is a long-term move from one place to another. It can be internal 国内的 or international 国际的, and voluntary or forced.

A migrant moving from push factors at the origin (conflict, poverty, disaster, persecution) to pull factors at the destination (safety, jobs, family, freedom), past intervening obstacles

Push factors at the origin, pull factors at the destination, and intervening obstacles between

Push factors 推力因素 drive people away; pull factors 拉力因素 attract them; intervening obstacles 中间障碍 such as cost, distance and borders stop some people. There were about 280 million international migrants in 2020 (UN). A refugee 难民 has crossed a border to escape persecution or war; an internally displaced person 国内流离失所者 (IDP) has fled but stayed inside their own country.

China has one of the largest internal migrations in history: the 2020 census counted about 376 million people living outside the area where their household is registered, most of them from villages to cities in the east. Under the hukou 户口 system, many migrants could not easily use schools and health care in their new city, which is slowly changing.

Migration has effects on both places:

Place of origin Destination
benefits remittances 侨汇 (money sent home); less unemployment workers for factories and services; younger population
problems loss of young workers; children left with grandparents pressure on housing and services; tension with local people
Vocabulary Train
English
migration/maɪˈɡreɪʃn/
internal/ɪnˈtɜːnl/
international
push factor/pʊʃ ˈfæktə/
pull factor
intervening obstacle
refugee/ˈrefjuːdʒiː/
internally displaced person/ɪnˈtɜːnəli dɪˈspleɪst ˈpɜːsn/
hukou
remittance
1.7

Checklist

  • Distribution: physical and human factors; the Hu Line; arithmetic and physiological density; megacities; core and periphery.
  • Measures: CBR, CDR, natural increase, TFR and replacement level 2.1; doubling time (70 ÷ 1.6 ≈ 44 years); China's −1.39 million in 2024.
  • The DTM: five stages with reasons, and two limits.
  • Pyramids; the dependency ratio (worked example 50); the demographic dividend.
  • Ageing and youthful populations; anti- and pro-natalist policies; the sex ratio at birth.
  • Migration: push, pull and obstacles; refugees and IDPs; China's 376 million internal migrants and hukou; effects at origin and destination.
Additional notes PDF
Supported preparation: Population and spatial scale

Scope and prerequisites

IB geography first assessment 2019. School chooses two of seven options at SL and three at HL: freshwater, oceans/coasts, extreme environments, hazards, leisure/tourism/sport, food/health, urban environments. Introductory lessons do not claim to teach every option.

Mapped preparation outcomes: ib_geography_hl.1.1, ib_geography_hl.1.2. Read the matching native lesson first. Actual approved choices, evidence and final learner work remain separate.

Source vocabulary

population density 人口密度; spatial scale 空间尺度.

Explanation and worked method

Density=population/area; growth compares population over time. Natural change combines births and deaths; migration adds inflows and outflows. A regional average hides spatial variation. Development measures need comparable dates, boundaries, units and attention to distribution.

Original classroom evidence panel for Population and spatial scale

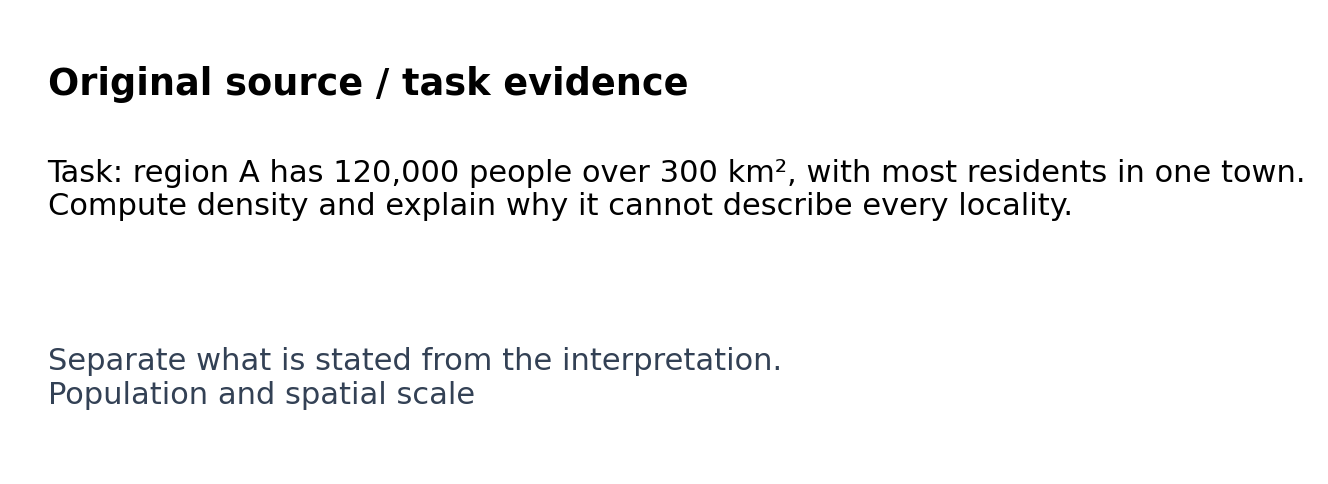
Task: region A has 120,000 people over 300 km², with most residents in one town. Compute density and explain why it cannot describe every locality.

Density=120,000 people/300 km²=400 people/km². This is an areal average, not a uniform settlement pattern. Map smaller units and compare access, income or services within them.

Independent transfer

A region adds uninhabited land to its boundary and its density falls. Does this demonstrate out-migration?

Attempt independently before reading the model.

Checked original model

Density can fall because area increases while population is unchanged. Compare fixed-boundary populations and migration records before inferring movement. The denominator change, not necessarily demographic change, explains the reported average.

These are authored formative expectations, not official IB descriptors. Accept other justified arguments with evidence and material limits.

Source and task holds

This supplement teaches the method for this part of the course. The full assessment criteria and any texts your school chooses come from your teacher.

Interactive lessons on this topic

Work through it step by step, with instant-check exercises.

More topics in International Baccalaureate · IB Diploma · Geography · HL

Log in or create account

IGCSE, A-Level & AP