Psychometrics and test construction
Scope and prerequisites
Supported GRE topic 10 (MM.1). Use the overview measurement lesson VI when interpreting research evidence. Existing official questions are traced in bank_review_form.yaml; original tasks below are not ETS items.
Concepts and method
standard error of measurement 测量标准误: The expected spread of observed scores around the true score, SD×sqrt(1−r). construct validity 构想效度: Convergent and discriminant evidence that a score reflects the intended trait.
Reliability is consistency, and its type is named by the design that produced it: the same test twice gives test-retest reliability; two similar forms give alternate-forms reliability; consistency within one sitting (split-half, Cronbach alpha) is internal consistency; agreement between scorers is inter-rater reliability. The Spearman-Brown formula r_full=2r/(1+r) rescales a half-test correlation to full test length: r=.80 becomes about .89.
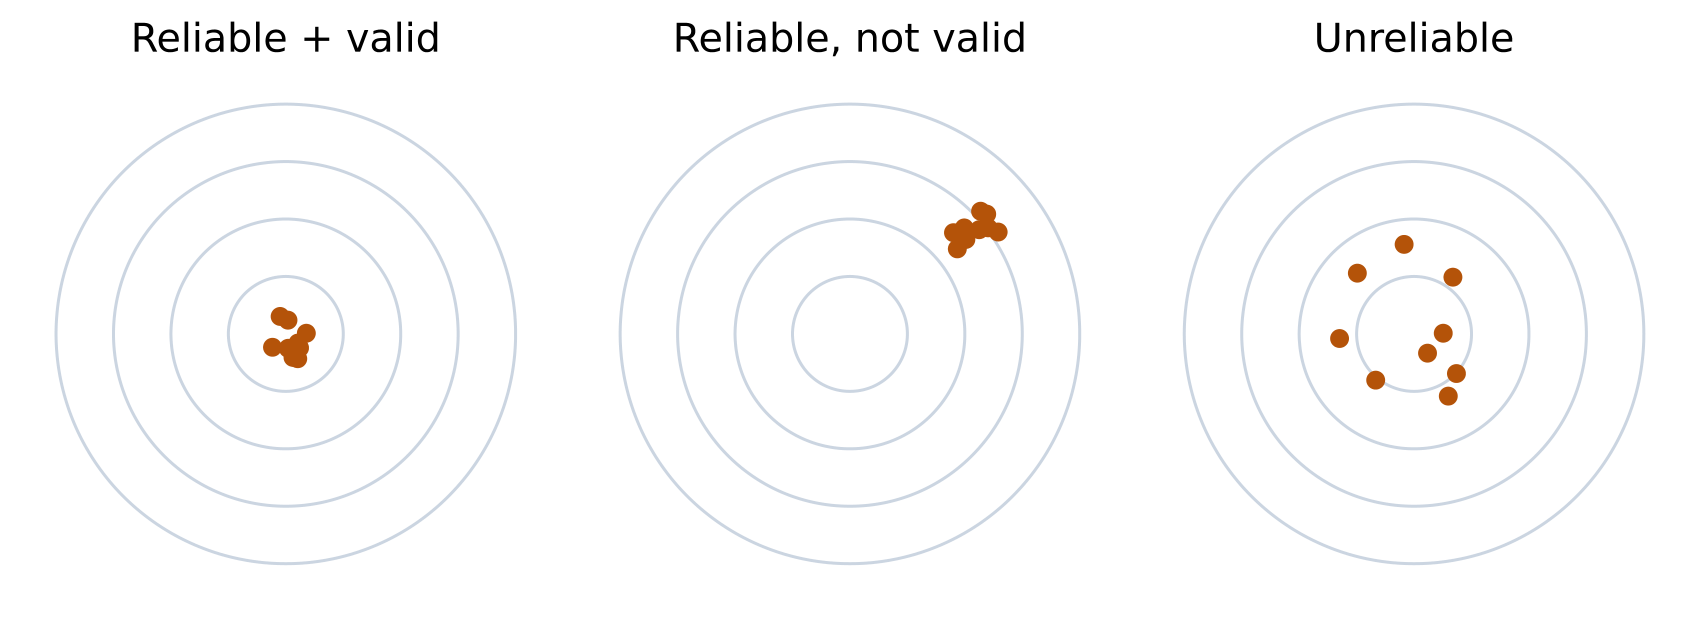
Validity is evidence for the proposed interpretation, not of the test itself: content validity asks whether items cover the domain; criterion validity relates scores to an outcome, concurrently or predictively; construct validity assembles convergent and discriminant evidence that the score tracks the intended trait. Reliability caps validity but never establishes it: a consistent scale can systematically measure something else.
Standard scores re-express raw scores against a norm group: z=(X−mean)/SD, T=50+10z, and Wechsler deviation IQ=100+15z. A z of +2 gives IQ 130 and about the 98th percentile. The standard error of measurement SEM=SD×sqrt(1−r) converts reliability into a score band: SD=15 with r=.91 gives SEM=15×sqrt(.09)=4.5.
Item analysis checks each item: difficulty p is the proportion answering correctly, and discrimination is the item-total correlation. Items that nearly everyone or no one answers correctly carry little information; negative discrimination flags a likely miskeyed or misleading item.
Choose the reliability coefficient by the source of variation being studied. A standard error of measurement concerns measurement uncertainty under a model; it is not the standard error of a sample mean. The Spearman–Brown estimate assumes sufficiently comparable halves; a formula cannot repair unrelated item content. Standard scores describe relative position and do not show that a test measures the intended construct fairly across groups.
Worked reasoning
Two similar vocabulary tests given a week apart with r=.90 show alternate-forms reliability, not test-retest, because the form changed. With SD=15 and reliability .91, SEM=4.5 points. A z of +2 corresponds to IQ 130. A split-half correlation of .80 corrects to 2×.80/1.80≈.89 at full length.
A fictional scale has mean 50 points, SD 10 points and reliability .84. A score is 65. Compute z and SEM, showing the formulas.
z=(X−mean)/SD; z=(65 points−50 points)/(10 points)=1.5, dimensionless. SEM=SD√(1−r); SEM=(10 points)√(1−.84)=4 points. SEM is a model-based uncertainty measure, not proof of validity. T=50+10z; T=50+10(1.5)=65 on the T scale.
Independent transfer
Two raters repeatedly disagree by five points but rank scripts identically. Does a high correlation establish agreement? Suggest a check.
Attempt independently, then use the matching skill sheet solution.
Review and source limits
Avoid this error: Calling a two-different-forms correlation test-retest reliability, or citing high reliability as if it were validity evidence. Teaching scope comes from teaching.yaml and the source/key/crop review in bank_review_form.yaml. Detailed current diagnostic criteria require an authenticated manual; neither historical ETS practice nor this educational reference certifies them.