English
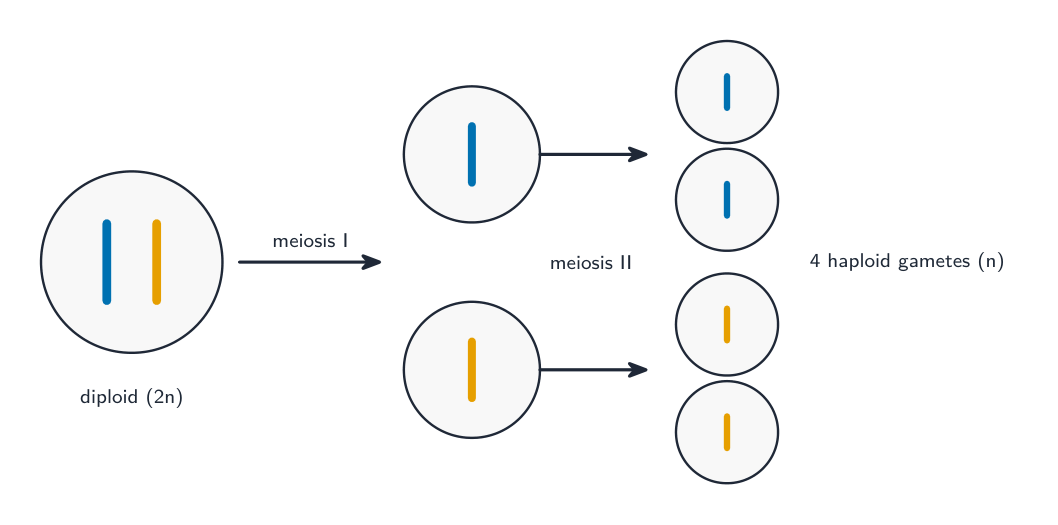
- explain the meanings of the terms haploid (n) and diploid (2n)
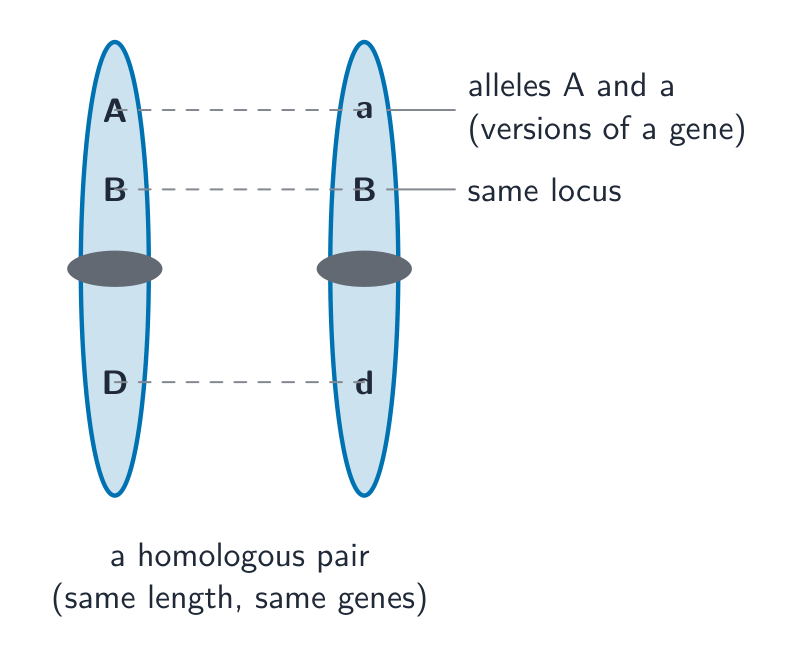
- explain what is meant by homologous pairs of chromosomes
- explain the need for a reduction division during meiosis in the production of gametes
- describe the behaviour of chromosomes in plant and animal cells during meiosis and the associated behaviour of the nuclear envelope, the cell surface membrane and the spindle (names of the main stages of meiosis, but not the sub-divisions of prophase I, are expected: prophase I, metaphase I, anaphase I, telophase I, prophase II, metaphase II, anaphase II and telophase II)
- interpret photomicrographs and diagrams of cells in different stages of meiosis and identify the main stages of meiosis
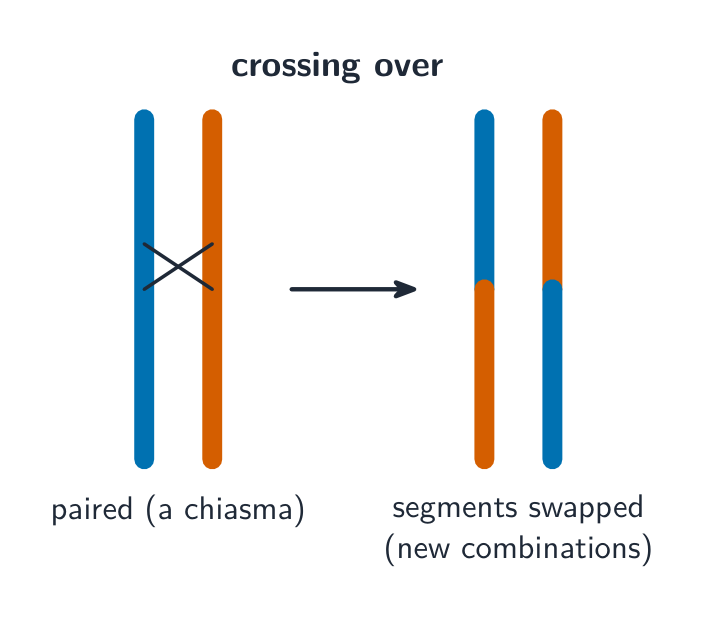
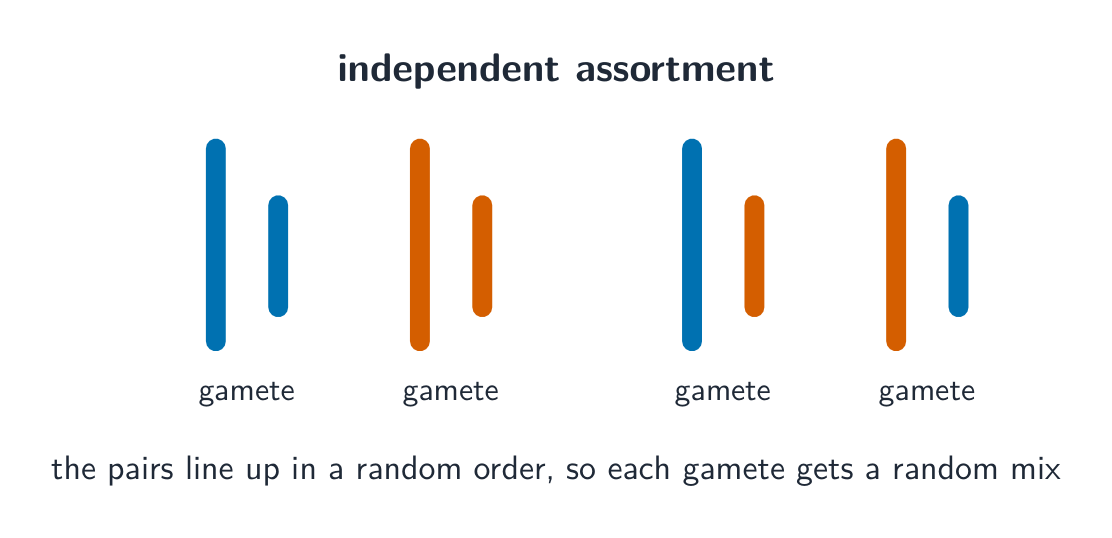
- explain that crossing over and random orientation (independent assortment) of pairs of homologous chromosomes and sister chromatids during meiosis produces genetically different gametes
- explain that the random fusion of gametes at fertilisation produces genetically different individuals
Bahasa Indonesia
- Jelaskan arti istilah haploid (n) dan diploid (2n)
- Jelaskan apa yang dimaksud dengan pasangan homolog kromosom
- Jelaskan perlunya pembeluruhan reduksi selama meiosis dalam produksi gamet
- Jelaskan perilaku kromosom pada sel tumbuhan dan hewan selama meiosis dan perilaku terkait dari selubung nukleus, membran permukaan sel dan gelendong (nama-nama tahap utama meiosis, bukan sub-pembagian profase I, diharapkan: profase I, metafase I, anafase I, telofase I, profase II, metafase II, anafase II dan telofase II)
- Interpretasikan fotomikrograf dan diagram sel pada berbagai tahap meiosis dan identifikasi tahap utama meiosis
- jelaskan bahwa pindah silang dan orientasi acak (assortemen independen) dari pasangan kromosom homolog dan kromatid saudara selama meiosis menghasilkan gamet yang berbeda secara genetik
- jelaskan bahwa fusi acak gamet pada fertilisasi menghasilkan individu yang berbeda secara genetik
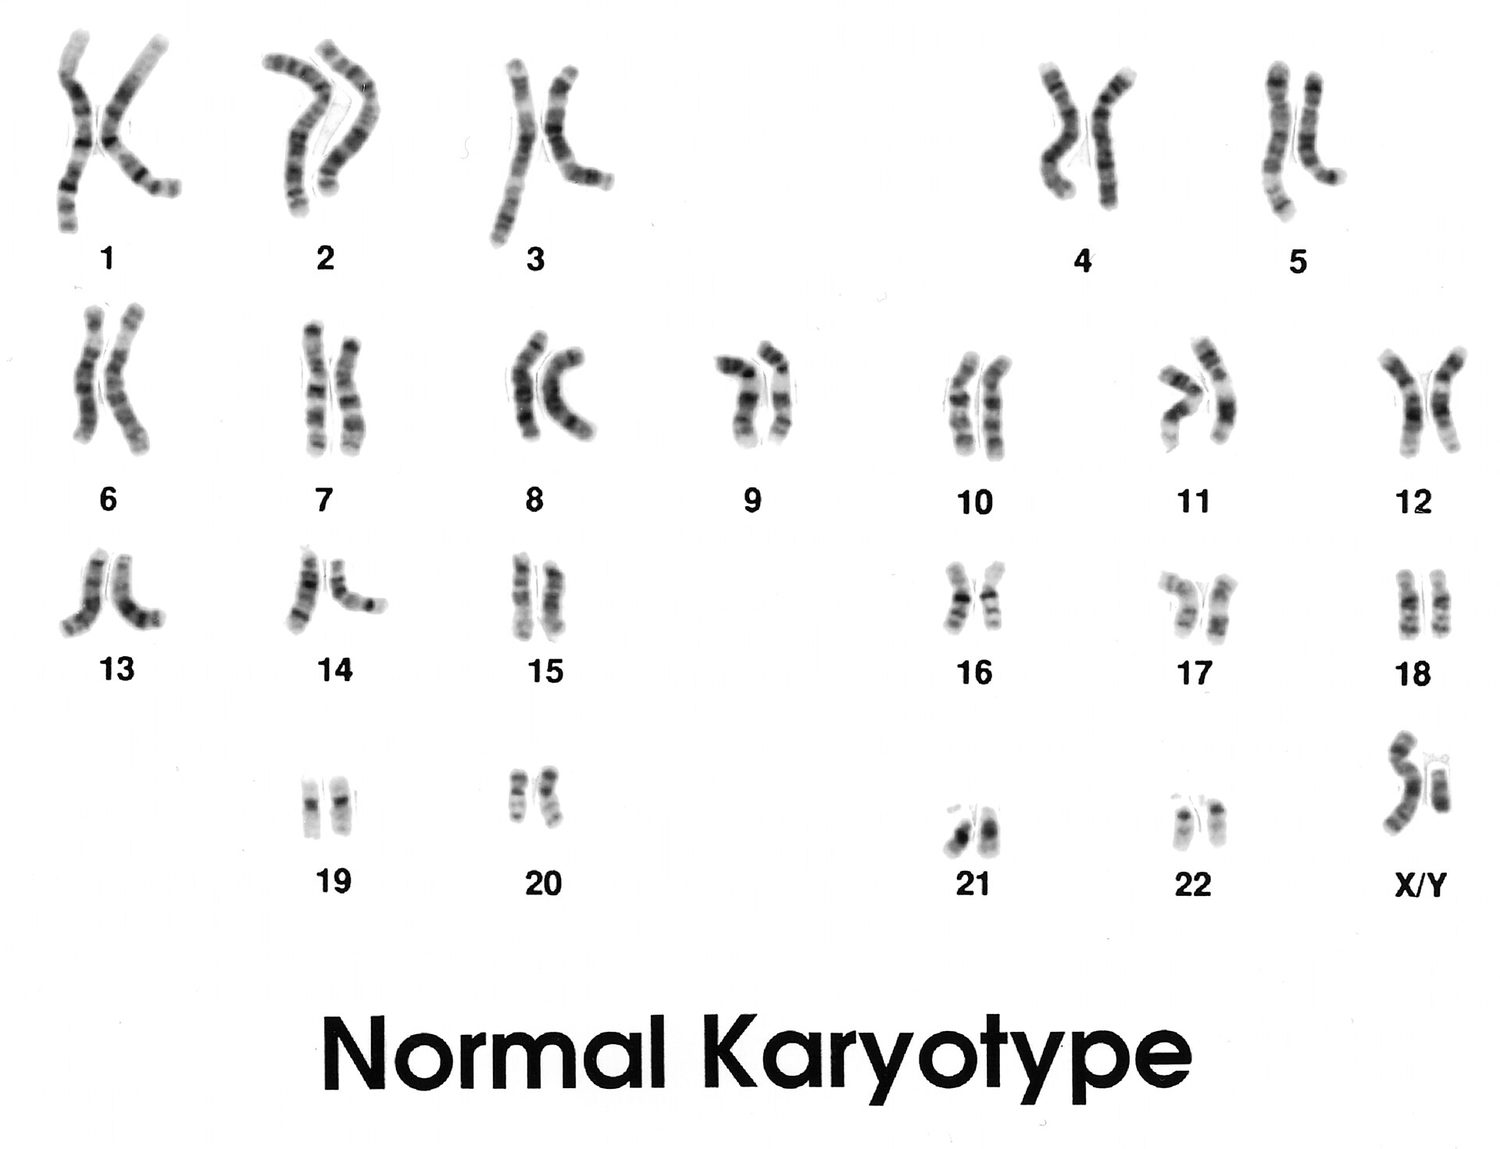 Kariotipe manusia: 46 kromosom yang disusun menjadi 23 pasangan homolog (pasangan terakhir, X dan Y, menunjukkan bahwa ini adalah jantan)*